
|
市場調査レポート
商品コード
1685130
エンベデッドファイナンス市場の機会、成長促進要因、産業動向分析、2025年~2034年の予測Embedded Finance Market Opportunity, Growth Drivers, Industry Trend Analysis, and Forecast 2025 - 2034 |
||||||
カスタマイズ可能
|
|||||||
| エンベデッドファイナンス市場の機会、成長促進要因、産業動向分析、2025年~2034年の予測 |
|
出版日: 2025年01月08日
発行: Global Market Insights Inc.
ページ情報: 英文 180 Pages
納期: 2~3営業日
|

全表示
- 概要
- 目次
世界のエンベデッドファイナンス市場の2024年の市場規模は1,048億米ドルで、2025年から2034年にかけてCAGR 23.3%という驚異的な成長が見込まれています。
この急速な拡大には、消費者と企業の双方によるデジタル決済の採用拡大が大きく寄与しています。日常的な取引に便利で統合された金融ソリューションを求める個人が増えるにつれ、企業は金融サービスを自社のプラットフォームに直接組み込むようになっています。デジタル技術を活用することで、金融機関やハイテク企業は金融サービスの提供方法に革命をもたらし、シームレスなユーザー体験を可能にしています。摩擦のない取引への需要が高まる中、ハイテクに精通し、デジタルに接続された人々のニーズに応えるため、あらゆる業界がエンベデッドファイナンスモデルの導入を急いでいます。
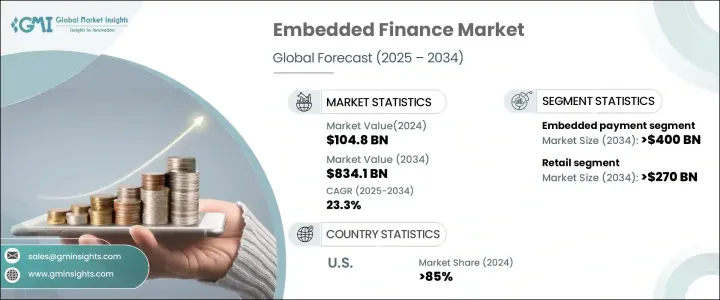
市場は、決済、保険、投資、融資、銀行など、サービスの種類によって細分化されています。このうち、組み込み型決済分野は2024年に45%のシェアを占めて市場をリードし、2034年には4,000億米ドルという驚異的な規模になると予想されています。この成長の大きな原動力となっているのが、従来の金融サービスモデルを破壊しつつある分散型金融(DeFi)の台頭です。ブロックチェーン技術を通じて、プラットフォームは暗号通貨による支払い、融資、ステーキングをサービスに統合することができます。このアプローチは、従来の銀行仲介の必要性をなくし、より安全で直接的な取引プロセスを提供し、テクノロジー主導の若い消費者にアピールします。DeFiはまた、金融商品をより利用しやすくし、従来の銀行インフラへの依存度を下げることで、特に銀行口座の少ない地域における金融包摂の扉を開きます。
| 市場範囲 | |
|---|---|
| 開始年 | 2024 |
| 予測年 | 2025-2034 |
| 開始金額 | 1,048億米ドル |
| 予測金額 | 8,341億米ドル |
| CAGR | 23.3% |
エンベデッドファイナンス市場は、小売、ヘルスケア、ロジスティクス、製造、旅行・エンターテインメントなど、いくつかの主要セクターで活用されています。中でも小売業は、2034年までに2,700億米ドルを創出すると予測されています。この成長の主な要因は、顧客のロイヤルティプログラムに金融商品が統合されていることです。小売企業は、デジタル・ウォレット、提携クレジットカード、POSファイナンス・オプションを採用しており、これらはすべて顧客エンゲージメントを高めるのに役立っています。このような金融ソリューションを組み込むことで、消費者は割引やキャッシュバック、特別オファーと交換可能なポイントを獲得できる一方、小売業者は顧客の購買行動に関する深い洞察を得ることができ、マーケティング戦略の改善に役立てることができます。
2024年、エンベデッドファイナンス市場は米国が85%の市場シェアを占めました。伝統的な銀行がデジタル・プラットフォームを広く採用していることが、この成長の主な理由です。これらの銀行は、ショッピング、予約、エンターテイメントなど、金融以外のサービスをデジタルサービスに組み込むことで適応しています。小売業者やサービス・プロバイダーとの戦略的提携を通じて、銀行は消費者に幅広いサービスを提供するオール・イン・ワンのエコシステムを構築しており、これにより消費者は財務管理を容易にし、好きなブランドと関わることができます。こうした取り組みは、顧客維持を強化するだけでなく、手数料やデータの収益化を通じて新たな収益源も生み出しています。
目次
第1章 調査手法と調査範囲
- 調査デザイン
- 調査アプローチ
- データ収集方法
- 基本推定と計算
- 基準年の算出
- 市場推計の主要動向
- 予測モデル
- 1次調査と検証
- 一次情報
- データマイニングソース
- 市場定義
第2章 エグゼクティブサマリー
第3章 業界洞察
- エコシステム分析
- サプライヤーの状況
- プラットフォームプロバイダー
- 決済プロセッサー
- 貸出プラットフォーム
- テクノロジープロバイダー
- エンドユーザー
- 利益率分析
- テクノロジーの差別化要因
- API主導の統合
- クラウド・ネイティブ・アーキテクチャ
- ブロックチェーン技術
- オープン・バンキング・プロトコル
- その他
- 主なニュースと取り組み
- 特許分析
- 規制状況
- 影響要因
- 促進要因
- デジタル決済導入の増加
- banking-as-a-serviceプラットフォームの採用拡大
- カスタマー・エクスペリエンスへの注目の高まり
- 収益多様化の機会の拡大
- 業界の潜在的リスク&課題
- セキュリティと不正行為のリスク
- 技術統合の複雑さ
- 促進要因
- 成長可能性分析
- ポーター分析
- PESTEL分析
第4章 競合情勢
- イントロダクション
- 企業シェア分析
- 競合のポジショニング・マトリックス
- 戦略展望マトリックス
第5章 市場推計・予測:サービス別、2021年~2034年
- 主要動向
- 決済
- 保険
- 投資
- 融資
- バンキング
第6章 市場推計・予測:ビジネスモデル別、2021年~2034年
- 主要動向
- B2B
- B2C
第7章 市場推計・予測:最終用途別、2021年~2034年
- 主要動向
- 小売
- ヘルスケア
- 物流
- 製造業
- 旅行・エンターテイメント
- その他
第8章 市場推計・予測:地域別、2021年~2034年
- 主要動向
- 北米
- 米国
- カナダ
- 欧州
- 英国
- ドイツ
- フランス
- スペイン
- イタリア
- ロシア
- 北欧
- アジア太平洋
- 中国
- インド
- 日本
- 韓国
- ニュージーランド
- 東南アジア
- ラテンアメリカ
- ブラジル
- メキシコ
- アルゼンチン
- 中東・アフリカ
- UAE
- 南アフリカ
- サウジアラビア
第9章 企業プロファイル
- Banxware
- Cross River
- Cybrid Technology
- Finastra
- FinBox
- Finix
- Fluenccy
- Flywire
- Fortis Payment Systems
- Lendflow
- Marqeta
- Parafin
- PayPal
- PAYRIX
- Stripe
- Transcard Payments
- TreviPay
- Walnut Insurance
- Zopa Bank
The Global Embedded Finance Market was valued at USD 104.8 billion in 2024, with expectations to grow at an impressive CAGR of 23.3% from 2025 to 2034. This rapid expansion is largely fueled by the growing adoption of digital payments by both consumers and businesses. As more individuals demand convenient, integrated financial solutions for everyday transactions, businesses are increasingly embedding financial services directly into their platforms. By leveraging digital technologies, financial institutions, and tech companies are revolutionizing how financial services are delivered, allowing for seamless user experiences. As the demand for frictionless transactions rises, industries across the board are rushing to implement embedded finance models to cater to the needs of a tech-savvy, digitally connected population.
The market is segmented by service types, including payments, insurance, investment, lending, and banking. Of these, the embedded payments segment led the market in 2024, accounting for a 45% share, and is expected to generate a staggering USD 400 billion by 2034. A major driver behind this growth is the rise of decentralized finance (DeFi), which is disrupting the traditional financial services model. Through blockchain technology, platforms are able to integrate cryptocurrency payments, lending, and staking into their services. This approach removes the need for traditional banking intermediaries, offering a more secure and direct transaction process that appeals to younger, technology-driven consumers. DeFi also opens the door for financial inclusion, particularly in underbanked regions, by making financial products more accessible and less reliant on traditional banking infrastructure.
| Market Scope | |
|---|---|
| Start Year | 2024 |
| Forecast Year | 2025-2034 |
| Start Value | $104.8 Billion |
| Forecast Value | $834.1 Billion |
| CAGR | 23.3% |
The embedded finance market is utilized across several key sectors, such as retail, healthcare, logistics, manufacturing, and travel & entertainment. Among these, retail is projected to generate USD 270 billion by 2034. A key factor contributing to this growth is the integration of financial products into customer loyalty programs. Retailers are embracing digital wallets, co-branded credit cards, and point-of-sale financing options, all of which help boost customer engagement. These embedded financial solutions allow consumers to earn redeemable points for discounts, cashback, and special offers while retailers gain deeper insights into customer purchasing behavior, which can be used to refine marketing strategies.
In 2024, the U.S. dominated the embedded finance market with an 85% market share. The widespread adoption of digital platforms by traditional banks is a key reason for this growth. These banks are adapting by incorporating non-financial services-such as shopping, booking, and entertainment-into their digital offerings. Through strategic partnerships with retailers and service providers, banks are creating all-in-one ecosystems that offer consumers a wide range of services, making it easier for them to manage their finances and engage with the brands they love. These initiatives not only enhance customer retention but also create new revenue streams through commissions and data monetization.
Table of Contents
Chapter 1 Methodology & Scope
- 1.1 Research design
- 1.1.1 Research approach
- 1.1.2 Data collection methods
- 1.2 Base estimates and calculations
- 1.2.1 Base year calculation
- 1.2.2 Key trends for market estimates
- 1.3 Forecast model
- 1.4 Primary research & validation
- 1.4.1 Primary sources
- 1.4.2 Data mining sources
- 1.5 Market definitions
Chapter 2 Executive Summary
- 2.1 Industry 3600 synopsis, 2021 - 2034
Chapter 3 Industry Insights
- 3.1 Industry ecosystem analysis
- 3.2 Supplier landscape
- 3.2.1 Platform providers
- 3.2.2 Payment processors
- 3.2.3 Lending platforms
- 3.2.4 Technology providers
- 3.2.5 End users
- 3.3 Profit margin analysis
- 3.4 Technology differentiators
- 3.4.1 API-driven integration
- 3.4.2 Cloud-native architecture
- 3.4.3 Blockchain technology
- 3.4.4 Open banking protocols
- 3.4.5 Others
- 3.5 Key news & initiatives
- 3.6 Patent analysis
- 3.7 Regulatory landscape
- 3.8 Impact forces
- 3.8.1 Growth drivers
- 3.8.1.1 Rising digital payments adoption
- 3.8.1.2 Growing adoption of banking-as-a-service platforms
- 3.8.1.3 Increasing focus on customer experience
- 3.8.1.4 Growing revenue diversification opportunities
- 3.8.2 Industry pitfalls & challenges
- 3.8.2.1 Security and fraud risks
- 3.8.2.2 Technical integration complexity
- 3.8.1 Growth drivers
- 3.9 Growth potential analysis
- 3.10 Porter’s analysis
- 3.11 PESTEL analysis
Chapter 4 Competitive Landscape, 2024
- 4.1 Introduction
- 4.2 Company market share analysis
- 4.3 Competitive positioning matrix
- 4.4 Strategic outlook matrix
Chapter 5 Market Estimates & Forecast, By Service, 2021 - 2034 ($Bn)
- 5.1 Key trends
- 5.2 Payment
- 5.3 Insurance
- 5.4 Investment
- 5.5 Lending
- 5.6 Banking
Chapter 6 Market Estimates & Forecast, By Business Model, 2021 - 2034 ($Bn)
- 6.1 Key trends
- 6.2 B2B
- 6.3 B2C
Chapter 7 Market Estimates & Forecast, By End Use, 2021 - 2034 ($Bn)
- 7.1 Key trends
- 7.2 Retail
- 7.3 Healthcare
- 7.4 Logistics
- 7.5 Manufacturing
- 7.6 Travel & entertainment
- 7.7 Others
Chapter 8 Market Estimates & Forecast, By Region, 2021 - 2034 ($Bn)
- 8.1 Key trends
- 8.2 North America
- 8.2.1 U.S.
- 8.2.2 Canada
- 8.3 Europe
- 8.3.1 UK
- 8.3.2 Germany
- 8.3.3 France
- 8.3.4 Spain
- 8.3.5 Italy
- 8.3.6 Russia
- 8.3.7 Nordics
- 8.4 Asia Pacific
- 8.4.1 China
- 8.4.2 India
- 8.4.3 Japan
- 8.4.4 South Korea
- 8.4.5 ANZ
- 8.4.6 Southeast Asia
- 8.5 Latin America
- 8.5.1 Brazil
- 8.5.2 Mexico
- 8.5.3 Argentina
- 8.6 MEA
- 8.6.1 UAE
- 8.6.2 South Africa
- 8.6.3 Saudi Arabia
Chapter 9 Company Profiles
- 9.1 Banxware
- 9.2 Cross River
- 9.3 Cybrid Technology
- 9.4 Finastra
- 9.5 FinBox
- 9.6 Finix
- 9.7 Fluenccy
- 9.8 Flywire
- 9.9 Fortis Payment Systems
- 9.10 Lendflow
- 9.11 Marqeta
- 9.12 Parafin
- 9.13 PayPal
- 9.14 PAYRIX
- 9.15 Stripe
- 9.16 Transcard Payments
- 9.17 TreviPay
- 9.18 Walnut Insurance
- 9.19 Zopa Bank

