|
|
市場調査レポート
商品コード
1544674
Web3ゲーム市場、市場機会、成長促進要因、産業動向分析と予測、2024-2032年Web3 Gaming Market, Opportunity, Growth Drivers, Industry Trend Analysis and Forecast, 2024-2032 |
||||||
|
|||||||
カスタマイズ可能
|
|||||||

| Web3ゲーム市場、市場機会、成長促進要因、産業動向分析と予測、2024-2032年 |
|
出版日: 2024年07月11日
発行: Global Market Insights Inc.
ページ情報: 英文 270 Pages
納期: 2~3営業日
|

全表示
- 概要
- 目次
Web3ゲームの市場規模は、2024年から2032年の間にCAGR 19.2%以上で成長すると予測されており、主にゲームエコシステムへのブロックチェーン技術と分散型金融(DeFi)の注入が燃料となっています。
ブロックチェーンを活用することで、Web3ゲームはプレイヤーに非代替性トークン(NFT)を通じたゲーム内資産の真の所有権を付与します。プレイヤーは様々なゲームやプラットフォームで、これらの資産を取引、売却、利用することができます。例えば2024年8月、Web3ゲームのNotcoinはNFTのコレクションであるLost DogsおよびGetgemsと提携し、物語主導のWeb3ゲームを開始しました。
メタバースが進化するにつれて、Web3ゲームプラットフォームは仮想領域に組み込まれ、メタバースの壮大なビジョンに共鳴する没入体験とデジタル所有権を提供しています。大手ハイテク企業やベンチャーキャピタルがWeb3ゲーム構想に多額の投資を行っていることと、仮想現実や拡張現実に対する消費者の憧れが高まっていることも、市場の成長を後押しすると思われます。
ゲームの種類別では、ストラテジーゲーム分野のWeb3ゲーム市場規模が2024年から2032年にかけて成長する見通しです。ストラテジーゲームは、資産の真の所有権、分散型意思決定、プレイヤー主導の経済といったWeb3の特性から大きな利益を得る見込みです。NFTとブロックチェーン資産を統合することで、これらのゲームはプレイヤーにユニークで取引可能な要素を提供し、より深い関与と投資を促進します。
エンドユーザーの観点から見ると、コレクターセグメントによるWeb3ゲーム市場は、2024年から2032年にかけて大きなCAGRを記録すると見られています。コレクターは、希少なデジタルアイテム、特に所有権と名声を与えるNFTを入手、取引、展示する機会を求めてWeb3プラットフォームに引き寄せられます。このようなデジタル収集品への情熱は、プレイヤーのエンゲージメントを高めるだけでなく、コレクターがユニークな資産を持つゲームに投資し、チャンピオンになる原動力にもなっています。
アジア太平洋地域のWeb3ゲーム産業は、デジタル経済の急成長、スマートフォンの高い普及率、強固なゲーム文化により、2024年から2032年にかけて顕著な成長を遂げると予想されます。急速に拡大するインターネットインフラとハイテクに精通した人口を抱えるアジア太平洋地域は、ブロックチェーンやNFTを含む革新的なWeb3ゲーム技術の温床となっています。さらに、ブロックチェーンやゲームの新興企業に対する規制環境の支援や、現地のハイテク大手やベンチャーキャピタルからの多額の投資が、この地域の市場成長をさらに後押しする可能性があります。
目次
第1章 調査範囲と調査手法
- 市場の範囲と定義
- 基本推定と計算
- 予測パラメータ
- データソース
- 1次データ
- 2次データ
- 有料ソース
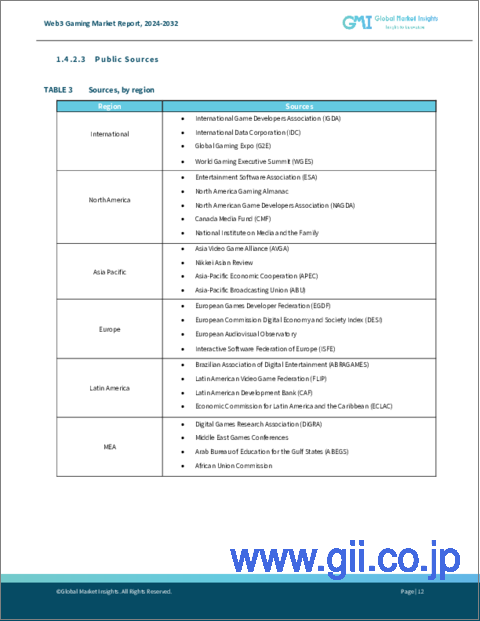
- 公的情報源
第2章 エグゼクティブサマリー
第3章 業界洞察
- エコシステム分析
- ベンダー・マトリックス
- テクノロジーとイノベーションの展望
- 特許分析
- 主要ニュースとイニシアチブ
- 規制状況
- 影響要因
- 促進要因
- ブロックチェーン技術の採用拡大
- 非代替性トークン(NFT)の成長
- P2E(Play-to-Earn)モデルの人気の高まり
- セキュリティと透明性の向上
- 投資と資金調達の増加
- 業界の潜在的リスク&課題
- 技術的な複雑さ
- 暗号通貨とNFTのボラティリティ
- 促進要因
- 成長可能性分析
- ポーター分析
- PESTEL分析
第4章 競合情勢
- 企業シェア分析
- 競合のポジショニング・マトリックス
- 戦略展望マトリックス
第5章 市場推計・予測:ゲームタイプ別、2021年~2032年
- 主要動向
- パズルゲーム・トリビアゲーム
- ロールプレイングゲーム(RPG)
- スポーツ・レースゲーム
- ストラテジーゲーム
- バーチャルワールド
- その他
第6章 市場推計・予測:デバイスタイプ別、2021年~2032年
- 主要動向
- PC/デスクトップ
- モバイル
- コンソール
- VR/AR
第7章 市場推計・予測:ゲーム内課金別、2021年~2032年
- 主要動向
- 米ドル
- ゲーム内課金
- USDC
- その他
第8章 市場推計・予測:モード別、2021年~2032年
- 主要動向
- プレイ・トゥ・イヤー(P2E)
- フリートゥプレイ(F2P)
- サブスクリプション型
- ハイブリッドモデル
第9章 市場推計・予測:エンドユーザー別、2021年~2032年
- 主要動向
- カジュアルゲーマー
- ハードコアゲーマー
- 投資家/投機家
- コレクター
- コミュニティ形成者
第10章 市場推計・予測:地域別、2021年~2032年
- 主要動向
- 北米
- 米国
- カナダ
- 欧州
- 英国
- ドイツ
- フランス
- イタリア
- スペイン
- その他欧州
- アジア太平洋
- 中国
- インド
- 日本
- 韓国
- ニュージーランド
- その他アジア太平洋地域
- ラテンアメリカ
- ブラジル
- メキシコ
- その他ラテンアメリカ
- 中東・アフリカ
- UAE
- サウジアラビア
- 南アフリカ
- その他中東・アフリカ
第11章 企業プロファイル
- Axie Infinity(Sky Mavis Pte. Ltd.)
- Aavegotchi(Pixelcraft Studios Ltd.)
- Alien Worlds
- Animoca Brands Corporation Limited
- Aurory Project Inc.
- Dapper Labs Inc.
- Decentraland Foundation
- Enjin Pte. Ltd.
- Forte Labs, Inc.
- Gala Games, Inc.
- Gods Unchained
- Illuvium Labs Ltd.
- Immutable Pty Ltd
- MOBOX Ltd.
- Mythical, Inc.
- OpenSea(Ozone Networks, Inc.)
- Sky Mavis Pte. Ltd.
- Sorare SAS
- Splinterlands Inc.
- Star Atlas(Automata Pte. Ltd.)
- SuperRare Labs, Inc.
- The Sandbox, a subsidiary of Animoca Brands
- Ubisoft Entertainment S.A.
- Vulcan Forged Ltd.
- Yield Guild Games Ltd.
Web3 gaming market size is anticipated to grow at over 19.2% CAGR between 2024 and 2032 primarily fueled by the infusion of blockchain technology and decentralized finance (DeFi) into gaming ecosystems. By harnessing blockchain, Web3 gaming grants players genuine ownership of in-game assets via non-fungible tokens (NFTs). Players can trade, sell, or utilize these assets across various games and platforms. For example, in August 2024, the Web3 game Notcoin partnered with the NFT collections Lost Dogs and Getgems to launch a narrative-driven Web3 game.
As the metaverse evolves, Web3 gaming platforms are embedding themselves into these virtual realms, providing immersive experiences and digital ownership that resonate with the metaverse's grand vision. The significant investments from leading tech firms and venture capitalists into Web3 gaming initiatives, coupled with a rising consumer fascination with virtual and augmented realities will also bolster market growth.
The overall industry is divided into game type, device type, in-game purchase, mode, end user, and region.
Based on game type, the Web3 gaming market size from the strategy games segment is poised to grow between 2024 and 2032. Strategy games stand to gain immensely from Web3 attributes like genuine ownership of assets, decentralized decision-making, and economies driven by players. By integrating NFTs and blockchain assets, these games provide players with unique, tradable elements, fostering deeper engagement and investment.
In terms of end user, the Web3 gaming market from the collector segment is set to witness a significant CAGR from 2024 to 2032. Collectors gravitate towards Web3 platforms for the chance to acquire, trade, and display rare digital items, especially NFTs, which confer ownership and prestige. This passion for digital collectibles not only boosts player engagement but also drives collectors to invest in and champion games with unique assets.
Asia Pacific Web3 gaming industry is expected to accrue notable growth from 2024 to 2032 attributed to the burgeoning digital economy, high smartphone penetration, and strong gaming culture. APAC, with its rapidly expanding internet infrastructure and tech-savvy population, is a hotbed for innovative Web3 gaming technologies, including blockchain and NFTs. Additionally, supportive regulatory environments and substantial investments from local tech giants and venture capitalists in blockchain and gaming startups may further fuel regional market growth.
Table of Contents
Chapter 1 Scope and Methodology
- 1.1 Market scope and definition
- 1.2 Base estimates and calculations
- 1.3 Forecast parameters
- 1.4 Data sources
- 1.4.1 Primary
- 1.4.2 Secondary
- 1.4.2.1 Paid sources
- 1.4.2.2 Public sources
Chapter 2 Executive Summary
- 2.1 Industry 360º synopsis, 2021 - 2032
Chapter 3 Industry Insights
- 3.1 Industry ecosystem analysis
- 3.2 Vendor matrix
- 3.3 Technology and innovation landscape
- 3.4 Patent analysis
- 3.5 Key news and initiatives
- 3.6 Regulatory landscape
- 3.7 Impact forces
- 3.7.1 Growth drivers
- 3.7.1.1 Increasing adoption of blockchain technology
- 3.7.1.2 Growth of non-fungible tokens (NFTs)
- 3.7.1.3 Growing popularity of Play-to-earn (P2E) models
- 3.7.1.4 Enhanced security and transparency
- 3.7.1.5 Increasing investment and funding
- 3.7.2 Industry pitfalls and challenges
- 3.7.2.1 Technical complexity
- 3.7.2.2 Volatility of cryptocurrencies and NFTs
- 3.7.1 Growth drivers
- 3.8 Growth potential analysis
- 3.9 Porter's analysis
- 3.9.1 Supplier power
- 3.9.2 Buyer power
- 3.9.3 Threat of new entrants
- 3.9.4 Threat of substitutes
- 3.9.5 Industry rivalry
- 3.10 PESTEL analysis
Chapter 4 Competitive Landscape, 2023
- 4.1 Company market share analysis
- 4.2 Competitive positioning matrix
- 4.3 Strategic outlook matrix
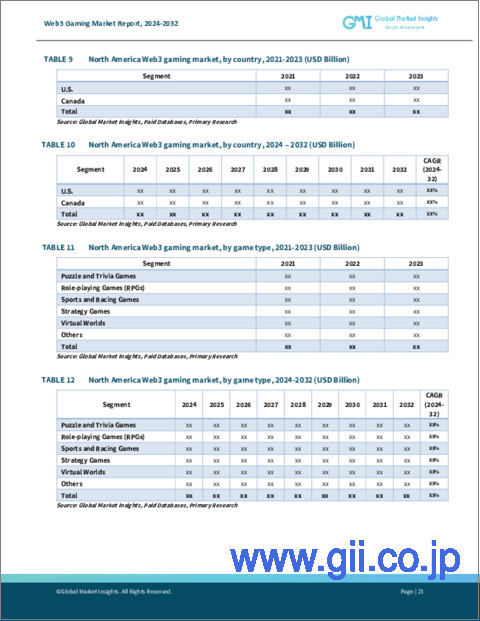
Chapter 5 Market Estimates and Forecast, By Game Type, 2021 - 2032 (USD Million)
- 5.1 Key trends
- 5.2 Puzzle and trivia games
- 5.3 Role-playing games (RPGs)
- 5.4 Sports and racing games
- 5.5 Strategy games
- 5.6 Virtual worlds
- 5.7 Others
Chapter 6 Market Estimates and Forecast, By Device Type, 2021 - 2032 (USD Million)
- 6.1 Key trends
- 6.2 PC/desktop
- 6.3 Mobile
- 6.4 Consoles
- 6.5 VR/AR
Chapter 7 Market Estimates and Forecast, By In-Game Purchase, 2021 - 2032 (USD Million)
- 7.1 Key trends
- 7.2 USD
- 7.3 Ehtereum
- 7.4 USDC
- 7.5 Others
Chapter 8 Market Estimates and Forecast, By Mode, 2021 - 2032 (USD Million)
- 8.1 Key trends
- 8.2 Play-to-earn (P2E)
- 8.3 Free-to-play (F2P)
- 8.4 Subscription-based
- 8.5 Hybrid models
Chapter 9 Market Estimates and Forecast, By End User, 2021 - 2032 (USD Million)
- 9.1 Key trends
- 9.2 Casual gamers
- 9.3 Hardcore gamers
- 9.4 Investors/speculators
- 9.5 Collectors
- 9.6 Community builders
Chapter 10 Market Estimates and Forecast, By Region, 2021 - 2032 (USD Million)
- 10.1 Key trends
- 10.2 North America
- 10.2.1 U.S.
- 10.2.2 Canada
- 10.3 Europe
- 10.3.1 UK
- 10.3.2 Germany
- 10.3.3 France
- 10.3.4 Italy
- 10.3.5 Spain
- 10.3.6 Rest of Europe
- 10.4 Asia Pacific
- 10.4.1 China
- 10.4.2 India
- 10.4.3 Japan
- 10.4.4 South Korea
- 10.4.5 ANZ
- 10.4.6 Rest of Asia Pacific
- 10.5 Latin America
- 10.5.1 Brazil
- 10.5.2 Mexico
- 10.5.3 Rest of Latin America
- 10.6 MEA
- 10.6.1 UAE
- 10.6.2 Saudi Arabia
- 10.6.3 South Africa
- 10.6.4 Rest of MEA
Chapter 11 Company Profiles
- 11.1 Axie Infinity (Sky Mavis Pte. Ltd.)
- 11.2 Aavegotchi (Pixelcraft Studios Ltd.)
- 11.3 Alien Worlds
- 11.4 Animoca Brands Corporation Limited
- 11.5 Aurory Project Inc.
- 11.6 Dapper Labs Inc.
- 11.7 Decentraland Foundation
- 11.8 Enjin Pte. Ltd.
- 11.9 Forte Labs, Inc.
- 11.10 Gala Games, Inc.
- 11.11 Gods Unchained
- 11.12 Illuvium Labs Ltd.
- 11.13 Immutable Pty Ltd
- 11.14 MOBOX Ltd.
- 11.15 Mythical, Inc.
- 11.16 OpenSea (Ozone Networks, Inc.)
- 11.17 Sky Mavis Pte. Ltd.
- 11.18 Sorare SAS
- 11.19 Splinterlands Inc.
- 11.20 Star Atlas (Automata Pte. Ltd.)
- 11.21 SuperRare Labs, Inc.
- 11.22 The Sandbox, a subsidiary of Animoca Brands
- 11.23 Ubisoft Entertainment S.A.
- 11.24 Vulcan Forged Ltd.
- 11.25 Yield Guild Games Ltd.

