
|
市場調査レポート
商品コード
1667096
低強度甘味料市場の機会、成長促進要因、産業動向分析、2025年~2034年の予測Low Intensity Sweeteners Market Opportunity, Growth Drivers, Industry Trend Analysis, and Forecast 2025 - 2034 |
||||||
カスタマイズ可能
|
|||||||
| 低強度甘味料市場の機会、成長促進要因、産業動向分析、2025年~2034年の予測 |
|
出版日: 2024年12月30日
発行: Global Market Insights Inc.
ページ情報: 英文 310 Pages
納期: 2~3営業日
|

全表示
- 概要
- 目次
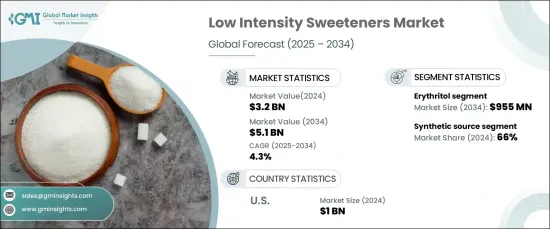
低強度甘味料の世界市場は、2024年に32億米ドルの評価額を達成し、2025年から2034年にかけてCAGR 4.3%で成長する見通しです。
この着実な成長は、砂糖の過剰摂取による悪影響、特に糖尿病や肥満のような健康状態の有病率の上昇に対する消費者の意識の高まりを反映しています。飲食品業界では、進化する健康動向と砂糖削減を推進する政府のイニシアティブに後押しされ、砂糖削減製品およびカロリー重視製品に対する旺盛な需要が見られます。さらに、クリーンラベルや植物由来の甘味料への嗜好の高まりが技術革新を促進し、市場拡大の大きな可能性をもたらしています。
メーカー各社は、味覚プロファイル、拡張性、全体的な製品品質の改善に注力することで、消費者の需要に応えています。製造プロセスの進歩や、糖尿病患者向け製品や体重管理製品など、食事に関する要求に応える新規甘味料の導入が、市場の成長をさらに後押ししています。しかし、市場は規制上の制約や新興地域における認知度の低さなどの課題に直面しています。こうしたハードルにもかかわらず、持続可能で健康志向の代替品への志向が高まっていることから、市場は今後10年間で力強い成長を遂げるものと思われます。
| 市場範囲 | |
|---|---|
| 開始年 | 2024 |
| 予測年 | 2025-2034 |
| 開始金額 | 32億米ドル |
| 予測金額 | 51億米ドル |
| CAGR | 4.3% |
市場は製品タイプ別にエリスリトール、マルチトール、キシリトール、d-タガトース、ソルビトール、マンニトール、アルロース、その他に区分されます。このうち、エリスリトールは支配的なセグメントとして際立っており、2024年には6億600万米ドルを記録し、2034年には9億5,500万米ドルに達すると予測されています。エリスリトールの広範な魅力は、天然由来であること、血糖値に影響を与えずに砂糖の味を再現できること、消化に優しい性質に由来します。健康志向の消費者の間でその採用が増加していることは、市場の軌道を形成する上でエリスリトールが果たす役割を裏付けています。
供給源別に見ると、市場は天然と合成のセグメントに分類されます。合成低強度甘味料は、そのコスト効率と大規模生産における一貫性により、2024年の市場シェアの66%を占めました。加工食品や飲食品に広く使用されているのは、現代の食生活の嗜好に合ったカロリー重視の製剤に対する需要の高まりと一致しています。
米国は世界市場の主要貢献国として浮上し、2024年には10億米ドルを創出します。高カロリー甘味料に関連する健康リスクに対する意識の高まりにより、米国の消費者は健康を損なうことなく甘味を提供する代替品を積極的に求めるようになりました。このシフトは、同地域で肥満と糖尿病の罹患率が上昇していることを考えると、特に関連性が高いです。
消費者の需要が健康を重視した革新的な解決策と一致し続ける中、低強度甘味料市場は長期的な成長と多様化に向けて好位置にあります。
目次
第1章 調査手法と調査範囲
- 市場範囲と定義
- 基本推定と計算
- 予測計算
- データソース
- 1次データ
- 2次データ
- 有料情報源
- 公的情報源
第2章 エグゼクティブサマリー
第3章 業界洞察
- エコシステム分析
- バリューチェーンに影響を与える要因
- 利益率分析
- 破壊
- 将来の展望
- メーカー
- 流通業者
- サプライヤーの状況
- 利益率分析
- 主要ニュースと取り組み
- 規制状況
- 影響要因
- 促進要因
- より健康的な代替食品に対する消費者の需要の増加
- 砂糖削減を推進する政府規制
- 低グリセミック指数甘味料に対する意識の高まり
- 業界の潜在的リスク&課題
- 後味に関する潜在的問題
- 食品における甘味料の安全性と使用に関する絶え間ない監視と進化する規制
- 促進要因
- 成長可能性分析
- ポーターの分析
- PESTEL分析
第4章 競合情勢
- イントロダクション
- 企業シェア分析
- 競合のポジショニング・マトリックス
- 戦略展望マトリックス
第5章 市場規模・予測:製品タイプ別、2021年~2034年
- 主要動向
- エリスリトール
- マルチトール
- キシリトール
- DTタガトース
- ソルビトール
- マンニトール
- アリュロース
- その他
第6章 市場規模・予測:供給源別、2021年~2034年
- 主要動向
- 天然
- 合成
第7章 市場規模・予測:用途別、2021年~2034年
- 主要動向
- 飲食品
- 医薬品
- パーソナルケア
- その他
第8章 市場規模・予測:地域別、2021年~2034年
- 主要動向
- 北米
- 米国
- カナダ
- 欧州
- 英国
- ドイツ
- フランス
- イタリア
- スペイン
- ロシア
- アジア太平洋
- 中国
- インド
- 日本
- 韓国
- オーストラリア
- ラテンアメリカ
- ブラジル
- メキシコ
- 中東・アフリカ
- 南アフリカ
- サウジアラビア
- アラブ首長国連邦
第9章 企業プロファイル
- Archer Daniels Midland
- Cargill
- GLG Life Tech
- Hill Pharmaceutical
- Ingredion
- Madhava Natural Sweeteners
- Merisant
- Monk Fruit
- PureCircle
- Roquette Frères
- S&W Seed Company
- Stevia
- Sunwin Stevia
The Global Low Intensity Sweeteners Market achieved a valuation of USD 3.2 billion in 2024 and is poised to grow at a CAGR of 4.3% from 2025 to 2034. This steady growth reflects increasing consumer awareness about the adverse effects of excessive sugar consumption, particularly the rising prevalence of health conditions like diabetes and obesity. The food and beverage industry is witnessing a robust demand for sugar-reduced and calorie-conscious products, fueled by evolving health trends and government-backed initiatives promoting sugar reduction. Additionally, the increasing preference for clean-label and plant-based sweeteners is driving innovation, offering significant potential for market expansion.
Manufacturers are responding to consumer demand by focusing on improving taste profiles, scalability, and overall product quality. Advances in production processes and the introduction of novel sweeteners that cater to dietary requirements, such as those in diabetic-friendly and weight-management products, are further propelling market growth. However, the market faces challenges, including regulatory constraints and limited awareness in emerging regions. Despite these hurdles, the growing inclination toward sustainable and health-oriented alternatives positions the market for strong growth over the next decade.
| Market Scope | |
|---|---|
| Start Year | 2024 |
| Forecast Year | 2025-2034 |
| Start Value | $3.2 Billion |
| Forecast Value | $5.1 Billion |
| CAGR | 4.3% |
The market is segmented by product type into erythritol, maltitol, xylitol, d-tagatose, sorbitol, mannitol, allulose, and others. Among these, erythritol stood out as a dominant segment, recording USD 606 million in 2024, with projections to reach USD 955 million by 2034. Erythritol's widespread appeal stems from its natural origin, ability to replicate sugar's taste without influencing blood sugar levels, and digestive-friendly properties. Its increasing adoption among health-conscious consumers underscores its role in shaping the market's trajectory.
By source, the market is categorized into natural and synthetic segments. Synthetic low-intensity sweeteners accounted for 66% of the market share in 2024, driven by their cost efficiency and consistency in large-scale production. Their extensive use in processed foods and beverages aligns with the growing demand for calorie-conscious formulations that meet modern dietary preferences.
The United States emerged as a key contributor to the global market, generating USD 1 billion in 2024. The growing awareness of the health risks linked to high-calorie sweeteners has led American consumers to actively seek alternatives that provide sweetness without compromising health. This shift is particularly relevant given the rising incidence of obesity and diabetes in the region.
As consumer demand continues to align with health-forward and innovative solutions, the low-intensity sweeteners market is well-positioned for long-term growth and diversification.
Table of Contents
Chapter 1 Methodology & Scope
- 1.1 Market scope & definition
- 1.2 Base estimates & calculations
- 1.3 Forecast calculation
- 1.4 Data sources
- 1.4.1 Primary
- 1.4.2 Secondary
- 1.4.2.1 Paid sources
- 1.4.2.2 Public sources
Chapter 2 Executive Summary
- 2.1 Industry synopsis, 2021-2034
Chapter 3 Industry Insights
- 3.1 Industry ecosystem analysis
- 3.1.1 Factor affecting the value chain
- 3.1.2 Profit margin analysis
- 3.1.3 Disruptions
- 3.1.4 Future outlook
- 3.1.5 Manufacturers
- 3.1.6 Distributors
- 3.2 Supplier landscape
- 3.3 Profit margin analysis
- 3.4 Key news & initiatives
- 3.5 Regulatory landscape
- 3.6 Impact forces
- 3.6.1 Growth drivers
- 3.6.1.1 Increasing consumer demand for healthier alternatives
- 3.6.1.2 Government regulations promoting sugar reduction
- 3.6.1.3 Rising awareness of low-glycemic index sweeteners
- 3.6.2 Industry pitfalls & challenges
- 3.6.2.1 Potential issues related to aftertaste
- 3.6.2.2 Constant scrutiny and evolving regulations regarding the safety and use of sweeteners in food
- 3.6.1 Growth drivers
- 3.7 Growth potential analysis
- 3.8 Porter’s analysis
- 3.9 PESTEL analysis
Chapter 4 Competitive Landscape, 2024
- 4.1 Introduction
- 4.2 Company market share analysis
- 4.3 Competitive positioning matrix
- 4.4 Strategic outlook matrix
Chapter 5 Market Size and Forecast, By Product Type, 2021-2034 (USD Billion) (Kilo Tons)
- 5.1 Key trends
- 5.2 Erythritol
- 5.3 Maltitol
- 5.4 Xylitol
- 5.5 DTagatose
- 5.6 Sorbitol
- 5.7 Mannitol
- 5.8 Allulose
- 5.9 Others
Chapter 6 Market Size and Forecast, By Source, 2021-2034 (USD Billion) (Kilo Tons)
- 6.1 Key trends
- 6.2 Natural
- 6.3 Synthetic
Chapter 7 Market Size and Forecast, By Application, 2021-2034 (USD Billion) (Kilo Tons)
- 7.1 Key trends
- 7.2 Food & beverages
- 7.3 Pharmaceuticals
- 7.4 Personal care
- 7.5 Others
Chapter 8 Market Size and Forecast, By Region, 2021-2034 (USD Billion) (Kilo Tons)
- 8.1 Key trends
- 8.2 North America
- 8.2.1 U.S.
- 8.2.2 Canada
- 8.3 Europe
- 8.3.1 UK
- 8.3.2 Germany
- 8.3.3 France
- 8.3.4 Italy
- 8.3.5 Spain
- 8.3.6 Russia
- 8.4 Asia Pacific
- 8.4.1 China
- 8.4.2 India
- 8.4.3 Japan
- 8.4.4 South Korea
- 8.4.5 Australia
- 8.5 Latin America
- 8.5.1 Brazil
- 8.5.2 Mexico
- 8.6 MEA
- 8.6.1 South Africa
- 8.6.2 Saudi Arabia
- 8.6.3 UAE
Chapter 9 Company Profiles
- 9.1 Archer Daniels Midland
- 9.2 Cargill
- 9.3 GLG Life Tech
- 9.4 Hill Pharmaceutical
- 9.5 Ingredion
- 9.6 Madhava Natural Sweeteners
- 9.7 Merisant
- 9.8 Monk Fruit
- 9.9 PureCircle
- 9.10 Roquette Frères
- 9.11 S&W Seed Company
- 9.12 Stevia
- 9.13 Sunwin Stevia

