|
|
市場調査レポート
商品コード
1616688
パン粉市場の機会と促進要因、業界動向分析、2024年~2032年予測Breadcrumbs Market Opportunity, Growth Drivers, Industry Trend Analysis, and Forecast 2024 - 2032 |
||||||

|
|||||||
カスタマイズ可能
|
|||||||

| パン粉市場の機会と促進要因、業界動向分析、2024年~2032年予測 |
|
出版日: 2024年09月04日
発行: Global Market Insights Inc.
ページ情報: 英文 200 Pages
納期: 2~3営業日
|

全表示
- 概要
- 目次
パン粉の世界市場は2023年に9億850万米ドルと評価され、2024~2032年にかけてCAGR 5.1%で成長すると予測されています。
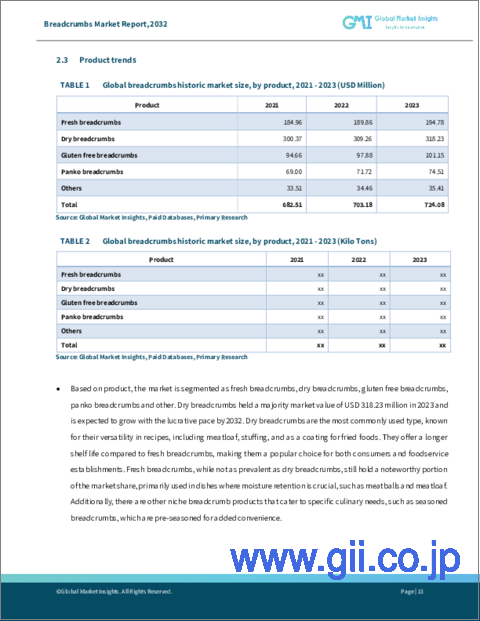
この成長軌道は、いくつかの要因、特にコンビニエンスフードの人気の急上昇と、レディトゥイートミールへの食欲の増加によってもたらされます。製造、包装、製品イノベーションにおける技術の進歩は、この産業で極めて重要な役割を果たしています。こうした技術革新は、製品の品質や業務効率を高めるだけでなく、消費者の絶えず進化する需要にも対応しています。パン粉製造の主要技術には、押出、焼成、乾燥があります。
押出成形は、様々な形態のダイにパン生地を押し込むことで、均一な食感とサイズを実現します。先進的押出技術により、密度と食感を正確に制御することができ、安定した品質を維持するために極めて重要です。一方、改良された温度制御と自動化システムを備えた最新のベーカリー技術は、均一な熱分布を保証し、生産速度を加速させ、大規模な市場の需要に対応します。産業全体は、製品、調味料、最終用途、流通チャネル、地域に分けられます。
7.2%の高成長が予測されるグルテンフリーのパン粉は、2032年までに約4億8,166万米ドルに達します。この急増は、グルテン不耐症やセリアック病の患者数の増加と、グルテンフリー食を取り巻く消費者の意識の高まりが主要原因です。グルテンフリー製品に対する需要は、包括性と健康を強調する、個別化された栄養と食事の嗜好という包括的な動向によってさらに増幅されています。こうした動きは、グルテンフリー製品のニッチな用途を際立たせるだけでなく、新鮮でグルテンフリーの選択肢を好む幅広い消費者動向とも共鳴しています。パン粉市場の無香料セグメントはCAGR 5.2%の顕著な伸びを示し、2032年までに9億1,300万米ドルの評価額を目指すと予測されています。この価値の上昇は、食品の品質と持続可能性を重視する消費者の増加を反映した、プレミアム製品の提供と高めの価格設定に起因しています。
| 市場範囲 | |
|---|---|
| 開始年 | 2023年 |
| 予測年 | 2024~2032年 |
| 開始価格 | 9億850万米ドル |
| 予想価格 | 14億1,000万米ドル |
| CAGR | 5.1% |
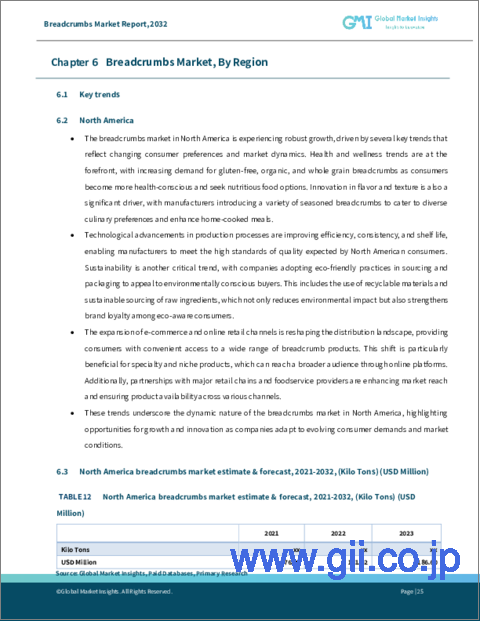
北米のパン粉市場は2,360億米ドルで、2024~2032年にかけてCAGR 4.3%で成長すると予測されます。この成長軌道は、多忙なライフスタイルと手軽な食事ソリューションへの嗜好に起因する傾向である、コンビニエンスフードへの需要の増加が主要要因です。調理済み食品や加工食品への嗜好が強い米国では、多様なパン粉への欲求が顕著です。消費者がより健康的な食事にシフトするにつれ、全粒粉やグルテンフリーのパン粉を好む傾向が顕著になっています。
目次
第1章 調査手法と調査範囲
第2章 エグゼクティブサマリー
第3章 産業洞察
- エコシステム分析
- バリューチェーン
- 主要メーカー
- 市場参入ルート
- 主要流通業者
- 新規流通チャネル
- 産業全体の利益率
- 産業への影響要因
- 促進要因
- 市場課題
- 市場機会
- 新市場/用途
- 成長可能性分析
- 原料情勢
- 製造動向
- 技術の進化
- サステイナブル製造
- グリーンプラクティス
- 脱炭素化
- 新原料
- 価格動向(米ドル/トン)
- 製造動向
- 規制と市場への影響
- ポーター分析
- PESTEL分析
第4章 競合情勢
- 企業シェア分析
- 競合のポジショニングマトリックス
- 戦略展望マトリックス
第5章 市場規模・予測:製品別、2021~2032年
- 主要動向
- 生パン粉末
- ドライパン粉末
- グルテンフリーパン粉末
- パン粉末
- その他
第6章 市場規模・予測:調味料別、2021~2032年
- 主要動向
- フレーバーなし
- フレーバー
第7章 市場規模・予測:最終用途別、2021~2032年
- 主要動向
- コーティング&パン粉末
- 詰め物
- ベーキング
- スナック&前菜
- その他
第8章 市場規模・予測:流通チャネル別、2021~2032年
- 主要動向
- 小売店舗
- オンライン小売
- フードサービス
- その他
第9章 市場規模・予測:地域別、2021~2032年
- 主要動向
- 北米
- 米国
- カナダ
- 欧州
- ドイツ
- 英国
- フランス
- スペイン
- イタリア
- ロシア
- その他の欧州
- アジア太平洋
- 中国
- 日本
- インド
- オーストラリア
- 韓国
- インドネシア
- マレーシア
- タイ
- フィリピン
- ベトナム
- その他のアジア太平洋
- ラテンアメリカ
- ブラジル
- メキシコ
- アルゼンチン
- その他のラテンアメリカ
- 中東・アフリカ
- 南アフリカ
- サウジアラビア
- アラブ首長国連邦
- エジプト
- その他の中東・アフリカ
第10章 企業プロファイル
- Kikkoman Corporation
- Kerry Global
- George DeLallo Company
- 4C Foods Corp.
- General Mills Inc
- Gillian's Foods Inc.
- Aleia's Gluten Free Foods
- Newly Weds Foods
- FRUMEN
- Bon Food Industries Sdn Bhd
- Ripon Select Foods Limited
- LEIMER KG
- Texas Crumb and Food Products
- Grupo Bimbo
- Upper Crust Enterprises
The Global Breadcrumbs Market was valued at USD 908.5 million in 2023 and is projected to grow at a CAGR of 5.1% from 2024 to 2032. This upward trajectory is driven by several factors, notably the surging popularity of convenience foods and an increasing appetite for ready-to-eat meals. Technological advancements in manufacturing, packaging, and product innovation play a pivotal role in the industry. These innovations not only enhance product quality and operational efficiency but also cater to the ever-evolving demands of consumers. Key technologies in breadcrumb production include extrusion, baking, and drying.
Extrusion, by pushing dough through dies of varying shapes, ensures a uniform texture and size. Advanced extrusion techniques allow for precise control over density and texture, crucial for maintaining consistent quality. Meanwhile, modern baking technologies, equipped with improved temperature controls and automated systems, guarantee uniform heat distribution and accelerate production speed, aligning with large-scale market demands. The overall industry is divided into product, seasoning, end-use application, distribution channel, and region.
Forecasted to grow at the highest rate of 7.2%, gluten-free breadcrumbs are set to reach approximately USD 481.66 million by 2032. This surge is largely attributed to the rising instances of gluten intolerance and celiac disease, coupled with heightened consumer awareness surrounding gluten-free diets. The demand for gluten-free products is further amplified by the overarching trend of personalized nutrition and dietary preferences, underscoring inclusivity and health. Such dynamics not only highlight the niche applications of gluten-free products but also resonate with broader consumer trends favoring fresh and gluten-free options. The unflavored segment of the breadcrumbs market is projected to witness a notable CAGR of 5.2%, aiming for a valuation of nearly USD 913 million by 2032. This uptick in value can be attributed to premium product offerings and elevated pricing, mirroring the growing consumer emphasis on quality and sustainability in food.
| Market Scope | |
|---|---|
| Start Year | 2023 |
| Forecast Year | 2024-2032 |
| Start Value | $908.5 Million |
| Forecast Value | $1.41 Billion |
| CAGR | 5.1% |
North America breadcrumbs market, valued at USD 236 billion, is projected to grow at a CAGR of 4.3% from 2024 to 2032. This growth trajectory is largely driven by an increasing demand for convenience foods, a trend stemming from busy lifestyles and a penchant for quick meal solutions. In the U.S., where there is a strong preference for ready-to-eat and processed foods, the appetite for a diverse range of breadcrumbs is pronounced. As the consumer landscape shifts towards healthier eating, there is a marked increase in the preference for whole grain and gluten-free breadcrumbs.
Table of Contents
Chapter 1 Methodology & Scope
- 1.1 Market scope & definition
- 1.2 Base estimates & calculations
- 1.3 Forecast calculation
- 1.4 Data sources
- 1.4.1 Primary
- 1.4.2 Secondary
- 1.4.2.1 Paid sources
- 1.4.2.2 Public sources
Chapter 2 Executive Summary
- 2.1 Industry 360° synopsis
Chapter 3 Industry Insights
- 3.1 Industry ecosystem analysis
- 3.1.1 Value chain
- 3.1.2 Key manufacturers
- 3.1.3 Go to market routes
- 3.1.4 Key distributors
- 3.1.4.1 New distribution channels
- 3.1.5 Profit margins across the industry
- 3.2 Industry impact forces
- 3.2.1 Growth drivers
- 3.2.2 Market challenges
- 3.2.3 Market opportunities
- 3.2.3.1 New markets/applications
- 3.2.3.2 Growth potential analysis
- 3.3 Raw material landscape
- 3.3.1 Manufacturing trends
- 3.3.1.1 Technology evolution
- 3.3.1.2 Sustainable manufacturing
- 3.3.1.2.1 Green practices
- 3.3.1.2.2 Decarbonization
- 3.3.2 New raw materials
- 3.3.3 Pricing trends (USD/Ton)
- 3.3.3.1 North America
- 3.3.3.2 Europe
- 3.3.3.3 Asia Pacific
- 3.3.3.4 Latin America
- 3.3.3.5 Middle East & Africa
- 3.3.1 Manufacturing trends
- 3.4 Regulations & market impact
- 3.5 Porter's analysis
- 3.6 PESTEL analysis
Chapter 4 Competitive Landscape, 2023
- 4.1 Company market share analysis
- 4.2 Competitive positioning matrix
- 4.3 Strategic outlook matrix
Chapter 5 Market Size and Forecast, By Product, 2021-2032 (USD Million, Kilo Tons)
- 5.1 Key trends
- 5.2 Fresh breadcrumbs
- 5.3 Dry breadcrumbs
- 5.4 Gluten free breadcrumbs
- 5.5 Panko breadcrumbs
- 5.6 Other
Chapter 6 Market Size and Forecast, By Seasoning, 2021-2032 (USD Million, Kilo Tons)
- 6.1 Key trends
- 6.2 Unflavored
- 6.3 Flavored
Chapter 7 Market Size and Forecast, By End Use Application, 2021-2032 (USD Million, Kilo Tons)
- 7.1 Key trends
- 7.2 Coating & breading
- 7.3 Stuffing
- 7.4 Baking
- 7.5 Snacks & appetizer
- 7.6 Other
Chapter 8 Market Size and Forecast, By Distribution Channel, 2021-2032 (USD Million, Kilo Tons)
- 8.1 Key trends
- 8.2 Retail stores
- 8.3 Online retail
- 8.4 Food service
- 8.5 Others
Chapter 9 Market Size and Forecast, By Region, 2021-2032 (USD Billion, Kilo Tons)
- 9.1 Key trends
- 9.2 North America
- 9.2.1 U.S.
- 9.2.2 Canada
- 9.3 Europe
- 9.3.1 Germany
- 9.3.2 UK
- 9.3.3 France
- 9.3.4 Spain
- 9.3.5 Italy
- 9.3.6 Russia
- 9.3.7 Rest of Europe
- 9.4 Asia Pacific
- 9.4.1 China
- 9.4.2 Japan
- 9.4.3 India
- 9.4.4 Australia
- 9.4.5 South Korea
- 9.4.6 Indonesia
- 9.4.7 Malaysia
- 9.4.8 Thailand
- 9.4.9 Philippines
- 9.4.10 Vietnam
- 9.4.11 Rest of Asia Pacific
- 9.5 Latin America
- 9.5.1 Brazil
- 9.5.2 Mexico
- 9.5.3 Argentina
- 9.5.4 Rest of LATAM
- 9.6 MEA
- 9.6.1 South Africa
- 9.6.2 Saudi Arabia
- 9.6.3 UAE
- 9.6.4 Egypt
- 9.6.5 Rest of MEA
Chapter 10 Company Profiles
- 10.1 Kikkoman Corporation
- 10.2 Kerry Global
- 10.3 George DeLallo Company
- 10.4 4C Foods Corp.
- 10.5 General Mills Inc
- 10.6 Gillian's Foods Inc.
- 10.7 Aleia's Gluten Free Foods
- 10.8 Newly Weds Foods
- 10.9 FRUMEN
- 10.10 Bon Food Industries Sdn Bhd
- 10.11 Ripon Select Foods Limited
- 10.12 LEIMER KG
- 10.13 Texas Crumb and Food Products
- 10.14 Grupo Bimbo
- 10.15 Upper Crust Enterprises

