|
|
市場調査レポート
商品コード
1491419
アレルギー免疫療法の世界市場 2024-2028Global allergy immunotherapies market 2024-2028 |
||||||

|
|||||||
カスタマイズ可能
|
|||||||

| アレルギー免疫療法の世界市場 2024-2028 |
|
出版日: 2024年05月17日
発行: TechNavio
ページ情報: 英文 167 Pages
納期: 即納可能
|

全表示
- 概要
- 図表
- 目次
アレルギー免疫療法市場は2023-2028年に11億8,900万米ドル、予測期間中のCAGRは9.62%で成長すると予測されます。
当レポートでは、アレルギー免疫療法市場の全体的な分析、市場規模・予測、動向、成長促進要因、課題、約25のベンダーを網羅したベンダー分析などを掲載しています。
現在の市場シナリオ、最新動向と促進要因、市場環境全体に関する最新分析を提供しています。市場は、アレルギーの有病率の増加、最近の承認と強力なパイプライン、市場統合の進展によって牽引されています。
| 市場範囲 | |
|---|---|
| 基準年 | 2024 |
| 終了年 | 2028 |
| 予測期間 | 2024-2028 |
| 成長モメンタム | 加速 |
| 前年比2024年 | 8.55% |
| CAGR | 9.62% |
| 増分額 | 11億8,900万米ドル |
本調査では、今後数年間のアレルギー免疫療法市場成長を牽引する主要因の1つとして、アレルギー診断の技術進歩を挙げています。また、新たな医薬品開発技術やスリットの人気の高まりは、市場の大きな需要につながります。
目次
第1章 エグゼクティブサマリー
- 市場概要
第2章 市場情勢
- 市場エコシステム
- 市場の特徴
- バリューチェーン分析
第3章 市場規模の評価
- 市場の定義
- 市場セグメント分析
- 市場規模 2023
- 市場の見通し 2023-2028
第4章 市場規模実績
- 世界のアレルギー免疫療法市場 2018-2022
- 製品別セグメント分析 2018-2022
- タイプ別セグメント分析 2018-2022
- 地域別セグメント分析 2018-2022
- 国別セグメント分析 2018-2022
第5章 ファイブフォース分析
- ファイブフォースの要約
- 買い手の交渉力
- 供給企業の交渉力
- 新規参入業者の脅威
- 代替品の脅威
- 競争の脅威
- 市況
第6章 市場セグメンテーション:製品別
- 市場セグメンテーション
- 比較:製品別
- SCIT:市場規模と予測 2023-2028
- SLIT:市場規模と予測 2023-2028
- 市場機会:製品別
第7章 市場セグメンテーション:タイプ別
- 市場セグメンテーション
- 比較:タイプ別
- アレルギー性鼻炎:市場規模と予測 2023-2028
- 喘息:市場規模と予測 2023-2028
- 食物アレルギー:市場規模と予測 2023-2028
- その他:市場規模と予測 2023-2028
- 市場機会:タイプ別
第8章 顧客情勢
- 顧客情勢の概要
第9章 地域別情勢
- 地域別セグメンテーション
- 地域別比較
- 欧州:市場規模と予測 2023-2028
- 北米:市場規模と予測 2023-2028
- アジア:市場規模と予測 2023-2028
- 世界のその他の地域:市場規模と予測 2023-2028
- ドイツ:市場規模と予測 2023-2028
- フランス:市場規模と予測 2023-2028
- 英国:市場規模と予測 2023-2028
- 米国:市場規模と予測 2023-2028
- 日本:市場規模と予測 2023-2028
- 市場機会:地域情勢別
第10章 促進要因・課題・機会・抑制要因
- 市場促進要因
- 市場の課題
- 促進要因と課題の影響
- 市場の機会・抑制要因
第11章 競合情勢
- 概要
- 競合情勢
- 混乱の状況
- 業界のリスク
第12章 競合分析
- 企業プロファイル
- 企業の市場ポジショニング
- Adamis Pharmaceuticals Corp.
- Aimmune Therapeutics Inc.
- ALK Abello AS
- Allergy Therapeutics PLC
- DBV Technologies SA
- Desentum Oy
- HAL Allergy BV
- Immunomic Therapeutics Inc.
- Jubilant Pharmova Ltd.
- LETI Pharma SLU
- LOFARMA Spa
- Merck KGaA
- Novartis AG
- Stallergenes Greer Ltd.
- Viatris Inc.
第13章 付録
Exhibits:
- Exhibits1: Executive Summary - Chart on Market Overview
- Exhibits2: Executive Summary - Data Table on Market Overview
- Exhibits3: Executive Summary - Chart on Global Market Characteristics
- Exhibits4: Executive Summary - Chart on Market By Geographical Landscape
- Exhibits5: Executive Summary - Chart on Market Segmentation by Product
- Exhibits6: Executive Summary - Chart on Market Segmentation by Type
- Exhibits7: Executive Summary - Chart on Incremental Growth
- Exhibits8: Executive Summary - Data Table on Incremental Growth
- Exhibits9: Executive Summary - Chart on Company Market Positioning
- Exhibits10: Parent Market
- Exhibits11: Data Table on - Parent Market
- Exhibits12: Market characteristics analysis
- Exhibits13: Value Chain Analysis
- Exhibits14: Offerings of companies included in the market definition
- Exhibits15: Market segments
- Exhibits16: Chart on Global - Market size and forecast 2023-2028 ($ million)
- Exhibits17: Data Table on Global - Market size and forecast 2023-2028 ($ million)
- Exhibits18: Chart on Global Market: Year-over-year growth 2023-2028 (%)
- Exhibits19: Data Table on Global Market: Year-over-year growth 2023-2028 (%)
- Exhibits20: Historic Market Size - Data Table on Global Allergy Immunotherapies Market 2018 - 2022 ($ million)
- Exhibits21: Historic Market Size - Product Segment 2018 - 2022 ($ million)
- Exhibits22: Historic Market Size - Type Segment 2018 - 2022 ($ million)
- Exhibits23: Historic Market Size - Geography Segment 2018 - 2022 ($ million)
- Exhibits24: Historic Market Size - Country Segment 2018 - 2022 ($ million)
- Exhibits25: Five forces analysis - Comparison between 2023 and 2028
- Exhibits26: Bargaining power of buyers - Impact of key factors 2023 and 2028
- Exhibits27: Bargaining power of suppliers - Impact of key factors in 2023 and 2028
- Exhibits28: Threat of new entrants - Impact of key factors in 2023 and 2028
- Exhibits29: Threat of substitutes - Impact of key factors in 2023 and 2028
- Exhibits30: Threat of rivalry - Impact of key factors in 2023 and 2028
- Exhibits31: Chart on Market condition - Five forces 2023 and 2028
- Exhibits32: Chart on Product - Market share 2023-2028 (%)
- Exhibits33: Data Table on Product - Market share 2023-2028 (%)
- Exhibits34: Chart on Comparison by Product
- Exhibits35: Data Table on Comparison by Product
- Exhibits36: Chart on SCIT - Market size and forecast 2023-2028 ($ million)
- Exhibits37: Data Table on SCIT - Market size and forecast 2023-2028 ($ million)
- Exhibits38: Chart on SCIT - Year-over-year growth 2023-2028 (%)
- Exhibits39: Data Table on SCIT - Year-over-year growth 2023-2028 (%)
- Exhibits40: Chart on SLIT - Market size and forecast 2023-2028 ($ million)
- Exhibits41: Data Table on SLIT - Market size and forecast 2023-2028 ($ million)
- Exhibits42: Chart on SLIT - Year-over-year growth 2023-2028 (%)
- Exhibits43: Data Table on SLIT - Year-over-year growth 2023-2028 (%)
- Exhibits44: Market opportunity by Product ($ million)
- Exhibits45: Data Table on Market opportunity by Product ($ million)
- Exhibits46: Chart on Type - Market share 2023-2028 (%)
- Exhibits47: Data Table on Type - Market share 2023-2028 (%)
- Exhibits48: Chart on Comparison by Type
- Exhibits49: Data Table on Comparison by Type
- Exhibits50: Chart on Allergic Rhinitis - Market size and forecast 2023-2028 ($ million)
- Exhibits51: Data Table on Allergic Rhinitis - Market size and forecast 2023-2028 ($ million)
- Exhibits52: Chart on Allergic Rhinitis - Year-over-year growth 2023-2028 (%)
- Exhibits53: Data Table on Allergic Rhinitis - Year-over-year growth 2023-2028 (%)
- Exhibits54: Chart on Asthma - Market size and forecast 2023-2028 ($ million)
- Exhibits55: Data Table on Asthma - Market size and forecast 2023-2028 ($ million)
- Exhibits56: Chart on Asthma - Year-over-year growth 2023-2028 (%)
- Exhibits57: Data Table on Asthma - Year-over-year growth 2023-2028 (%)
- Exhibits58: Chart on Food Allergy - Market size and forecast 2023-2028 ($ million)
- Exhibits59: Data Table on Food Allergy - Market size and forecast 2023-2028 ($ million)
- Exhibits60: Chart on Food Allergy - Year-over-year growth 2023-2028 (%)
- Exhibits61: Data Table on Food Allergy - Year-over-year growth 2023-2028 (%)
- Exhibits62: Chart on Others - Market size and forecast 2023-2028 ($ million)
- Exhibits63: Data Table on Others - Market size and forecast 2023-2028 ($ million)
- Exhibits64: Chart on Others - Year-over-year growth 2023-2028 (%)
- Exhibits65: Data Table on Others - Year-over-year growth 2023-2028 (%)
- Exhibits66: Market opportunity by Type ($ million)
- Exhibits67: Data Table on Market opportunity by Type ($ million)
- Exhibits68: Analysis of price sensitivity, lifecycle, customer purchase basket, adoption rates, and purchase criteria
- Exhibits69: Chart on Market share By Geographical Landscape 2023-2028 (%)
- Exhibits70: Data Table on Market share By Geographical Landscape 2023-2028 (%)
- Exhibits71: Chart on Geographic comparison
- Exhibits72: Data Table on Geographic comparison
- Exhibits73: Chart on Europe - Market size and forecast 2023-2028 ($ million)
- Exhibits74: Data Table on Europe - Market size and forecast 2023-2028 ($ million)
- Exhibits75: Chart on Europe - Year-over-year growth 2023-2028 (%)
- Exhibits76: Data Table on Europe - Year-over-year growth 2023-2028 (%)
- Exhibits77: Chart on North America - Market size and forecast 2023-2028 ($ million)
- Exhibits78: Data Table on North America - Market size and forecast 2023-2028 ($ million)
- Exhibits79: Chart on North America - Year-over-year growth 2023-2028 (%)
- Exhibits80: Data Table on North America - Year-over-year growth 2023-2028 (%)
- Exhibits81: Chart on Asia - Market size and forecast 2023-2028 ($ million)
- Exhibits82: Data Table on Asia - Market size and forecast 2023-2028 ($ million)
- Exhibits83: Chart on Asia - Year-over-year growth 2023-2028 (%)
- Exhibits84: Data Table on Asia - Year-over-year growth 2023-2028 (%)
- Exhibits85: Chart on Rest of World (ROW) - Market size and forecast 2023-2028 ($ million)
- Exhibits86: Data Table on Rest of World (ROW) - Market size and forecast 2023-2028 ($ million)
- Exhibits87: Chart on Rest of World (ROW) - Year-over-year growth 2023-2028 (%)
- Exhibits88: Data Table on Rest of World (ROW) - Year-over-year growth 2023-2028 (%)
- Exhibits89: Chart on Germany - Market size and forecast 2023-2028 ($ million)
- Exhibits90: Data Table on Germany - Market size and forecast 2023-2028 ($ million)
- Exhibits91: Chart on Germany - Year-over-year growth 2023-2028 (%)
- Exhibits92: Data Table on Germany - Year-over-year growth 2023-2028 (%)
- Exhibits93: Chart on France - Market size and forecast 2023-2028 ($ million)
- Exhibits94: Data Table on France - Market size and forecast 2023-2028 ($ million)
- Exhibits95: Chart on France - Year-over-year growth 2023-2028 (%)
- Exhibits96: Data Table on France - Year-over-year growth 2023-2028 (%)
- Exhibits97: Chart on UK - Market size and forecast 2023-2028 ($ million)
- Exhibits98: Data Table on UK - Market size and forecast 2023-2028 ($ million)
- Exhibits99: Chart on UK - Year-over-year growth 2023-2028 (%)
- Exhibits100: Data Table on UK - Year-over-year growth 2023-2028 (%)
- Exhibits101: Chart on US - Market size and forecast 2023-2028 ($ million)
- Exhibits102: Data Table on US - Market size and forecast 2023-2028 ($ million)
- Exhibits103: Chart on US - Year-over-year growth 2023-2028 (%)
- Exhibits104: Data Table on US - Year-over-year growth 2023-2028 (%)
- Exhibits105: Chart on Japan - Market size and forecast 2023-2028 ($ million)
- Exhibits106: Data Table on Japan - Market size and forecast 2023-2028 ($ million)
- Exhibits107: Chart on Japan - Year-over-year growth 2023-2028 (%)
- Exhibits108: Data Table on Japan - Year-over-year growth 2023-2028 (%)
- Exhibits109: Market opportunity By Geographical Landscape ($ million)
- Exhibits110: Data Tables on Market opportunity By Geographical Landscape ($ million)
- Exhibits111: Impact of drivers and challenges in 2023 and 2028
- Exhibits112: Overview on criticality of inputs and factors of differentiation
- Exhibits113: Overview on factors of disruption
- Exhibits114: Impact of key risks on business
- Exhibits115: Companies covered
- Exhibits116: Matrix on companies position and classification
- Exhibits117: Adamis Pharmaceuticals Corp. - Overview
- Exhibits118: Adamis Pharmaceuticals Corp. - Business segments
- Exhibits119: Adamis Pharmaceuticals Corp. - Key offerings
- Exhibits120: Adamis Pharmaceuticals Corp. - Segment focus
- Exhibits121: Aimmune Therapeutics Inc. - Overview
- Exhibits122: Aimmune Therapeutics Inc. - Product / Service
- Exhibits123: Aimmune Therapeutics Inc. - Key offerings
- Exhibits124: ALK Abello AS - Overview
- Exhibits125: ALK Abello AS - Business segments
- Exhibits126: ALK Abello AS - Key offerings
- Exhibits127: ALK Abello AS - Segment focus
- Exhibits128: Allergy Therapeutics PLC - Overview
- Exhibits129: Allergy Therapeutics PLC - Product / Service
- Exhibits130: Allergy Therapeutics PLC - Key offerings
- Exhibits131: DBV Technologies SA - Overview
- Exhibits132: DBV Technologies SA - Product / Service
- Exhibits133: DBV Technologies SA - Key offerings
- Exhibits134: Desentum Oy - Overview
- Exhibits135: Desentum Oy - Product / Service
- Exhibits136: Desentum Oy - Key offerings
- Exhibits137: HAL Allergy BV - Overview
- Exhibits138: HAL Allergy BV - Key offerings
- Exhibits139: Immunomic Therapeutics Inc. - Overview
- Exhibits140: Immunomic Therapeutics Inc. - Product / Service
- Exhibits141: Immunomic Therapeutics Inc. - Key offerings
- Exhibits142: Jubilant Pharmova Ltd. - Overview
- Exhibits143: Jubilant Pharmova Ltd. - Business segments
- Exhibits144: Jubilant Pharmova Ltd. - Key offerings
- Exhibits145: Jubilant Pharmova Ltd. - Segment focus
- Exhibits146: LETI Pharma SLU - Overview
- Exhibits147: LETI Pharma SLU - Product / Service
- Exhibits148: LETI Pharma SLU - Key offerings
- Exhibits149: LOFARMA Spa - Overview
- Exhibits150: LOFARMA Spa - Product / Service
- Exhibits151: LOFARMA Spa - Key offerings
- Exhibits152: Merck KGaA - Overview
- Exhibits153: Merck KGaA - Business segments
- Exhibits154: Merck KGaA - Key news
- Exhibits155: Merck KGaA - Key offerings
- Exhibits156: Merck KGaA - Segment focus
- Exhibits157: Novartis AG - Overview
- Exhibits158: Novartis AG - Business segments
- Exhibits159: Novartis AG - Key news
- Exhibits160: Novartis AG - Key offerings
- Exhibits161: Novartis AG - Segment focus
- Exhibits162: Stallergenes Greer Ltd. - Overview
- Exhibits163: Stallergenes Greer Ltd. - Product / Service
- Exhibits164: Stallergenes Greer Ltd. - Key offerings
- Exhibits165: Viatris Inc. - Overview
- Exhibits166: Viatris Inc. - Business segments
- Exhibits167: Viatris Inc. - Key news
- Exhibits168: Viatris Inc. - Key offerings
- Exhibits169: Viatris Inc. - Segment focus
- Exhibits170: Inclusions checklist
- Exhibits171: Exclusions checklist
- Exhibits172: Currency conversion rates for US$
- Exhibits173: Research methodology
- Exhibits174: Information sources
- Exhibits175: Data validation
- Exhibits176: Validation techniques employed for market sizing
- Exhibits177: Data synthesis
- Exhibits178: 360 degree market analysis
- Exhibits179: List of abbreviations
The allergy immunotherapies market is forecasted to grow by USD 1189 mn during 2023-2028, accelerating at a CAGR of 9.62% during the forecast period. The report on the allergy immunotherapies market provides a holistic analysis, market size and forecast, trends, growth drivers, and challenges, as well as vendor analysis covering around 25 vendors.
The report offers an up-to-date analysis regarding the current market scenario, the latest trends and drivers, and the overall market environment. The market is driven by increasing prevalence of allergies, recent approvals and a strong pipeline, and growing market consolidation.
Technavio's allergy immunotherapies market is segmented as below:
| Market Scope | |
|---|---|
| Base Year | 2024 |
| End Year | 2028 |
| Series Year | 2024-2028 |
| Growth Momentum | Accelerate |
| YOY 2024 | 8.55% |
| CAGR | 9.62% |
| Incremental Value | $1189mn |
By Product
- SCIT
- SLIT
By Type
- Allergic Rhinitis
- Asthma
- Food Allergy
- Others
By Geographical Landscape
- Europe
- North America
- Asia
- Rest of World (ROW)
This study identifies the technological advances in allergy diagnostics as one of the prime reasons driving the allergy immunotherapies market growth during the next few years. Also, emerging drug development technologies and growing popularity of slit will lead to sizable demand in the market.
The report on the allergy immunotherapies market covers the following areas:
- Allergy immunotherapies market sizing
- Allergy immunotherapies market forecast
- Allergy immunotherapies market industry analysis
The robust vendor analysis is designed to help clients improve their market position, and in line with this, this report provides a detailed analysis of several leading allergy immunotherapies market vendors that include Adamis Pharmaceuticals Corp., Aimmune Therapeutics Inc., ALK Abello AS, ALLERGOPHARMA GmbH and Co. KG, Allergy Therapeutics PLC, , Biomay AG, DBV Technologies SA, Desentum Oy, HAL Allergy BV, Immunomic Therapeutics Inc., Jubilant Pharmova Ltd., LETI Pharma SLU, LOFARMA Spa, Merck KGaA, Novartis AG, Optum Inc., SHIONOGI Co. Ltd., Stallergenes Greer Ltd., Torii Pharmaceutical Co. Ltd., and Viatris Inc.. Also, the allergy immunotherapies market analysis report includes information on upcoming trends and challenges that will influence market growth. This is to help companies strategize and leverage all forthcoming growth opportunities.
The study was conducted using an objective combination of primary and secondary information including inputs from key participants in the industry. The report contains a comprehensive market and vendor landscape in addition to an analysis of the key vendors.
The publisher presents a detailed picture of the market by the way of study, synthesis, and summation of data from multiple sources by an analysis of key parameters such as profit, pricing, competition, and promotions. It presents various market facets by identifying the key industry influencers. The data presented is comprehensive, reliable, and a result of extensive research - both primary and secondary. The market research reports provide a complete competitive landscape and an in-depth vendor selection methodology and analysis using qualitative and quantitative research to forecast the accurate market growth.
Table of Contents
1 Executive Summary
- 1.1 Market overview
- Executive Summary - Chart on Market Overview
- Executive Summary - Data Table on Market Overview
- Executive Summary - Chart on Global Market Characteristics
- Executive Summary - Chart on Market By Geographical Landscape
- Executive Summary - Chart on Market Segmentation by Product
- Executive Summary - Chart on Market Segmentation by Type
- Executive Summary - Chart on Incremental Growth
- Executive Summary - Data Table on Incremental Growth
- Executive Summary - Chart on Company Market Positioning
2 Market Landscape
- 2.1 Market ecosystem
- Parent Market
- Data Table on - Parent Market
- 2.2 Market characteristics
- Market characteristics analysis
- 2.3 Value chain analysis
- Value Chain Analysis
3 Market Sizing
- 3.1 Market definition
- Offerings of companies included in the market definition
- 3.2 Market segment analysis
- Market segments
- 3.3 Market size 2023
- 3.4 Market outlook: Forecast for 2023-2028
- Chart on Global - Market size and forecast 2023-2028 ($ million)
- Data Table on Global - Market size and forecast 2023-2028 ($ million)
- Chart on Global Market: Year-over-year growth 2023-2028 (%)
- Data Table on Global Market: Year-over-year growth 2023-2028 (%)
4 Historic Market Size
- 4.1 Global Allergy Immunotherapies Market 2018 - 2022
- Historic Market Size - Data Table on Global Allergy Immunotherapies Market 2018 - 2022 ($ million)
- 4.2 Product segment analysis 2018 - 2022
- Historic Market Size - Product Segment 2018 - 2022 ($ million)
- 4.3 Type segment analysis 2018 - 2022
- Historic Market Size - Type Segment 2018 - 2022 ($ million)
- 4.4 Geography segment analysis 2018 - 2022
- Historic Market Size - Geography Segment 2018 - 2022 ($ million)
- 4.5 Country segment analysis 2018 - 2022
- Historic Market Size - Country Segment 2018 - 2022 ($ million)
5 Five Forces Analysis
- 5.1 Five forces summary
- Five forces analysis - Comparison between 2023 and 2028
- 5.2 Bargaining power of buyers
- Bargaining power of buyers - Impact of key factors 2023 and 2028
- 5.3 Bargaining power of suppliers
- Bargaining power of suppliers - Impact of key factors in 2023 and 2028
- 5.4 Threat of new entrants
- Threat of new entrants - Impact of key factors in 2023 and 2028
- 5.5 Threat of substitutes
- Threat of substitutes - Impact of key factors in 2023 and 2028
- 5.6 Threat of rivalry
- Threat of rivalry - Impact of key factors in 2023 and 2028
- 5.7 Market condition
- Chart on Market condition - Five forces 2023 and 2028
6 Market Segmentation by Product
- 6.1 Market segments
- Chart on Product - Market share 2023-2028 (%)
- Data Table on Product - Market share 2023-2028 (%)
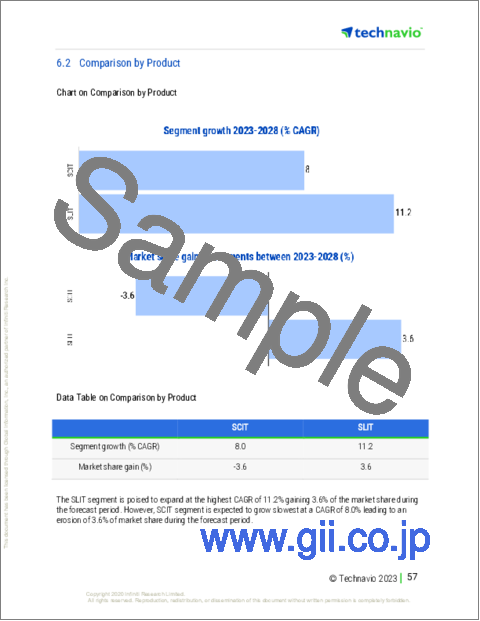
- 6.2 Comparison by Product
- Chart on Comparison by Product
- Data Table on Comparison by Product
- 6.3 SCIT - Market size and forecast 2023-2028
- Chart on SCIT - Market size and forecast 2023-2028 ($ million)
- Data Table on SCIT - Market size and forecast 2023-2028 ($ million)
- Chart on SCIT - Year-over-year growth 2023-2028 (%)
- Data Table on SCIT - Year-over-year growth 2023-2028 (%)
- 6.4 SLIT - Market size and forecast 2023-2028
- Chart on SLIT - Market size and forecast 2023-2028 ($ million)
- Data Table on SLIT - Market size and forecast 2023-2028 ($ million)
- Chart on SLIT - Year-over-year growth 2023-2028 (%)
- Data Table on SLIT - Year-over-year growth 2023-2028 (%)
- 6.5 Market opportunity by Product
- Market opportunity by Product ($ million)
- Data Table on Market opportunity by Product ($ million)
7 Market Segmentation by Type
- 7.1 Market segments
- Chart on Type - Market share 2023-2028 (%)
- Data Table on Type - Market share 2023-2028 (%)
- 7.2 Comparison by Type
- Chart on Comparison by Type
- Data Table on Comparison by Type
- 7.3 Allergic Rhinitis - Market size and forecast 2023-2028
- Chart on Allergic Rhinitis - Market size and forecast 2023-2028 ($ million)
- Data Table on Allergic Rhinitis - Market size and forecast 2023-2028 ($ million)
- Chart on Allergic Rhinitis - Year-over-year growth 2023-2028 (%)
- Data Table on Allergic Rhinitis - Year-over-year growth 2023-2028 (%)
- 7.4 Asthma - Market size and forecast 2023-2028
- Chart on Asthma - Market size and forecast 2023-2028 ($ million)
- Data Table on Asthma - Market size and forecast 2023-2028 ($ million)
- Chart on Asthma - Year-over-year growth 2023-2028 (%)
- Data Table on Asthma - Year-over-year growth 2023-2028 (%)
- 7.5 Food Allergy - Market size and forecast 2023-2028
- Chart on Food Allergy - Market size and forecast 2023-2028 ($ million)
- Data Table on Food Allergy - Market size and forecast 2023-2028 ($ million)
- Chart on Food Allergy - Year-over-year growth 2023-2028 (%)
- Data Table on Food Allergy - Year-over-year growth 2023-2028 (%)
- 7.6 Others - Market size and forecast 2023-2028
- Chart on Others - Market size and forecast 2023-2028 ($ million)
- Data Table on Others - Market size and forecast 2023-2028 ($ million)
- Chart on Others - Year-over-year growth 2023-2028 (%)
- Data Table on Others - Year-over-year growth 2023-2028 (%)
- 7.7 Market opportunity by Type
- Market opportunity by Type ($ million)
- Data Table on Market opportunity by Type ($ million)
8 Customer Landscape
- 8.1 Customer landscape overview
- Analysis of price sensitivity, lifecycle, customer purchase basket, adoption rates, and purchase criteria
9 Geographic Landscape
- 9.1 Geographic segmentation
- Chart on Market share By Geographical Landscape 2023-2028 (%)
- Data Table on Market share By Geographical Landscape 2023-2028 (%)
- 9.2 Geographic comparison
- Chart on Geographic comparison
- Data Table on Geographic comparison
- 9.3 Europe - Market size and forecast 2023-2028
- Chart on Europe - Market size and forecast 2023-2028 ($ million)
- Data Table on Europe - Market size and forecast 2023-2028 ($ million)
- Chart on Europe - Year-over-year growth 2023-2028 (%)
- Data Table on Europe - Year-over-year growth 2023-2028 (%)
- 9.4 North America - Market size and forecast 2023-2028
- Chart on North America - Market size and forecast 2023-2028 ($ million)
- Data Table on North America - Market size and forecast 2023-2028 ($ million)
- Chart on North America - Year-over-year growth 2023-2028 (%)
- Data Table on North America - Year-over-year growth 2023-2028 (%)
- 9.5 Asia - Market size and forecast 2023-2028
- Chart on Asia - Market size and forecast 2023-2028 ($ million)
- Data Table on Asia - Market size and forecast 2023-2028 ($ million)
- Chart on Asia - Year-over-year growth 2023-2028 (%)
- Data Table on Asia - Year-over-year growth 2023-2028 (%)
- 9.6 Rest of World (ROW) - Market size and forecast 2023-2028
- Chart on Rest of World (ROW) - Market size and forecast 2023-2028 ($ million)
- Data Table on Rest of World (ROW) - Market size and forecast 2023-2028 ($ million)
- Chart on Rest of World (ROW) - Year-over-year growth 2023-2028 (%)
- Data Table on Rest of World (ROW) - Year-over-year growth 2023-2028 (%)
- 9.7 Germany - Market size and forecast 2023-2028
- Chart on Germany - Market size and forecast 2023-2028 ($ million)
- Data Table on Germany - Market size and forecast 2023-2028 ($ million)
- Chart on Germany - Year-over-year growth 2023-2028 (%)
- Data Table on Germany - Year-over-year growth 2023-2028 (%)
- 9.8 France - Market size and forecast 2023-2028
- Chart on France - Market size and forecast 2023-2028 ($ million)
- Data Table on France - Market size and forecast 2023-2028 ($ million)
- Chart on France - Year-over-year growth 2023-2028 (%)
- Data Table on France - Year-over-year growth 2023-2028 (%)
- 9.9 UK - Market size and forecast 2023-2028
- Chart on UK - Market size and forecast 2023-2028 ($ million)
- Data Table on UK - Market size and forecast 2023-2028 ($ million)
- Chart on UK - Year-over-year growth 2023-2028 (%)
- Data Table on UK - Year-over-year growth 2023-2028 (%)
- 9.10 US - Market size and forecast 2023-2028
- Chart on US - Market size and forecast 2023-2028 ($ million)
- Data Table on US - Market size and forecast 2023-2028 ($ million)
- Chart on US - Year-over-year growth 2023-2028 (%)
- Data Table on US - Year-over-year growth 2023-2028 (%)
- 9.11 Japan - Market size and forecast 2023-2028
- Chart on Japan - Market size and forecast 2023-2028 ($ million)
- Data Table on Japan - Market size and forecast 2023-2028 ($ million)
- Chart on Japan - Year-over-year growth 2023-2028 (%)
- Data Table on Japan - Year-over-year growth 2023-2028 (%)
- 9.12 Market opportunity By Geographical Landscape
- Market opportunity By Geographical Landscape ($ million)
- Data Tables on Market opportunity By Geographical Landscape ($ million)
10 Drivers, Challenges, and Opportunity/Restraints
- 10.1 Market drivers
- 10.2 Market challenges
- 10.3 Impact of drivers and challenges
- Impact of drivers and challenges in 2023 and 2028
- 10.4 Market opportunities/restraints
11 Competitive Landscape
- 11.1 Overview
- 11.2 Competitive Landscape
- Overview on criticality of inputs and factors of differentiation
- 11.3 Landscape disruption
- Overview on factors of disruption
- 11.4 Industry risks
- Impact of key risks on business
12 Competitive Analysis
- 12.1 Companies profiled
- Companies covered
- 12.2 Market positioning of companies
- Matrix on companies position and classification
- 12.3 Adamis Pharmaceuticals Corp.
- Adamis Pharmaceuticals Corp. - Overview
- Adamis Pharmaceuticals Corp. - Business segments
- Adamis Pharmaceuticals Corp. - Key offerings
- Adamis Pharmaceuticals Corp. - Segment focus
- 12.4 Aimmune Therapeutics Inc.
- Aimmune Therapeutics Inc. - Overview
- Aimmune Therapeutics Inc. - Product / Service
- Aimmune Therapeutics Inc. - Key offerings
- 12.5 ALK Abello AS
- ALK Abello AS - Overview
- ALK Abello AS - Business segments
- ALK Abello AS - Key offerings
- ALK Abello AS - Segment focus
- 12.6 Allergy Therapeutics PLC
- Allergy Therapeutics PLC - Overview
- Allergy Therapeutics PLC - Product / Service
- Allergy Therapeutics PLC - Key offerings
- 12.7 DBV Technologies SA
- DBV Technologies SA - Overview
- DBV Technologies SA - Product / Service
- DBV Technologies SA - Key offerings
- 12.8 Desentum Oy
- Desentum Oy - Overview
- Desentum Oy - Product / Service
- Desentum Oy - Key offerings
- 12.9 HAL Allergy BV
- HAL Allergy BV - Overview
- HAL Allergy BV - Key offerings
- 12.10 Immunomic Therapeutics Inc.
- Immunomic Therapeutics Inc. - Overview
- Immunomic Therapeutics Inc. - Product / Service
- Immunomic Therapeutics Inc. - Key offerings
- 12.11 Jubilant Pharmova Ltd.
- Jubilant Pharmova Ltd. - Overview
- Jubilant Pharmova Ltd. - Business segments
- Jubilant Pharmova Ltd. - Key offerings
- Jubilant Pharmova Ltd. - Segment focus
- 12.12 LETI Pharma SLU
- LETI Pharma SLU - Overview
- LETI Pharma SLU - Product / Service
- LETI Pharma SLU - Key offerings
- 12.13 LOFARMA Spa
- LOFARMA Spa - Overview
- LOFARMA Spa - Product / Service
- LOFARMA Spa - Key offerings
- 12.14 Merck KGaA
- Merck KGaA - Overview
- Merck KGaA - Business segments
- Merck KGaA - Key news
- Merck KGaA - Key offerings
- Merck KGaA - Segment focus
- 12.15 Novartis AG
- Novartis AG - Overview
- Novartis AG - Business segments
- Novartis AG - Key news
- Novartis AG - Key offerings
- Novartis AG - Segment focus
- 12.16 Stallergenes Greer Ltd.
- Stallergenes Greer Ltd. - Overview
- Stallergenes Greer Ltd. - Product / Service
- Stallergenes Greer Ltd. - Key offerings
- 12.17 Viatris Inc.
- Viatris Inc. - Overview
- Viatris Inc. - Business segments
- Viatris Inc. - Key news
- Viatris Inc. - Key offerings
- Viatris Inc. - Segment focus
13 Appendix
- 13.1 Scope of the report
- 13.2 Inclusions and exclusions checklist
- Inclusions checklist
- Exclusions checklist
- 13.3 Currency conversion rates for US$
- Currency conversion rates for US$
- 13.4 Research methodology
- Research methodology
- 13.5 Data procurement
- Information sources
- 13.6 Data validation
- Data validation
- 13.7 Validation techniques employed for market sizing
- Validation techniques employed for market sizing
- 13.8 Data synthesis
- Data synthesis
- 13.9 360 degree market analysis
- 360 degree market analysis
- 13.10 List of abbreviations
- List of abbreviations

