
|
市場調査レポート
商品コード
1699405
臨床試験市場の機会、成長促進要因、産業動向分析、2025年~2034年の予測Clinical Trials Market Opportunity, Growth Drivers, Industry Trend Analysis, and Forecast 2025-2034 |
||||||
カスタマイズ可能
|
|||||||
| 臨床試験市場の機会、成長促進要因、産業動向分析、2025年~2034年の予測 |
|
出版日: 2025年02月27日
発行: Global Market Insights Inc.
ページ情報: 英文 183 Pages
納期: 2~3営業日
|

全表示
- 概要
- 目次
世界の臨床試験市場は2024年に590億米ドルと評価され、2025年から2034年にかけてCAGR 5.2%で成長すると予測されています。
先進的な治療オプションに対する需要の高まりと医薬品開発への投資の増加が、市場拡大の原動力となっています。がん、糖尿病、心血管疾患などの慢性疾患が蔓延するにつれ、製薬企業やバイオテクノロジー企業は革新的な治療法の導入に向けた取り組みを強化しています。臨床研究活動の急増は、精密医療や標的治療への幅広いシフトを反映しており、臨床試験セクターの成長をさらに後押ししています。さらに、人工知能(AI)、ビッグデータ分析、分散型臨床試験などの技術的進歩が臨床研究を変革し、臨床試験の効率性と費用対効果を高めています。医薬品の早期承認に向けた規制当局の支援や、研究機関とヘルスケアプロバイダーとの協力関係の強化も、市場拡大に寄与しています。患者中心のアプローチと適応性の高い試験デザインへの注目が高まる中、臨床試験市場は今後数年で大きな進化を遂げると思われます。
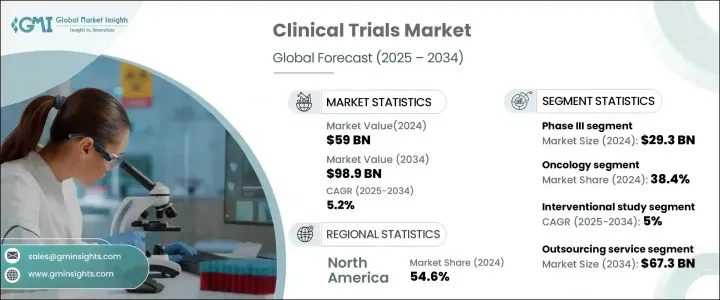
臨床試験市場はフェーズI、II、III、IVに区分されます。このうち、第III相は2024年に293億米ドルを占め、この分野を支配しています。これらの大規模臨床試験は、薬事承認前に医薬品の安全性と有効性を検証するために不可欠です。その複雑さと多様な患者集団の必要性から、第III相試験は包括的な臨床データを得るために複数の場所で実施されます。企業が新薬の製剤やバイオシミラーの開発を進める中、大規模な第III相試験の需要は増加の一途をたどっており、この分野が市場で主要な地位を占めるようになっています。
| 市場範囲 | |
|---|---|
| 開始年 | 2024 |
| 予測年 | 2025-2034 |
| 開始金額 | 590億米ドル |
| 予測金額 | 989億米ドル |
| CAGR | 5.2% |
試験デザインに基づき、臨床試験は介入試験、観察試験、拡大アクセス試験に分類されます。介入試験セグメントは2024年に市場をリードし、2025年から2034年にかけてCAGR 5%で成長すると予測されています。これらの研究は、管理された治療プロトコールに参加者を積極的に参加させることで、新たな医療介入の有効性を決定する上で極めて重要な役割を果たしています。想起バイアスを排除し、治療結果の構造化された評価を提供することで、介入試験は最高レベルの臨床エビデンスを提供します。その結果、製薬会社や規制機関は、医薬品の承認を迅速化し、治療基準を向上させるために、こうした試験への依存度を高めています。
北米の臨床試験市場は2024年に54.6%のシェアを占め、製薬企業やバイオテクノロジー企業が集中していることから優位性を維持しています。医薬品開発、特にプレシジョンメディシンや生物製剤の開発が複雑化する中、同地域の企業は次世代治療を市場に投入するため、臨床試験に多額の投資を行っています。強力な規制の枠組み、確立された研究インフラ、臨床試験への資金提供の増加が、北米のこの分野でのリーダーシップをさらに支えています。革新的な治療法に対する需要が高まるにつれ、この地域は継続的な成長を遂げ、世界の臨床研究において極めて重要な役割を果たすようになっています。
目次
第1章 調査手法と調査範囲
第2章 エグゼクティブサマリー
第3章 業界洞察
- エコシステム分析
- 業界への影響要因
- 促進要因
- 世界の慢性疾患の流行
- CROへの臨床試験アウトソーシング需要の高まり
- 臨床試験に対する政府および非政府からの資金提供の増加
- アジア太平洋諸国における臨床試験実施機会の増加
- 業界の潜在的リスク&課題
- 臨床研究の熟練労働力の不足
- 新興諸国におけるインフラの障壁
- 北米および欧州における臨床試験実施の課題
- 促進要因
- 成長可能性分析
- 臨床試験件数分析
- 臨床試験件数分析、地域別、2021年~2024年
- 臨床試験件数分析:開発フェーズ別、2021年~2024年
- 臨床試験件数分析、適応症別、2021年~2024年
- 規制状況
- 米国
- 欧州
- アジア太平洋
- シンガポール
- マレーシア
- インドネシア
- タイ
- 韓国
- フィリピン
- 臨床試験- アジア太平洋地域の優位性
- ポーターズ分析
- PESTEL分析
第4章 競合情勢
- イントロダクション
- 企業マトリックス分析
- M&Aの情勢
- 主要市場プレーヤーの競合分析
- 競合のポジショニング・マトリックス
- 戦略ダッシュボード
第5章 市場推計・予測:フェーズ別、2021年~2034年
- 主要動向
- フェーズI
- フェーズII
- フェーズIII
- フェーズIV
第6章 市場推計・予測:試験デザイン別、2021年~2034年
- 主要動向
- 介入調査
- 観察調査
- 拡張アクセス調査
第7章 市場予測:サービスタイプ別市場推計・予測:サービスタイプ別、2021年~2034年
- 主要動向
- アウトソーシングサービス
- 自社サービス
第8章 市場推計・予測:治療領域別、2021年~2034年
- 主要動向
- 自己免疫疾患
- 腫瘍
- 循環器領域
- 感染症
- 皮膚科
- 眼科
- 神経
- 血液内科
- その他の治療領域
第9章 市場推計・予測:地域別、2021年~2034年
- 主要動向
- 北米
- 米国
- カナダ
- 欧州
- ドイツ
- 英国
- フランス
- スペイン
- イタリア
- ポーランド
- オランダ
- スイス
- アジア太平洋
- 中国
- 日本
- インド
- オーストラリア
- 韓国
- シンガポール
- マレーシア
- インドネシア
- タイ
- フィリピン
- ラテンアメリカ
- ブラジル
- メキシコ
- アルゼンチン
- 中東・アフリカ
- サウジアラビア
- 南アフリカ
- アラブ首長国連邦
第10章 企業プロファイル
- Charles River Laboratories
- Clinipace
- Eli Lilly and Company
- ICON
- IQVIA
- Laboratory Corporation of America Holdings(Covance Inc)
- Medpace
- Merck &Co
- Parexel International Corporation
- Pfizer
- SGS SA
- Syneos Health
- The Emmes Company
- Thermo Fisher Scientific(PPD)
- Veeda Clinical Research
- Worldwide Clinical Trials
- WuXi AppTech
The Global Clinical Trials Market was valued at USD 59 billion in 2024 and is projected to grow at a CAGR of 5.2% between 2025 and 2034. The rising demand for advanced treatment options, coupled with increasing investments in drug development, is driving market expansion. As chronic diseases such as cancer, diabetes, and cardiovascular conditions become more prevalent, pharmaceutical and biotechnology companies are ramping up their efforts to introduce innovative therapies. The surge in clinical research activity reflects a broader shift toward precision medicine and targeted treatments, further fueling growth in the clinical trials sector. Additionally, technological advancements such as artificial intelligence (AI), big data analytics, and decentralized trials are transforming clinical research, making trials more efficient and cost-effective. Regulatory support for fast-track drug approvals and increased collaboration between research institutions and healthcare providers are also contributing to market expansion. With an increasing focus on patient-centric approaches and adaptive trial designs, the clinical trials market is set to witness significant evolution in the coming years.
The clinical trials market is segmented by phase into Phase I, II, III, and IV. Among these, Phase III dominates the sector, accounting for USD 29.3 billion in 2024. These large-scale trials are critical for validating a drug's safety and efficacy before regulatory approval. Given their complexity and the need for diverse patient populations, Phase III studies are conducted across multiple locations to generate comprehensive clinical data. As companies push forward with novel drug formulations and biosimilars, the demand for extensive Phase III trials continues to rise, reinforcing this segment's leading position in the market.
| Market Scope | |
|---|---|
| Start Year | 2024 |
| Forecast Year | 2025-2034 |
| Start Value | $59 Billion |
| Forecast Value | $98.9 Billion |
| CAGR | 5.2% |
Based on study design, clinical trials are categorized into interventional, observational, and expanded access studies. The interventional study segment led the market in 2024 and is anticipated to grow at a CAGR of 5% from 2025 to 2034. These studies play a pivotal role in determining the efficacy of new medical interventions by actively involving participants in controlled treatment protocols. By eliminating recall bias and offering a structured evaluation of treatment outcomes, interventional trials provide the highest level of clinical evidence. As a result, pharmaceutical companies and regulatory bodies increasingly rely on these studies to accelerate drug approvals and enhance treatment standards.
North America Clinical Trials Market held a 54.6% share in 2024, maintaining its dominance due to a high concentration of pharmaceutical and biotechnology companies. With the growing complexity of drug development, particularly in precision medicine and biologics, companies across the region are investing heavily in clinical trials to bring next-generation treatments to market. Strong regulatory frameworks, well-established research infrastructure, and increased funding for clinical studies further support North America's leadership in the sector. As demand for innovative therapies escalates, the region is poised for continued growth, reinforcing its pivotal role in global clinical research.
Table of Contents
Chapter 1 Methodology and Scope
- 1.1 Market scope and definitions
- 1.2 Research design
- 1.2.1 Research approach
- 1.2.2 Data collection methods
- 1.3 Base estimates and calculations
- 1.3.1 Base year calculation
- 1.3.2 Key trends for market estimation
- 1.4 Forecast model
- 1.5 Primary research and validation
- 1.5.1 Primary sources
- 1.5.2 Data mining sources
Chapter 2 Executive Summary
- 2.1 Industry 3600 synopsis
Chapter 3 Industry Insights
- 3.1 Industry ecosystem analysis
- 3.2 Industry impact forces
- 3.2.1 Growth drivers
- 3.2.1.1 Increasing prevalence of chronic diseases across the globe
- 3.2.1.2 Growing demand for outsourcing clinical trials to CROs
- 3.2.1.3 Rise in government and non-government funding for clinical trials
- 3.2.1.4 Growing opportunities for conducting clinical trials in countries of Asia Pacific
- 3.2.2 Industry pitfalls and challenges
- 3.2.2.1 Lack of skilled workforce in clinical research
- 3.2.2.2 Infrastructural barriers in developing countries
- 3.2.2.3 Challenges faced in North America and Europe for conducting clinical trials
- 3.2.1 Growth drivers
- 3.3 Growth potential analysis
- 3.4 Clinical trials volume analysis
- 3.4.1 Clinical trials volume analysis, by region, 2021 - 2024
- 3.4.2 Clinical trials volume analysis, by phase of development, 2021 - 2024
- 3.4.3 Clinical trials volume analysis, by indication, 2021 - 2024
- 3.5 Regulatory landscape
- 3.5.1 U.S.
- 3.5.2 Europe
- 3.5.3 Asia Pacific
- 3.5.3.1 Singapore
- 3.5.3.2 Malaysia
- 3.5.3.3 Indonesia
- 3.5.3.4 Thailand
- 3.5.3.5 South Korea
- 3.5.3.6 Philippines
- 3.6 Clinical trials - Asia Pacific advantage
- 3.7 Porters analysis
- 3.8 PESTEL analysis
Chapter 4 Competitive Landscape, 2024
- 4.1 Introduction
- 4.2 Company matrix analysis
- 4.3 Merger and acquisition landscape
- 4.4 Competitive analysis of major market players
- 4.5 Competitive positioning matrix
- 4.6 Strategy dashboard
Chapter 5 Market Estimates and Forecast, By Phase, 2021 – 2034 ($ Mn)
- 5.1 Key trends
- 5.2 Phase I
- 5.3 Phase II
- 5.4 Phase III
- 5.5 Phase IV
Chapter 6 Market Estimates and Forecast, By Study Design, 2021 – 2034 ($ Mn)
- 6.1 Key trends
- 6.2 Interventional study
- 6.3 Observational study
- 6.4 Expanded access study
Chapter 7 Market Estimates and Forecast, By Service Type, 2021 – 2034 ($ Mn)
- 7.1 Key trends
- 7.2 Outsourcing service
- 7.3 In-house service
Chapter 8 Market Estimates and Forecast, By Therapeutic Area, 2021 – 2034 ($ Mn)
- 8.1 Key trends
- 8.2 Autoimmune disease
- 8.3 Oncology
- 8.4 Cardiology
- 8.5 Infectious disease
- 8.6 Dermatology
- 8.7 Ophthalmology
- 8.8 Neurology
- 8.9 Hematology
- 8.10 Other therapeutic areas
Chapter 9 Market Estimates and Forecast, By Region, 2021 – 2034 ($ Mn)
- 9.1 Key trends
- 9.2 North America
- 9.2.1 U.S.
- 9.2.2 Canada
- 9.3 Europe
- 9.3.1 Germany
- 9.3.2 UK
- 9.3.3 France
- 9.3.4 Spain
- 9.3.5 Italy
- 9.3.6 Poland
- 9.3.7 Netherlands
- 9.3.8 Switzerland
- 9.4 Asia Pacific
- 9.4.1 China
- 9.4.2 Japan
- 9.4.3 India
- 9.4.4 Australia
- 9.4.5 South Korea
- 9.4.6 Singapore
- 9.4.7 Malaysia
- 9.4.8 Indonesia
- 9.4.9 Thailand
- 9.4.10 Philippines
- 9.5 Latin America
- 9.5.1 Brazil
- 9.5.2 Mexico
- 9.5.3 Argentina
- 9.6 Middle East and Africa
- 9.6.1 Saudi Arabia
- 9.6.2 South Africa
- 9.6.3 UAE
Chapter 10 Company Profiles
- 10.1 Charles River Laboratories
- 10.2 Clinipace
- 10.3 Eli Lilly and Company
- 10.4 ICON
- 10.5 IQVIA
- 10.6 Laboratory Corporation of America Holdings (Covance Inc)
- 10.7 Medpace
- 10.8 Merck & Co
- 10.9 Parexel International Corporation
- 10.10 Pfizer
- 10.11 SGS SA
- 10.12 Syneos Health
- 10.13 The Emmes Company
- 10.14 Thermo Fisher Scientific (PPD)
- 10.15 Veeda Clinical Research
- 10.16 Worldwide Clinical Trials
- 10.17 WuXi AppTech

