|
|
市場調査レポート
商品コード
1396649
空間コンピューティングの世界市場-2023年~2030年Global Spatial Computing Market - 2023-2030 |
||||||
|
|
|||||||
|
● お客様のご希望に応じて、既存データの加工や未掲載情報(例:国別セグメント)の追加などの対応が可能です。 詳細はお問い合わせください。 |
|||||||


| 空間コンピューティングの世界市場-2023年~2030年 |
|
出版日: 2023年12月15日
発行: DataM Intelligence
ページ情報: 英文 210 Pages
納期: 約2営業日
|
- 全表示
- 概要
- 目次
概要
世界の空間コンピューティング市場は、2022年に818億米ドルに達し、2023-2030年の予測期間中にCAGR 23.5%で成長し、2030年には2,698億米ドルに達すると予測されています。
小売、不動産、観光などの主要産業における空間コンピューティングの応用拡大が、予測期間中の市場成長を後押しします。また、空間コンピューティング分野における拡張現実(AR)や仮想現実(VR)の技術的進歩は、人々がデジタル世界と物理世界をどのように認識し、相互作用するかに革命的な革命を巻き起こしました。この市場開拓は、市場の成長をさらに後押しします。
小売業における空間コンピューティングの採用が拡大していることも、市場の成長を後押ししています。例えば、2023年8月28日、Auki Labs社は、小売業務を効率化し、高度なインストアショッパーマーケティング体験を可能にする空間コンピューティングプラットフォームのパブリックベータ版を発表しました。新たに発表されたプラットフォームは、北米と欧州の小売業者向けに提供されます。
北米の主要企業は、予測期間を通じて市場成長を強化するためにM&A戦略を採用しています。例えば、2022年4月21日、Blackrock Neurotech社は、空間コンピューティングソフトウェア企業であるMindX社を買収し、フルスタックブレインコンピュータインターフェース製品を商品化しました。この買収により、革新的な機能を備えたフルスタックの統合BCI製品を提供できるようになります。
力学
成長するヘルスケア・医療業界
空間コンピューティングは医療トレーニングや教育に利用され、医療専門家がリスクのない仮想環境で手術や医療処置を実践できるようにします。これにより、トレーニング体験が向上し、学習が加速され、ヘルスケア実践の改善に貢献します。空間コンピューティングは、遠隔診察や遠隔医療を可能にします。医師は遠隔地から患者と対話し、病状を診断することで、遠隔地や緊急時のヘルスケア・サービスへのアクセスを提供します。
バーチャル・リアリティは、患者を落ち着かせ、気を紛らわせる環境に浸すことで、医療処置中の疼痛知覚を軽減し、疼痛管理に利用されています。バーチャルリアリティ療法は、ストレスや不安の軽減に役立ちます。例えば、空間コンピューティングのリーディング・カンパニーであるXRHealth社は2023年8月2日、バーチャル・リアリティ療法が患者のストレスや不安を34%軽減するのに役立つと発表しました。同社のVR技術は治療介入に使用され、その結果、患者の73%でストレスが減少しました。
技術の進歩
より強力なプロセッサー、高解像度ディスプレイ、高度なセンサーなど、空間コンピューティングのハードウェアコンポーネントにおける技術進歩により、空間コンピューティングデバイスはよりリアルで応答性の高い体験を提供できるようになります。空間コンピューティングのハードウェアの技術的進歩は、消費者と企業の双方を引き付け、最新機器への投資を促します。
さらに、空間コンピューティングのハードウェアは、より良いユーザー体験をもたらします。仮想現実や拡張現実のデバイスでは、乗り物酔いの軽減、待ち時間の短縮、トラッキング精度の向上など、より快適で魅力的な体験が可能になります。技術の進歩により、仮想現実や拡張現実アプリケーション向けに、より没入感のある高品質なコンテンツの作成が可能になります。これには、インタラクティブなストーリーテリング、リアルなシミュレーション、実物そっくりのグラフィックが含まれ、空間コンピューティングの魅力をより多くの人々にアピールします。
高コスト
仮想現実(VR)ヘッドセットや拡張現実(AR)メガネなどの空間コンピューティング・ハードウェアの開発・製造コストは高いです。高コストが、特に消費者市場での普及を制限しています。空間コンピューティングの成功は、没入感のある魅力的なコンテンツの有無に大きく依存します。コンテンツのエコシステムが限られていると、ハードウェアへの投資を正当化できるだけの魅力的なアプリケーションがない可能性があるため、ユーザーによる普及が妨げられます。
空間コンピューティング技術、特に拡張現実の使用は、これらのデバイスが現実世界と人々の相互作用をキャプチャして分析するため、プライバシーに関する懸念を引き起こします。ユーザーや規制当局は、個人データの悪用やプライバシー侵害の可能性を懸念しています。シームレスでリアルな体験を提供する空間コンピューティングハードウェアとソフトウェアの開発は、技術的に困難です。乗り物酔い、待ち時間、トラッキングの不正確さといった問題は、ユーザーの満足度に悪影響を及ぼします。
目次
第1章 調査手法と調査範囲
第2章 定義と概要
第3章 エグゼクティブサマリー
第4章 市場力学
- 影響要因
- 促進要因
- ヘルスケアと医療産業の成長
- 技術の進歩
- 抑制要因
- 高コスト
- 機会
- 影響分析
- 促進要因
第5章 産業分析
- ポーターのファイブフォース分析
- サプライチェーン分析
- 価格分析
- 規制分析
- ロシア・ウクライナ戦争の影響分析
- DMIの見解
第6章 COVID-19分析
第7章 ソリューション別
- ハードウェア
- ソフトウェア
- サービス
第8章 技術別
- 人工知能
- 拡張現実
- 仮想現実
- 複合現実
- モノのインターネット
- デジタルツイン
- その他
第9章 用途別
- エンターテインメント
- デザイン・製造
- 会議・交流
- 物流
- その他
第10章 エンドユーザー別
- ヘルスケア
- 教育
- 建設
- 航空宇宙・防衛
- 自動車
- BFSI
- IT・通信
- エネルギー・ユーティリティ
- 製造業
- その他
第11章 地域別
- 北米
- 米国
- カナダ
- メキシコ
- 欧州
- ドイツ
- 英国
- フランス
- イタリア
- スペイン
- その他欧州
- 南米
- ブラジル
- アルゼンチン
- その他南米
- アジア太平洋
- 中国
- インド
- 日本
- オーストラリア
- その他アジア太平洋地域
- 中東・アフリカ
第12章 競合情勢
- 競合シナリオ
- 市況/シェア分析
- M&A分析
第13章 企業プロファイル
- Apple Inc.
- 会社概要
- 製品ポートフォリオと説明
- 財務概要
- 主な発展
- Avegant Corporation
- Blippar Group Limited
- DAQRI
- Google LLC
- HTC Corporation
- Lenovo Group Limited
- Magic Leap Inc.
- Marxent
- Microsoft Corporation
第14章 付録
Overview
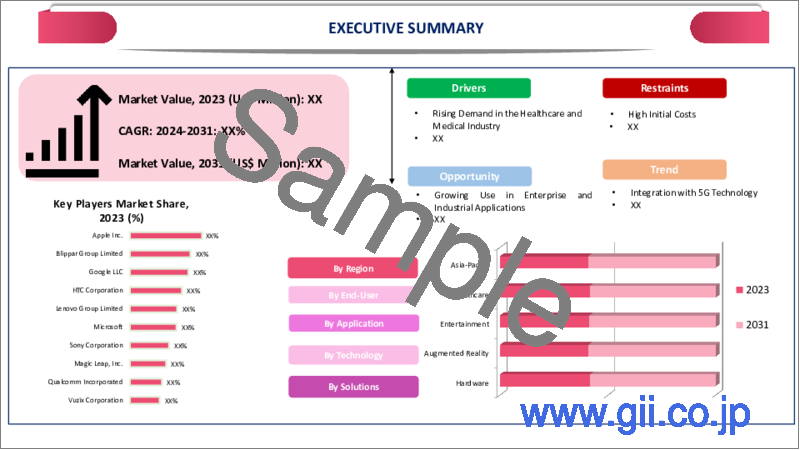
Global Spatial Computing Market reached US$ 81.8 billion in 2022 and is expected to reach US$ 269.8 billion by 2030, growing with a CAGR of 23.5% during the forecast period 2023-2030.
Growing application of spatial computing in major industries like retail, real estate and tourism helps to boost market growth over the forecast period. Also, technological advancements in augmented reality and virtual reality in the field of spatial computing sparked a revolutionary revolution in how people perceive and interact with the digital and physical worlds. The development further helps to boost market growth.
The growing adoption of spatial computing in retail operations helps to grow the market. For instance, on August 28, 2023, Auki Labs announced the public beta of its spatial computing platform to make retail operations more efficient and to enable advanced in-store shopper marketing experiences. The newly launched platform is available for retailers in North America and Europe.
Major key players in North America are employing merger and acquisition strategies to enhance market growth throughout the forecast period. For instance, on April 21, 2022, Blackrock Neurotech acquired MindX, a spatial computing software firm to commercialize a full stack brain-computer interface product. The acquisition helps to deliver full-stack, integrated BCI products with innovative capabilities.
Dynamics
Growing Healthcare and Medical Industry
Spatial Computing is used for medical training and education, allowing medical professionals to practice surgeries and medical procedures in a risk-free virtual environment. The enhances the training experience and accelerates learning, contributing to improved healthcare practices. Spatial computing enables remote consultations and telemedicine. Doctors interact with patients and diagnose conditions from a distance, providing access to healthcare services in remote areas or during emergencies.
Virtual reality is used for pain management by immersing patients in calming and distracting environments, reducing the perception of pain during medical procedures. Virtual reality therapy helps to reduce stress and anxiety. For instance, on August 02, 2023, XRHealth, a leading company in spatial computing announced that virtual reality therapy helps to reduce stress and anxiety in patients by 34%. The company's VR technology is used for therapeutic intervention which resulted in decreased stress in 73% of patients.
Technological Advancement
Technological advancement in hardware components of spatial computing such as more powerful processors, high-resolution displays and advanced sensors, enable spatial computing devices to deliver more realistic and responsive experiences. The technological advancements in the hardware of spatial computing attract both consumers and businesses to invest in the latest devices.
In addition to this hardware of spatial computing lead to a better user experience. It includes reduced motion sickness, decreased latency and improved tracking accuracy, in virtual and augmented reality devices making it more comfortable and engaging. Technological progress enables the creation of more immersive and high-quality content for virtual and augmented reality applications. The includes interactive storytelling, realistic simulations and lifelike graphics, which increase the appeal of spatial computing to a broader audience.
High Cost
The cost of developing and manufacturing spatial computing hardware, such as virtual reality (VR) headsets and augmented reality (AR) glasses is high. High cost limiting widespread adoption, particularly in the consumer market. The success of spatial computing heavily depends on the availability of immersive and engaging content. A limited content ecosystem hinders user adoption, as there may not be enough compelling applications to justify the investment in hardware.
The use of spatial computing technologies, especially augmented reality raises privacy concerns, as these devices capture and analyze the real world and people's interactions. Users and regulators are concerned about potential misuse of personal data and invasions of privacy. Developing spatial computing hardware and software that provide seamless and realistic experiences is technically challenging. Issues like motion sickness, latency and tracking inaccuracies negatively impact user satisfaction.
Segment Analysis
The global spatial computing market is segmented based on solution, technology, application, end-user and region.
Growing Importance of Hardware Solutions
Based on the solution segment, the spatial computing market is divided into Hardware, software and services. The Hardware segment accounted for the largest market share in the global spatial computing market. Rapid innovation in hardware components, such as cameras, sensors and processors, has resulted in more powerful and capable spatial computing devices. The growing technological advancements in hardware solutions and spatial computing help to boost market growth over the forecast period.
To fulfill consumer's demand for spatial computing major key players in the market launched new products in the market. For instance, on June 05, 2023, Apple launched Apple Vision Pro, a revolutionary spatial computer that seamlessly blends digital content with the physical world. It creates an infinite canvas for apps that scale beyond the boundaries of traditional display and introduces a fully 3D user interface controlled by natural inputs.
Geographical Penetration
High Penetration of Technology in North America Helps to Boost Market Growth of Spatial Computing
North America accounted largest market share in the global spatial computing market due to growing research and development and growing adoption of spatial computing technologies. The U.S. is a dominating country in the region due to an increase in research and development activities by major key players such as Microsoft, Google, Apple and Facebook (Meta).
Some of the major key players in the region follow a merger and acquisition strategy to expand their business. For instance, on July 01, 2021, North Penn School District (NPSD) announced a collaboration with Notion Theory and Unity to launch North America's first Spatial Computing Program for high school students. The course will provide North Penn High School students with Augmented Reality and Virtual Reality development experience. Through this newly launched program students are able to learn how to develop and publish Augmented Reality and Virtual Reality applications.
Competitive Landscape
The major global players in the market include: Apple Inc., Avegant Corporation, Blippar Group Limited, DAQRI, Google LLC, HTC Corporation, Lenovo Group Limited, Magic Leap Inc., Marxent and Microsoft Corporation.
COVID-19 Impact Analysis
The pandemic disrupted global supply chains, affecting the production and distribution of hardware components critical to spatial computing devices, such as sensors and processors. Many companies in the spatial computing market faced delays in product launches and development due to lockdowns, restrictions and a shift in priorities during the early stages of the pandemic.
Economic uncertainties and lockdowns led to reduced consumer spending, impacting the adoption of spatial computing devices, particularly in the consumer market. The pandemic restricted in-person events, trade shows and conferences where spatial computing companies often showcase their products and innovations. While spatial computing has potential applications in remote work and collaboration, the sudden transition to remote work created new challenges for companies looking to integrate these technologies.
Russia-Ukraine War Impact Analysis
The conflict between Russia and Ukraine disrupts the supply chain for components and materials needed for spatial computing devices. It includes processors, sensors and other hardware components. Disruptions in the supply chain led to delays in production and increased costs. Geopolitical tensions and uncertainties lead to financial market volatility. Companies involved in the spatial computing market face challenges related to fluctuating exchange rates and investment uncertainties.
Geopolitical conflicts strain international collaboration and cooperation, which is crucial for the development and growth of emerging technologies. Spatial computing involves partnerships between companies from different countries and the conflict hinders such collaborations. Governments impose export and import restrictions on technology-related products, including spatial computing devices and components. The restrictions affect the global trade of spatial computing technology.
By Solution
- Hardware
- Software
- Services
By Technology
- Artificial Intelligence
- Augmented Reality
- Virtual Reality
- Mixed Reality
- Internet of Things
- Digital Twins
- Others
By Application
- Entertainment
- Design and manufacturing
- Meetings and interaction
- Logistics
- Others
By End-User
- Healthcare
- Education
- Construction
- Aerospace & Defense
- Automotive
- BFSI
- IT & Telecom
- Energy & Utilities
- Manufacturing
- Others
By Region
- North America
- U.S.
- Canada
- Mexico
- Europe
- Germany
- UK
- France
- Italy
- Spain
- Rest of Europe
- South America
- Brazil
- Argentina
- Rest of South America
- Asia-Pacific
- China
- India
- Japan
- Australia
- Rest of Asia-Pacific
- Middle East and Africa
Key Developments
- On October 04, 2023, Qualcomm launched a new spatial computing platform with meta. The new platform enables the next generation of MR, VR and smart glasses. The company helps to improve the next evolution of mixed reality (MR), virtual reality (VR) devices and smart glasses.
- On August 28, 2023, Rokid, a major key player of human-computer interaction technology launched the rokid studio spatial computing platform in the market. The newly launched program allows users to explore true spatial AR experiences using natural motion input and voice commands.
- On October 25, 2021, Bosch collaborated with Carnegie Mellon University (CMU) in North America to increase research on spatial computing. Bosch Research invested US$ 3 million in a joint research effort with CMU
Why Purchase the Report?
- To visualize the global spatial computing market segmentation based on solution, technology, application, end-user and region, as well as understand key commercial assets and players.
- Identify commercial opportunities by analyzing trends and co-development.
- Excel data sheet with numerous data points of spatial computing market-level with all segments.
- PDF report consists of a comprehensive analysis after exhaustive qualitative interviews and an in-depth study.
- Product mapping available as excel consisting of key products of all the major players.
The global spatial computing market report would provide approximately 69 tables, 80 figures and 210 Pages.
Target Audience 2023
- Manufacturers/ Buyers
- Industry Investors/Investment Bankers
- Research Professionals
- Emerging Companies
Table of Contents
1. Methodology and Scope
- 1.1. Research Methodology
- 1.2. Research Objective and Scope of the Report
2. Definition and Overview
3. Executive Summary
- 3.1. Snippet by Solution
- 3.2. Snippet by Technology
- 3.3. Snippet by Application
- 3.4. Snippet by End-User
- 3.5. Snippet by Region
4. Dynamics
- 4.1. Impacting Factors
- 4.1.1. Drivers
- 4.1.1.1. Growing Healthcare and Medical Industry
- 4.1.1.2. Technological Advancement
- 4.1.2. Restraints
- 4.1.2.1. High Cost
- 4.1.3. Opportunity
- 4.1.4. Impact Analysis
- 4.1.1. Drivers
5. Industry Analysis
- 5.1. Porter's Five Force Analysis
- 5.2. Supply Chain Analysis
- 5.3. Pricing Analysis
- 5.4. Regulatory Analysis
- 5.5. Russia-Ukraine War Impact Analysis
- 5.6. DMI Opinion
6. COVID-19 Analysis
- 6.1. Analysis of COVID-19
- 6.1.1. Scenario Before COVID
- 6.1.2. Scenario During COVID
- 6.1.3. Scenario Post COVID
- 6.2. Pricing Dynamics Amid COVID-19
- 6.3. Demand-Supply Spectrum
- 6.4. Government Initiatives Related to the Market During Pandemic
- 6.5. Manufacturers Strategic Initiatives
- 6.6. Conclusion
7. By Solution
- 7.1. Introduction
- 7.1.1. Market Size Analysis and Y-o-Y Growth Analysis (%), By Solution
- 7.1.2. Market Attractiveness Index, By Solution
- 7.2. Hardware*
- 7.2.1. Introduction
- 7.2.2. Market Size Analysis and Y-o-Y Growth Analysis (%)
- 7.3. Software
- 7.4. Services
8. By Technology
- 8.1. Introduction
- 8.1.1. Market Size Analysis and Y-o-Y Growth Analysis (%), By Technology
- 8.1.2. Market Attractiveness Index, By Technology
- 8.2. Artificial Intelligence*
- 8.2.1. Introduction
- 8.2.2. Market Size Analysis and Y-o-Y Growth Analysis (%)
- 8.3. Augmented Reality
- 8.4. Virtual Reality
- 8.5. Mixed Reality
- 8.6. Internet of Things
- 8.7. Digital Twins
- 8.8. Others
9. By Application
- 9.1. Introduction
- 9.1.1. Market Size Analysis and Y-o-Y Growth Analysis (%), By Application
- 9.1.2. Market Attractiveness Index, By Application
- 9.2. Entertainment*
- 9.2.1. Introduction
- 9.2.2. Market Size Analysis and Y-o-Y Growth Analysis (%)
- 9.3. Design and manufacturing
- 9.4. Meetings and interaction
- 9.5. Logistics
- 9.6. Others
10. By End-User
- 10.1. Introduction
- 10.1.1. Market Size Analysis and Y-o-Y Growth Analysis (%), By End-User
- 10.1.2. Market Attractiveness Index, By End-User
- 10.2. Healthcare*
- 10.2.1. Introduction
- 10.2.2. Market Size Analysis and Y-o-Y Growth Analysis (%)
- 10.3. Education
- 10.4. Construction
- 10.5. Aerospace & Defense
- 10.6. Automotive
- 10.7. BFSI
- 10.8. IT & Telecom
- 10.9. Energy & Utilities
- 10.10. Manufacturing
- 10.11. Others
11. By Region
- 11.1. Introduction
- 11.1.1. Market Size Analysis and Y-o-Y Growth Analysis (%), By Region
- 11.1.2. Market Attractiveness Index, By Region
- 11.2. North America
- 11.2.1. Introduction
- 11.2.2. Key Region-Specific Dynamics
- 11.2.3. Market Size Analysis and Y-o-Y Growth Analysis (%), By Solution
- 11.2.4. Market Size Analysis and Y-o-Y Growth Analysis (%), By Technology
- 11.2.5. Market Size Analysis and Y-o-Y Growth Analysis (%), By Application
- 11.2.6. Market Size Analysis and Y-o-Y Growth Analysis (%), By End-User
- 11.2.7. Market Size Analysis and Y-o-Y Growth Analysis (%), By Country
- 11.2.7.1. U.S.
- 11.2.7.2. Canada
- 11.2.7.3. Mexico
- 11.3. Europe
- 11.3.1. Introduction
- 11.3.2. Key Region-Specific Dynamics
- 11.3.3. Market Size Analysis and Y-o-Y Growth Analysis (%), By Solution
- 11.3.4. Market Size Analysis and Y-o-Y Growth Analysis (%), By Technology
- 11.3.5. Market Size Analysis and Y-o-Y Growth Analysis (%), By Application
- 11.3.6. Market Size Analysis and Y-o-Y Growth Analysis (%), By End-User
- 11.3.7. Market Size Analysis and Y-o-Y Growth Analysis (%), By Country
- 11.3.7.1. Germany
- 11.3.7.2. UK
- 11.3.7.3. France
- 11.3.7.4. Italy
- 11.3.7.5. Spain
- 11.3.7.6. Rest of Europe
- 11.4. South America
- 11.4.1. Introduction
- 11.4.2. Key Region-Specific Dynamics
- 11.4.3. Market Size Analysis and Y-o-Y Growth Analysis (%), By Solution
- 11.4.4. Market Size Analysis and Y-o-Y Growth Analysis (%), By Technology
- 11.4.5. Market Size Analysis and Y-o-Y Growth Analysis (%), By Application
- 11.4.6. Market Size Analysis and Y-o-Y Growth Analysis (%), By End-User
- 11.4.7. Market Size Analysis and Y-o-Y Growth Analysis (%), By Country
- 11.4.7.1. Brazil
- 11.4.7.2. Argentina
- 11.4.7.3. Rest of South America
- 11.5. Asia-Pacific
- 11.5.1. Introduction
- 11.5.2. Key Region-Specific Dynamics
- 11.5.3. Market Size Analysis and Y-o-Y Growth Analysis (%), By Solution
- 11.5.4. Market Size Analysis and Y-o-Y Growth Analysis (%), By Technology
- 11.5.5. Market Size Analysis and Y-o-Y Growth Analysis (%), By Application
- 11.5.6. Market Size Analysis and Y-o-Y Growth Analysis (%), By End-User
- 11.5.7. Market Size Analysis and Y-o-Y Growth Analysis (%), By Country
- 11.5.7.1. China
- 11.5.7.2. India
- 11.5.7.3. Japan
- 11.5.7.4. Australia
- 11.5.7.5. Rest of Asia-Pacific
- 11.6. Middle East and Africa
- 11.6.1. Introduction
- 11.6.2. Key Region-Specific Dynamics
- 11.6.3. Market Size Analysis and Y-o-Y Growth Analysis (%), By Solution
- 11.6.4. Market Size Analysis and Y-o-Y Growth Analysis (%), By Technology
- 11.6.5. Market Size Analysis and Y-o-Y Growth Analysis (%), By Application
- 11.6.6. Market Size Analysis and Y-o-Y Growth Analysis (%), By End-User
12. Competitive Landscape
- 12.1. Competitive Scenario
- 12.2. Market Positioning/Share Analysis
- 12.3. Mergers and Acquisitions Analysis
13. Company Profiles
- 13.1. Apple Inc.*
- 13.1.1. Company Overview
- 13.1.2. Product Portfolio and Description
- 13.1.3. Financial Overview
- 13.1.4. Key Developments
- 13.2. Avegant Corporation
- 13.3. Blippar Group Limited
- 13.4. DAQRI
- 13.5. Google LLC
- 13.6. HTC Corporation
- 13.7. Lenovo Group Limited
- 13.8. Magic Leap Inc.
- 13.9. Marxent
- 13.10. Microsoft Corporation
LIST NOT EXHAUSTIVE
14. Appendix
- 14.1. About Us and Services
- 14.2. Contact Us