|
|
市場調査レポート
商品コード
1515539
自動車用イメージング市場:技術別、車両タイプ別、国別、地域別 - 産業分析、市場規模、市場シェア、2024年~2032年の予測Automotive Imaging Market, By Technology, By Vehicle Type, By Country, and By Region - Industry Analysis, Market Size, Market Share & Forecast from 2024-2032 |
||||||
|
|||||||
カスタマイズ可能
|
|||||||

| 自動車用イメージング市場:技術別、車両タイプ別、国別、地域別 - 産業分析、市場規模、市場シェア、2024年~2032年の予測 |
|
出版日: 2024年06月04日
発行: AnalystView Market Insights
ページ情報: 英文 346 Pages
納期: 2~3営業日
|

全表示
- 概要
- 図表
- 目次
レポートハイライト
2023年の自動車用イメージング市場規模は35億2,420万米ドルで、2024年から2032年にかけてCAGR 12.40%で拡大
自動車用イメージング市場-市場力学
自動車におけるADAS機能の人気の高まり
ADAS技術には、アダプティブ・クルーズ・コントロール、レーン・キーピング・アシスト、ブラインド・スポット・モニタリング、自動緊急ブレーキなどの安全性と利便性を高める機能があります。これらの特徴は、安全性と利便性を重視する消費者の間で非常に人気があります。その結果、メーカーは急速にADASを車両タイプに組み込み、画像センサーの需要を高めています。ADASの重要な目的のひとつは、交通安全の向上です。画像センサーは、こうした規制基準を達成するために不可欠です。世界中の政府や安全機関が交通安全強化におけるADASの重要性を強調する中、イメージセンサ業界への好影響は世界規模で拡大しています。このような理由により、自動車用イメージングの世界市場が牽引されると予測されます。
自動車用イメージング市場-主な洞察
当社のリサーチアナリストは、世界市場は2024年から2032年にかけて約12.40%のCAGRで発展すると予測しています。
技術セグメンテーションに基づくと、CMOS技術分野が2023年に最大の収益シェアを占めました。
車両タイプ別では、2023年には乗用車セクターが市場を独占します。
地域別では、アジア太平洋地域が2023年に収益でリードしました。
自動車用イメージング市場-セグメンテーション分析:
世界の自動車用イメージング市場は、技術、車両タイプ、地域によって区分されます。
市場は技術によって2つのカテゴリーに分けられる:CMOSとCCDです。CMOS技術セグメントは2023年に最大の収益シェアを占め、予測期間中もこの傾向が続くと予測されます。これは、CMOSが小型でエネルギー消費量が少なく、費用対効果が高いため、幅広い用途で利用されているためです。
同市場は、車両タイプによって2つのカテゴリーに分けられる:乗用車と商用車です。2023年には、乗用車セグメントが市場を独占します。これは、自動車メーカーが顧客獲得のための競争力の違いとして、優れたイメージセンサー技術を採用しているためと考えられます。高解像度カメラと先進安全機能を追加することで、自動車の魅力と市場競争力を劇的に向上させることができます。
自動車用イメージング市場-地理的洞察
地域的には、この市場は北米、ラテンアメリカ、欧州、アジア太平洋、中東・アフリカに存在します。これらの地域は、どの国がビジネスをもたらすかに基づいてさらに分割されます。2023年には、アジア太平洋地域が53.0%以上で最大の収益シェアを占めています。この地域、特に中国、日本、韓国では電気自動車(EV)の普及が進んでおり、自動車用イメージング・インフラの需要が高まっています。さらに、購入者は自動車の安全性向上のメリットを認識するようになっています。このような意識は、画像センサー技術を搭載した自動車への需要を煽り、この地域全体の市場拡大を促進すると思われます。
中東・アフリカ地域は、予測期間中に最も速いCAGRで発展すると予想されます。この地域は、高級自動車市場が盛んなことで注目されており、市場拡大を後押ししています。高級車メーカーは通常、先進的な画像センシングセンサーをプレミアム機能の重要なコンポーネントとして組み込んでおり、市場成長に大きく貢献しています。
自動車用イメージング市場-競合情勢:
自動車用イメージング市場の競合情勢は非常に激しく、複数の企業が自動車用の革新的な画像処理ソリューションを提供しようとしのぎを削っています。この市場のプレーヤーには、Samsung Electronics Co., Ltd.、Continental AG、Infineon Technologies AG、Semiconductor Components Industries, LLC、DENSO Corporationなどの業界大手が含まれます。これらの企業は、サラウンドビューカメラ、ナイトビジョンシステム、LiDARセンサーなど、自動車の安全性を確保し、自動運転モードの能力を高める重要なツールにおける高度な画像技術で知られています。
目次
第1章 自動車用イメージング市場概要
- 調査範囲
- 市場推定年
第2章 エグゼクティブサマリー
- 市場内訳
- 競合考察
第3章 自動車用イメージングの主要市場動向
- 市場促進要因
- 市場抑制要因
- 市場機会
- 市場の将来動向
第4章 自動車用イメージング産業の調査
- PEST分析
- ポーターのファイブフォース分析
- 成長見通しマッピング
- 規制枠組み分析
第5章 自動車用イメージング市場: COVID-19の影響分析
- COVID-19以前の影響分析
- COVID-19後の影響分析
第6章 自動車用イメージング市場情勢
- 自動車用イメージング市場シェア分析、2023年
- 主要メーカー別内訳データ
- 既存企業の分析
- 新興企業の分析
第7章 自動車用イメージング市場- 技術別
- 概要
- セグメントシェア分析
- CMOS
- CCD
第8章 自動車用イメージング市場- 車両タイプ別
- 概要
- セグメントシェア分析
- 乗用車
- 商用車
第9章 車載用イメージング市場- 地域別
- イントロダクション
- 北米
- 概要
- 北米の主要メーカー
- 米国
- カナダ
- 欧州
- 概要
- 欧州の主要メーカー
- ドイツ
- イタリア
- 英国
- フランス
- ロシア
- オランダ
- スウェーデン
- ポーランド
- その他
- アジア太平洋(APAC)
- 概要
- アジア太平洋地域の主要メーカー
- インド
- 中国
- 日本
- 韓国
- オーストラリア
- タイ
- インドネシア
- フィリピン
- その他
- ラテンアメリカ
- 概要
- ラテンアメリカの主要メーカー
- ブラジル
- メキシコ
- アルゼンチン
- コロンビア
- その他
- 中東およびアフリカ
- 概要
- 中東・アフリカの主要メーカー
- サウジアラビア
- アラブ首長国連邦
- イスラエル
- トルコ
- アルジェリア
- エジプト
- その他
第10章 主要ベンダー分析- 自動車用イメージング業界
- 競争ダッシュボード
- 企業プロファイル
- Samsung Electronics Co., Ltd.
- Continental AG
- Infineon Technologies AG
- Semiconductor Components Industries, LLC
- DENSO Corporation
- OmniVision Technologies, Inc.
- Sharp Corporation
- NXP Semiconductors NV
- Gentex Corporation
- Sony Semiconductor Solutions Corporation
- Canon Inc.
- Teledyne Technologies Incorporated
- STMicroelectronics International NV
- SmartSens Technology(Shanghai)Co., Ltd.
- PixArt Imaging Inc.
- Others
第11章 アナリストの全方位展望
List of Tables
- TABLE List of data sources
- TABLE Market drivers; Impact Analysis
- TABLE Market restraints; Impact Analysis
- TABLE Automotive Imaging Market: Technology Snapshot (2023)
- TABLE Segment Dashboard; Definition and Scope, by Technology
- TABLE Global Automotive Imaging Market, by Technology 2019-2032 (USD Million)
- TABLE Automotive Imaging Market: Vehicle Type Snapshot (2023)
- TABLE Segment Dashboard; Definition and Scope, by Vehicle Type
- TABLE Global Automotive Imaging Market, by Vehicle Type 2019-2032 (USD Million)
- TABLE TABLE Automotive Imaging Market: Regional snapshot (2023)
- TABLE Segment Dashboard; Definition and Scope, by Region
- TABLE Global Automotive Imaging Market, by Region 2019-2032 (USD Million)
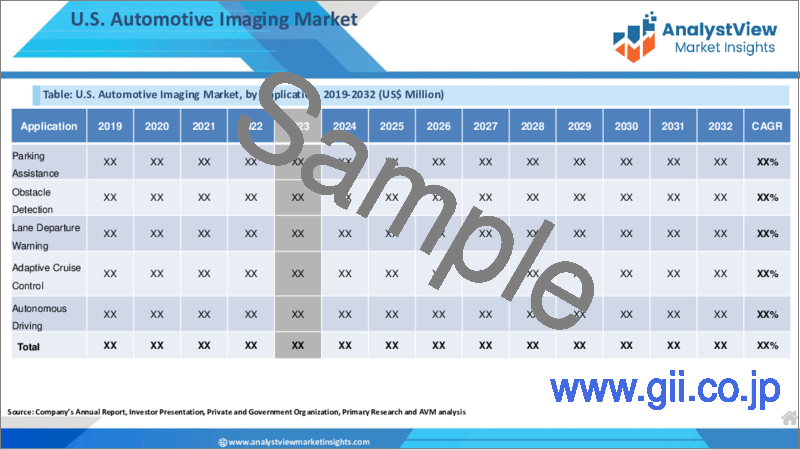
- TABLE North America Automotive Imaging Market, by Country, 2019-2032 (USD Million)
- TABLE North America Automotive Imaging Market, by Technology, 2019-2032 (USD Million)
- TABLE North America Automotive Imaging Market, by Vehicle Type, 2019-2032 (USD Million)
- TABLE Europe Automotive Imaging Market, by Country, 2019-2032 (USD Million)
- TABLE Europe Automotive Imaging Market, by Technology, 2019-2032 (USD Million)
- TABLE Europe Automotive Imaging Market, by Vehicle Type, 2019-2032 (USD Million)
- TABLE Asia Pacific Automotive Imaging Market, by Country, 2019-2032 (USD Million)
- TABLE Asia Pacific Automotive Imaging Market, by Technology, 2019-2032 (USD Million)
- TABLE Asia Pacific Automotive Imaging Market, by Vehicle Type, 2019-2032 (USD Million)
- TABLE Latin America Automotive Imaging Market, by Country, 2019-2032 (USD Million)
- TABLE Latin America Automotive Imaging Market, by Technology, 2019-2032 (USD Million)
- TABLE Latin America Automotive Imaging Market, by Vehicle Type, 2019-2032 (USD Million)
- TABLE Middle East and Africa Automotive Imaging Market, by Country, 2019-2032 (USD Million)
- TABLE Middle East and Africa Automotive Imaging Market, by Technology, 2019-2032 (USD Million)
- TABLE Middle East and Africa Automotive Imaging Market, by Vehicle Type, 2019-2032 (USD Million)
List of Figures
- FIGURE Automotive Imaging Market Segmentation
- FIGURE Market research methodology
- FIGURE Value chain analysis
- FIGURE Porter's Five Forces Analysis
- FIGURE Market Attractiveness Analysis
- FIGURE COVID-19 Impact Analysis
- FIGURE Pre & Post COVID-19 Impact Comparision Study
- FIGURE Competitive Landscape; Key company market share analysis, 2023
- FIGURE Technology segment market share analysis, 2023 & 2032
- FIGURE Technology segment market size forecast and trend analysis, 2019 to 2032 (USD Million)
- FIGURE Vehicle Type segment market share analysis, 2023 & 2032
- FIGURE Vehicle Type segment market size forecast and trend analysis, 2019 to 2032 (USD Million)
- FIGURE Regional segment market share analysis, 2023 & 2032
- FIGURE Regional segment market size forecast and trend analysis, 2019 to 2032 (USD Million)
- FIGURE North America Automotive Imaging Market share and leading players, 2023
- FIGURE Europe Automotive Imaging Market share and leading players, 2023
- FIGURE Asia Pacific Automotive Imaging Market share and leading players, 2023
- FIGURE Latin America Automotive Imaging Market share and leading players, 2023
- FIGURE Middle East and Africa Automotive Imaging Market share and leading players, 2023
- FIGURE North America market share analysis by country, 2023
- FIGURE U.S. Automotive Imaging Market size, forecast and trend analysis, 2019 to 2032 (USD Million)
- FIGURE Canada Automotive Imaging Market size, forecast and trend analysis, 2019 to 2032 (USD Million)
- FIGURE Europe Automotive Imaging Market share analysis by country, 2023
- FIGURE Germany Automotive Imaging Market size, forecast and trend analysis, 2019 to 2032 (USD Million)
- FIGURE Spain Automotive Imaging Market size, forecast and trend analysis, 2019 to 2032 (USD Million)
- FIGURE Italy Automotive Imaging Market size, forecast and trend analysis, 2019 to 2032 (USD Million)
- FIGURE France Automotive Imaging Market size, forecast and trend analysis, 2019 to 2032 (USD Million)
- FIGURE UK Automotive Imaging Market size, forecast and trend analysis, 2019 to 2032 (USD Million)
- FIGURE Russia Automotive Imaging Market size, forecast and trend analysis, 2019 to 2032 (USD Million)
- FIGURE Netherlands Automotive Imaging Market size, forecast and trend analysis, 2019 to 2032 (USD Million)
- FIGURE Sweden Automotive Imaging Market size, forecast and trend analysis, 2019 to 2032 (USD Million)
- FIGURE Poland Automotive Imaging Market size, forecast and trend analysis, 2019 to 2032 (USD Million)
- FIGURE Rest of the Europe Automotive Imaging Market size, forecast and trend analysis, 2019 to 2032 (USD Million)
- FIGURE Asia Pacific Automotive Imaging Market share analysis by country, 2023
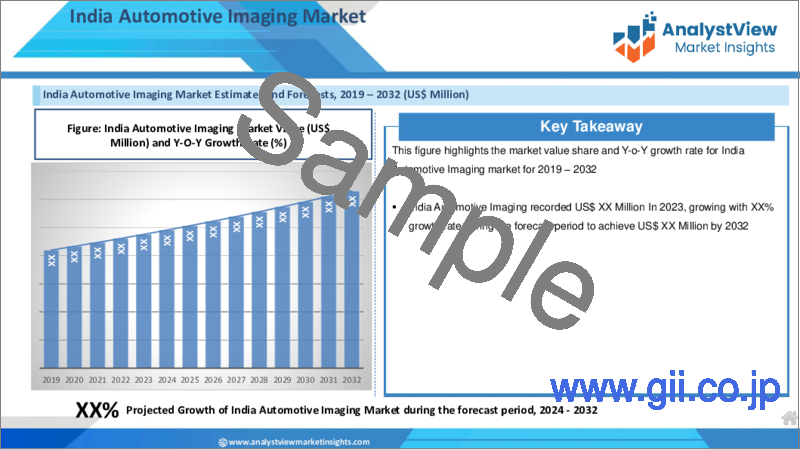
- FIGURE India Automotive Imaging Market size, forecast and trend analysis, 2019 to 2032 (USD Million)
- FIGURE China Automotive Imaging Market size, forecast and trend analysis, 2019 to 2032 (USD Million)
- FIGURE Japan Automotive Imaging Market size, forecast and trend analysis, 2019 to 2032 (USD Million)
- FIGURE South Korea Automotive Imaging Market size, forecast and trend analysis, 2019 to 2032 (USD Million)
- FIGURE Australia Automotive Imaging Market size, forecast and trend analysis, 2019 to 2032 (USD Million)
- FIGURE Thailand Automotive Imaging Market size, forecast and trend analysis, 2019 to 2032 (USD Million)
- FIGURE Indonesia Automotive Imaging Market size, forecast and trend analysis, 2019 to 2032 (USD Million)
- FIGURE Philippines Automotive Imaging Market size, forecast and trend analysis, 2019 to 2032 (USD Million)
- FIGURE Rest of APAC Automotive Imaging Market size, forecast and trend analysis, 2019 to 2032 (USD Million)
- FIGURE Latin America Automotive Imaging Market size, forecast and trend analysis, 2019 to 2032 (USD Million)
- FIGURE Latin America Automotive Imaging Market share analysis by country, 2023
- FIGURE Brazil Automotive Imaging Market size, forecast and trend analysis, 2019 to 2032 (USD Million)
- FIGURE Mexico Automotive Imaging Market size, forecast and trend analysis, 2019 to 2032 (USD Million)
- FIGURE Argentina Automotive Imaging Market size, forecast and trend analysis, 2019 to 2032 (USD Million)
- FIGURE Colombia Automotive Imaging Market size, forecast and trend analysis, 2019 to 2032 (USD Million)
- FIGURE Rest of LATAM Automotive Imaging Market size, forecast and trend analysis, 2019 to 2032 (USD Million)
- FIGURE Middle East and Africa Automotive Imaging Market size, forecast and trend analysis, 2019 to 2032 (USD Million)
- FIGURE Middle East and Africa Automotive Imaging Market share analysis by country, 2023
- FIGURE Saudi Arabia Automotive Imaging Market size, forecast and trend analysis, 2019 to 2032 (USD Million)
- FIGURE United Arab Emirates Automotive Imaging Market size, forecast and trend analysis, 2019 to 2032 (USD Million)
- FIGURE Israel Automotive Imaging Market size, forecast and trend analysis, 2019 to 2032 (USD Million)
- FIGURE Turkey Automotive Imaging Market size, forecast and trend analysis, 2019 to 2032 (USD Million)
- FIGURE Algeria Automotive Imaging Market size, forecast and trend analysis, 2019 to 2032 (USD Million)
- FIGURE Egypt Automotive Imaging Market size, forecast and trend analysis, 2019 to 2032 (USD Million)
- FIGURE Rest of MEA Automotive Imaging Market size, forecast and trend analysis, 2019 to 2032 (USD Million)
REPORT HIGHLIGHT
Automotive Imaging Market size was valued at USD 3,524.2 Million in 2023, expanding at a CAGR of 12.40% from 2024 to 2032.
The automotive imaging market refers to the segment of a company that uses image technology in automobiles for a variety of purposes, including driver assistance and safety features, to mention a few, as well as autonomous driving. This market focuses on the development of cameras, sensors, and imaging systems that may be integrated into any vehicle to improve visibility, safety, and advanced driver assistance systems. Imaging technology in the car industry aids in lane departure warning, parking assistance, pedestrian identification, and accident avoidance. As a result, businesses in the imaging solution market are focusing on developing new imaging solutions to improve the inside driving experience and make a car significantly safer.
Automotive Imaging Market- Market Dynamics
Rising Popularity of ADAS Features in Automotive
ADAS technologies include several safety and convenience features, such as adaptive cruise control, lane-keeping assist, blind-spot monitoring, and automatic emergency braking. These characteristics have been quite popular among consumers who value safety and convenience. As a result, manufacturers are rapidly incorporating ADAS into their car models, raising the demand for image sensors. One of the keys aims of ADAS is to improve road safety. Image sensors are critical to achieving these regulatory criteria. As governments and safety organizations around the world emphasize the importance of ADAS in enhancing road safety, the positive impact on the image sensor industry grows on a global scale. These reasons are projected to drive the global market for automotive image sensors.
Automotive Imaging Market- Key Insights
Our research analyst estimates that the global market will develop at a CAGR of approximately 12.40% from 2024 to 2032.
Based on Technology segmentation, the CMOS technology sector accounted for the biggest revenue share in 2023.
Based on Vehicle Type segmentation, in 2023, the passenger vehicle sector will dominate the market.
On the basis of region, Asia Pacific was the leading revenue generator in 2023
Automotive Imaging Market- Segmentation Analysis:
The Global Automotive Imaging Market is segmented on the basis of Technology, Vehicle Type, and Region.
The market is divided into two categories based on Technology: CMOS and CCD. The CMOS technology segment accounted for the greatest revenue share in 2023 and is expected to continue this trend over the forecast period. This can be ascribed to its small size, low energy consumption, and cost-effectiveness, making it a popular choice for a wide range of applications.
The market is divided into two categories based on Vehicle Type: Passenger Vehicles and Commercial Vehicles. In 2023, the passenger vehicle segment dominated the market. This can be ascribed to automakers' adoption of superior image sensor technology as a competitive difference to attract customers. Adding high-resolution cameras and advanced safety features can dramatically improve the vehicle's appeal and market competitiveness.
Automotive Imaging Market- Geographical Insights
Geographically, this market is present in North America, Latin America, Europe, Asia Pacific, and the Middle East and Africa. These zones are further split based on which countries bring business. In 2023, the Asia Pacific region had the biggest revenue share, with more than 53.0%. The growing use of electric vehicles (EVs) throughout the area, particularly in China, Japan, and South Korea, is driving up demand for automotive image sensor infrastructure, generating substantial potential for regional market competitors. Furthermore, buyers are becoming aware of the advantages of improved car safety measures. This awareness fuels demand for vehicles equipped with image-sensing technology, which is likely to drive market expansion throughout the region.
The Middle East and Africa region is expected to develop at the fastest CAGR over the forecast period. The region is notable for its thriving luxury automotive market, which fuels market expansion. High-end and luxury car manufacturers usually integrate advanced image-sensing sensors as vital components of their premium features, contributing significantly to market growth, which is likely to continue during the forecast period.
Automotive Imaging Market- Competitive Landscape:
In this very competitive landscape of the Automotive Imaging Market, multiple companies are fighting to provide innovative imaging solutions for vehicles. Players in this market include industry giants like Samsung Electronics Co., Ltd., Continental AG, Infineon Technologies AG, Semiconductor Components Industries, LLC, and DENSO Corporation. These companies are known for their sophisticated imaging technologies in surround-view cameras, night vision systems, LiDAR sensors, and other vital tools that ensure vehicle safety and boost capabilities for self-driving modes.
Recent Developments:
In March, 2023, OmniVision Technologies, Inc. has teamed with Eyeris Technologies, Inc., a global leader in car in-cabin sensing AI and sensor fusion systems. This collaboration sought to merge the OMNIVISION OAX4600 system-on-chip architecture and the OX05B1S 5-megapixel RGB-IR global shutter sensor.
SCOPE OF THE REPORT
The scope of this report covers the market by its major segments, which include as following:
GLOBAL AUTOMOTIVE IMAGING MARKET KEY PLAYERS- DETAILED COMPETITIVE INSIGHTS
Samsung Electronics Co., Ltd.
Continental AG
Infineon Technologies AG
Semiconductor Components Industries, LLC
DENSO Corporation
OmniVision Technologies, Inc.
Sharp Corporation
NXP Semiconductors N.V.
Gentex Corporation
Sony Semiconductor Solutions Corporation
Canon Inc.
Teledyne Technologies Incorporated
STMicroelectronics International N.V.
SmartSens Technology (Shanghai) Co., Ltd.
PixArt Imaging Inc.
Others
GLOBAL AUTOMOTIVE IMAGING MARKET, BY TECHNOLOGY- MARKET ANALYSIS, 2019 - 2032
- CMOS
- CCD
GLOBAL AUTOMOTIVE IMAGING MARKET, BY VEHICLE TYPE- MARKET ANALYSIS, 2019 - 2032
- Passenger Vehicles
- Commercial Vehicles
GLOBAL AUTOMOTIVE IMAGING MARKET, BY REGION- MARKET ANALYSIS, 2019 - 2032
- North America
- The U.S.
- Canada
- Europe
- Germany
- France
- Italy
- Spain
- United Kingdom
- Russia
- Netherlands
- Sweden
- Poland
- Rest of Europe
- Asia Pacific
- India
- China
- South Korea
- Japan
- Australia
- Thailand
- Indonesia
- Philippines
- Rest of APAC
- Latin America
- Brazil
- Mexico
- Argentina
- Colombia
- Rest of LATAM
- The Middle East and Africa
- Saudi Arabia
- United Arab Emirates
- Israel
- Turkey
- Algeria
- Egypt
- Rest of MEA
Table of Contents
1. Automotive Imaging Market Overview
- 1.1. Study Scope
- 1.2. Market Estimation Years
2. Executive Summary
- 2.1. Market Snippet
- 2.1.1. Automotive Imaging Market Snippet by Technology
- 2.1.2. Automotive Imaging Market Snippet by Vehicle Type
- 2.1.3. Automotive Imaging Market Snippet by Country
- 2.1.4. Automotive Imaging Market Snippet by Region
- 2.2. Competitive Insights
3. Automotive Imaging Key Market Trends
- 3.1. Automotive Imaging Market Drivers
- 3.1.1. Impact Analysis of Market Drivers
- 3.2. Automotive Imaging Market Restraints
- 3.2.1. Impact Analysis of Market Restraints
- 3.3. Automotive Imaging Market Opportunities
- 3.4. Automotive Imaging Market Future Trends
4. Automotive Imaging Industry Study
- 4.1. PEST Analysis
- 4.2. Porter's Five Forces Analysis
- 4.3. Growth Prospect Mapping
- 4.4. Regulatory Framework Analysis
5. Automotive Imaging Market: COVID-19 Impact Analysis
- 5.1. Pre-COVID-19 Impact Analysis
- 5.2. Post-COVID-19 Impact Analysis
- 5.2.1. Top Performing Segments
- 5.2.2. Marginal Growth Segments
- 5.2.3. Top Looser Segments
- 5.2.4. Marginal Loss Segments
6. Automotive Imaging Market Landscape
- 6.1. Automotive Imaging Market Share Analysis, 2023
- 6.2. Breakdown Data, by Key Manufacturer
- 6.2.1. Established Players' Analysis
- 6.2.2. Emerging Players' Analysis
7. Automotive Imaging Market - By Technology
- 7.1. Overview
- 7.1.1. Segment Share Analysis, By Technology, 2023 & 2032 (%)
- 7.1.2. CMOS
- 7.1.3. CCD
8. Automotive Imaging Market - By Vehicle Type
- 8.1. Overview
- 8.1.1. Segment Share Analysis, By Vehicle Type, 2023 & 2032 (%)
- 8.1.2. Passenger Vehicles
- 8.1.3. Commercial Vehicles
9. Automotive Imaging Market- By Geography
- 9.1. Introduction
- 9.1.1. Segment Share Analysis, By Geography, 2023 & 2032 (%)
- 9.2. North America
- 9.2.1. Overview
- 9.2.2. Automotive Imaging Key Manufacturers in North America
- 9.2.3. North America Market Size and Forecast, By Country, 2019 - 2032 (US$ Million)
- 9.2.4. North America Market Size and Forecast, By Technology, 2019 - 2032 (US$ Million)
- 9.2.5. North America Market Size and Forecast, By Vehicle Type, 2019 - 2032 (US$ Million)
- 9.2.6. U.S.
- 9.2.6.1. Overview
- 9.2.6.2. Market Analysis, Forecast, and Y-O-Y Growth Rate, 2019 - 2032, (US$ Million)
- 9.2.6.3. U.S. Market Size and Forecast, By Technology, 2019 - 2032 (US$ Million)
- 9.2.6.4. U.S. Market Size and Forecast, By Vehicle Type, 2019 - 2032 (US$ Million)
- 9.2.7. Canada
- 9.2.7.1. Overview
- 9.2.7.2. Market Analysis, Forecast, and Y-O-Y Growth Rate, 2019 - 2032, (US$ Million)
- 9.2.7.3. Canada Market Size and Forecast, By Technology, 2019 - 2032 (US$ Million)
- 9.2.7.4. Canada Market Size and Forecast, By Vehicle Type, 2019 - 2032 (US$ Million)
- 9.3. Europe
- 9.3.1. Overview
- 9.3.2. Automotive Imaging Key Manufacturers in Europe
- 9.3.3. Europe Market Size and Forecast, By Country, 2019 - 2032 (US$ Million)
- 9.3.4. Europe Market Size and Forecast, By Technology, 2019 - 2032 (US$ Million)
- 9.3.5. Europe Market Size and Forecast, By Vehicle Type, 2019 - 2032 (US$ Million)
- 9.3.6. Germany
- 9.3.6.1. Overview
- 9.3.6.2. Market Analysis, Forecast, and Y-O-Y Growth Rate, 2019 - 2032, (US$ Million)
- 9.3.6.3. Germany Market Size and Forecast, By Technology, 2019 - 2032 (US$ Million)
- 9.3.6.4. Germany Market Size and Forecast, By Vehicle Type, 2019 - 2032 (US$ Million)
- 9.3.7. Italy
- 9.3.7.1. Overview
- 9.3.7.2. Market Analysis, Forecast, and Y-O-Y Growth Rate, 2019 - 2032, (US$ Million)
- 9.3.7.3. Italy Market Size and Forecast, By Technology, 2019 - 2032 (US$ Million)
- 9.3.7.4. Italy Market Size and Forecast, By Vehicle Type, 2019 - 2032 (US$ Million)
- 9.3.8. United Kingdom
- 9.3.8.1. Overview
- 9.3.8.2. Market Analysis, Forecast, and Y-O-Y Growth Rate, 2019 - 2032, (US$ Million)
- 9.3.8.3. United Kingdom Market Size and Forecast, By Technology, 2019 - 2032 (US$ Million)
- 9.3.8.4. United Kingdom Market Size and Forecast, By Vehicle Type, 2019 - 2032 (US$ Million)
- 9.3.9. France
- 9.3.9.1. Overview
- 9.3.9.2. Market Analysis, Forecast, and Y-O-Y Growth Rate, 2019 - 2032, (US$ Million)
- 9.3.9.3. France Market Size and Forecast, By Technology, 2019 - 2032 (US$ Million)
- 9.3.9.4. France Market Size and Forecast, By Vehicle Type, 2019 - 2032 (US$ Million)
- 9.3.10. Russia
- 9.3.10.1. Market Analysis, Forecast, and Y-O-Y Growth Rate, 2019 - 2032, (US$ Million)
- 9.3.10.2. Russia Market Size and Forecast, By Technology, 2019 - 2032 (US$ Million)
- 9.3.10.3. Russia Market Size and Forecast, By Vehicle Type, 2019 - 2032 (US$ Million)
- 9.3.11. Netherlands
- 9.3.11.1. Market Analysis, Forecast, and Y-O-Y Growth Rate, 2019 - 2032, (US$ Million)
- 9.3.11.2. Netherlands Market Size and Forecast, By Technology, 2019 - 2032 (US$ Million)
- 9.3.11.3. Netherlands Market Size and Forecast, By Vehicle Type, 2019 - 2032 (US$ Million)
- 9.3.12. Sweden
- 9.3.12.1. Market Analysis, Forecast, and Y-O-Y Growth Rate, 2019 - 2032, (US$ Million)
- 9.3.12.2. Sweden Market Size and Forecast, By Technology, 2019 - 2032 (US$ Million)
- 9.3.12.3. Sweden Market Size and Forecast, By Vehicle Type, 2019 - 2032 (US$ Million)
- 9.3.13. Poland
- 9.3.13.1. Market Analysis, Forecast, and Y-O-Y Growth Rate, 2019 - 2032, (US$ Million)
- 9.3.13.2. Poland Market Size and Forecast, By Technology, 2019 - 2032 (US$ Million)
- 9.3.13.3. Poland Market Size and Forecast, By Vehicle Type, 2019 - 2032 (US$ Million)
- 9.3.14. Rest of Europe
- 9.3.14.1. Overview
- 9.3.14.2. Market Analysis, Forecast, and Y-O-Y Growth Rate, 2019 - 2032, (US$ Million)
- 9.3.14.3. Rest of the Europe Market Size and Forecast, By Technology, 2019 - 2032 (US$ Million)
- 9.3.14.4. Rest of the Europe Market Size and Forecast, By Vehicle Type, 2019 - 2032 (US$ Million)
- 9.4. Asia Pacific (APAC)
- 9.4.1. Overview
- 9.4.2. Automotive Imaging Key Manufacturers in Asia Pacific
- 9.4.3. Asia Pacific Market Size and Forecast, By Country, 2019 - 2032 (US$ Million)
- 9.4.4. Asia Pacific Market Size and Forecast, By Technology, 2019 - 2032 (US$ Million)
- 9.4.5. Asia Pacific Market Size and Forecast, By Vehicle Type, 2019 - 2032 (US$ Million)
- 9.4.6. India
- 9.4.6.1. Overview
- 9.4.6.2. Market Analysis, Forecast, and Y-O-Y Growth Rate, 2019 - 2032, (US$ Million)
- 9.4.6.3. India Market Size and Forecast, By Technology, 2019 - 2032 (US$ Million)
- 9.4.6.4. India Market Size and Forecast, By Vehicle Type, 2019 - 2032 (US$ Million)
- 9.4.7. China
- 9.4.7.1. Overview
- 9.4.7.2. Market Analysis, Forecast, and Y-O-Y Growth Rate, 2019 - 2032, (US$ Million)
- 9.4.7.3. China Market Size and Forecast, By Technology, 2019 - 2032 (US$ Million)
- 9.4.7.4. China Market Size and Forecast, By Vehicle Type, 2019 - 2032 (US$ Million)
- 9.4.8. Japan
- 9.4.8.1. Overview
- 9.4.8.2. Market Analysis, Forecast, and Y-O-Y Growth Rate, 2019 - 2032, (US$ Million)
- 9.4.8.3. Japan Market Size and Forecast, By Technology, 2019 - 2032 (US$ Million)
- 9.4.8.4. Japan Market Size and Forecast, By Vehicle Type, 2019 - 2032 (US$ Million)
- 9.4.9. South Korea
- 9.4.9.1. Overview
- 9.4.9.2. Market Analysis, Forecast, and Y-O-Y Growth Rate, 2019 - 2032, (US$ Million)
- 9.4.9.3. South Korea Market Size and Forecast, By Technology, 2019 - 2032 (US$ Million)
- 9.4.9.4. South Korea Market Size and Forecast, By Vehicle Type, 2019 - 2032 (US$ Million)
- 9.4.10. Australia
- 9.4.10.1. Overview
- 9.4.10.2. Market Analysis, Forecast, and Y-O-Y Growth Rate, 2019 - 2032, (US$ Million)
- 9.4.10.3. Australia Market Size and Forecast, By Technology, 2019 - 2032 (US$ Million)
- 9.4.10.4. Australia Market Size and Forecast, By Vehicle Type, 2019 - 2032 (US$ Million)
- 9.4.11. Thailand
- 9.4.11.1. Overview
- 9.4.11.2. Market Analysis, Forecast, and Y-O-Y Growth Rate, 2019 - 2032, (US$ Million)
- 9.4.11.3. Thailand Market Size and Forecast, By Technology, 2019 - 2032 (US$ Million)
- 9.4.11.4. Thailand Market Size and Forecast, By Vehicle Type, 2019 - 2032 (US$ Million)
- 9.4.12. Indonesia
- 9.4.12.1. Overview
- 9.4.12.2. Market Analysis, Forecast, and Y-O-Y Growth Rate, 2019 - 2032, (US$ Million)
- 9.4.12.3. Indonesia Market Size and Forecast, By Technology, 2019 - 2032 (US$ Million)
- 9.4.12.4. Indonesia Market Size and Forecast, By Vehicle Type, 2019 - 2032 (US$ Million)
- 9.4.13. Philippines
- 9.4.13.1. Overview
- 9.4.13.2. Market Analysis, Forecast, and Y-O-Y Growth Rate, 2019 - 2032, (US$ Million)
- 9.4.13.3. Philippines Market Size and Forecast, By Technology, 2019 - 2032 (US$ Million)
- 9.4.13.4. Philippines Market Size and Forecast, By Vehicle Type, 2019 - 2032 (US$ Million)
- 9.4.14. Rest of APAC
- 9.4.14.1. Overview
- 9.4.14.2. Market Analysis, Forecast, and Y-O-Y Growth Rate, 2019 - 2032, (US$ Million)
- 9.4.14.3. Rest of APAC Market Size and Forecast, By Technology, 2019 - 2032 (US$ Million)
- 9.4.14.4. Rest of APAC Market Size and Forecast, By Vehicle Type, 2019 - 2032 (US$ Million)
- 9.5. Latin America
- 9.5.1. Overview
- 9.5.2. Automotive Imaging Key Manufacturers in Latin America
- 9.5.3. Latin America Market Size and Forecast, By Country, 2019 - 2032 (US$ Million)
- 9.5.4. Latin America Market Size and Forecast, By Technology, 2019 - 2032 (US$ Million)
- 9.5.5. Latin America Market Size and Forecast, By Vehicle Type, 2019 - 2032 (US$ Million)
- 9.5.6. Brazil
- 9.5.6.1. Overview
- 9.5.6.2. Market Analysis, Forecast, and Y-O-Y Growth Rate, 2019 - 2032, (US$ Million)
- 9.5.6.3. Brazil Market Size and Forecast, By Technology, 2019 - 2032 (US$ Million)
- 9.5.6.4. Brazil Market Size and Forecast, By Vehicle Type, 2019 - 2032 (US$ Million)
- 9.5.7. Mexico
- 9.5.7.1. Overview
- 9.5.7.2. Market Analysis, Forecast, and Y-O-Y Growth Rate, 2019 - 2032, (US$ Million)
- 9.5.7.3. Mexico Market Size and Forecast, By Technology, 2019 - 2032 (US$ Million)
- 9.5.7.4. Mexico Market Size and Forecast, By Vehicle Type, 2019 - 2032 (US$ Million)
- 9.5.8. Argentina
- 9.5.8.1. Overview
- 9.5.8.2. Market Analysis, Forecast, and Y-O-Y Growth Rate, 2019 - 2032, (US$ Million)
- 9.5.8.3. Argentina Market Size and Forecast, By Technology, 2019 - 2032 (US$ Million)
- 9.5.8.4. Argentina Market Size and Forecast, By Vehicle Type, 2019 - 2032 (US$ Million)
- 9.5.9. Colombia
- 9.5.9.1. Overview
- 9.5.9.2. Market Analysis, Forecast, and Y-O-Y Growth Rate, 2019 - 2032, (US$ Million)
- 9.5.9.3. Colombia Market Size and Forecast, By Technology, 2019 - 2032 (US$ Million)
- 9.5.9.4. Colombia Market Size and Forecast, By Vehicle Type, 2019 - 2032 (US$ Million)
- 9.5.10. Rest of LATAM
- 9.5.10.1. Overview
- 9.5.10.2. Market Analysis, Forecast, and Y-O-Y Growth Rate, 2019 - 2032, (US$ Million)
- 9.5.10.3. Rest of LATAM Market Size and Forecast, By Technology, 2019 - 2032 (US$ Million)
- 9.5.10.4. Rest of LATAM Market Size and Forecast, By Vehicle Type, 2019 - 2032 (US$ Million)
- 9.6. Middle East and Africa
- 9.6.1. Overview
- 9.6.2. Automotive Imaging Key Manufacturers in Middle East and Africa
- 9.6.3. Middle East and Africa Market Size and Forecast, By Country, 2019 - 2032 (US$ Million)
- 9.6.4. Middle East and Africa Market Size and Forecast, By Technology, 2019 - 2032 (US$ Million)
- 9.6.5. Middle East and Africa Market Size and Forecast, By Vehicle Type, 2019 - 2032 (US$ Million)
- 9.6.6. Saudi Arabia
- 9.6.6.1. Overview
- 9.6.6.2. Market Analysis, Forecast, and Y-O-Y Growth Rate, 2019 - 2032, (US$ Million)
- 9.6.6.3. Saudi Arabia Market Size and Forecast, By Technology, 2019 - 2032 (US$ Million)
- 9.6.6.4. Saudi Arabia Market Size and Forecast, By Vehicle Type, 2019 - 2032 (US$ Million)
- 9.6.7. United Arab Emirates
- 9.6.7.1. Overview
- 9.6.7.2. Market Analysis, Forecast, and Y-O-Y Growth Rate, 2019 - 2032, (US$ Million)
- 9.6.7.3. United Arab Emirates Market Size and Forecast, By Technology, 2019 - 2032 (US$ Million)
- 9.6.7.4. United Arab Emirates Market Size and Forecast, By Vehicle Type, 2019 - 2032 (US$ Million)
- 9.6.8. Israel
- 9.6.8.1. Overview
- 9.6.8.2. Market Analysis, Forecast, and Y-O-Y Growth Rate, 2019 - 2032, (US$ Million)
- 9.6.8.3. Israel Market Size and Forecast, By Technology, 2019 - 2032 (US$ Million)
- 9.6.8.4. Israel Market Size and Forecast, By Vehicle Type, 2019 - 2032 (US$ Million)
- 9.6.9. Turkey
- 9.6.9.1. Overview
- 9.6.9.2. Market Analysis, Forecast, and Y-O-Y Growth Rate, 2019 - 2032, (US$ Million)
- 9.6.9.3. Turkey Market Size and Forecast, By Technology, 2019 - 2032 (US$ Million)
- 9.6.9.4. Turkey Market Size and Forecast, By Vehicle Type, 2019 - 2032 (US$ Million)
- 9.6.10. Algeria
- 9.6.10.1. Overview
- 9.6.10.2. Market Analysis, Forecast, and Y-O-Y Growth Rate, 2019 - 2032, (US$ Million)
- 9.6.10.3. Algeria Market Size and Forecast, By Technology, 2019 - 2032 (US$ Million)
- 9.6.10.4. Algeria Market Size and Forecast, By Vehicle Type, 2019 - 2032 (US$ Million)
- 9.6.11. Egypt
- 9.6.11.1. Overview
- 9.6.11.2. Market Analysis, Forecast, and Y-O-Y Growth Rate, 2019 - 2032, (US$ Million)
- 9.6.11.3. Egypt Market Size and Forecast, By Technology, 2019 - 2032 (US$ Million)
- 9.6.11.4. Egypt Market Size and Forecast, By Vehicle Type, 2019 - 2032 (US$ Million)
- 9.6.12. Rest of MEA
- 9.6.12.1. Overview
- 9.6.12.2. Market Analysis, Forecast, and Y-O-Y Growth Rate, 2019 - 2032, (US$ Million)
- 9.6.12.3. Rest of MEA Market Size and Forecast, By Technology, 2019 - 2032 (US$ Million)
- 9.6.12.4. Rest of MEA Market Size and Forecast, By Vehicle Type, 2019 - 2032 (US$ Million)
10. Key Vendor Analysis- Automotive Imaging Industry
- 10.1. Competitive Dashboard
- 10.2. Company Profiles
- 10.2.1. Samsung Electronics Co., Ltd.
- 10.2.2. Continental AG
- 10.2.3. Infineon Technologies AG
- 10.2.4. Semiconductor Components Industries, LLC
- 10.2.5. DENSO Corporation
- 10.2.6. OmniVision Technologies, Inc.
- 10.2.7. Sharp Corporation
- 10.2.8. NXP Semiconductors N.V.
- 10.2.9. Gentex Corporation
- 10.2.10. Sony Semiconductor Solutions Corporation
- 10.2.11. Canon Inc.
- 10.2.12. Teledyne Technologies Incorporated
- 10.2.13. STMicroelectronics International N.V.
- 10.2.14. SmartSens Technology (Shanghai) Co., Ltd.
- 10.2.15. PixArt Imaging Inc.
- 10.2.16. Others
11. 360 Degree Analyst View
12. Appendix
- 12.1. Research Methodology
- 12.2. References
- 12.3. Abbreviations
- 12.4. Disclaimer
- 12.5. Contact Us

