
|
市場調査レポート
商品コード
1446408
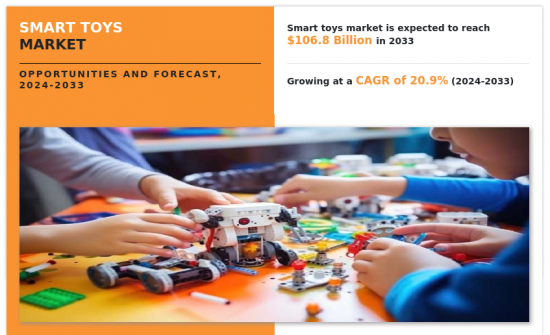
スマート玩具市場:タイプ別、技術別、流通チャネル別:世界の機会分析と産業予測、2024年~2033年Smart Toys Market By Type (Robots, Interactive Games, Educational Robots), By Technology (Wi Fi, Bluetooth, RFID or NFC, Others), By Distribution Channel (Offline, Online): Global Opportunity Analysis and Industry Forecast, 2024-2033 |
||||||
|
|||||||

| スマート玩具市場:タイプ別、技術別、流通チャネル別:世界の機会分析と産業予測、2024年~2033年 |
|
出版日: 2024年01月30日
発行: Allied Market Research
ページ情報: 英文 300 Pages
納期: 2~3営業日
|

- 全表示
- 概要
- 図表
- 目次
スマート玩具市場は、米国、カナダ、ドイツ、英国、フランスなどの新興経済諸国において、過去10年間における技術ベースの製品に対する文化的受容の高まりにより、大きな成長を遂げてきました。
欧州や北米などの先進地域の消費者は、一般的に様々な面で技術的に進歩した製品を好みます。先進地域ではデジタルリテラシーが高く、技術に精通した親が多いため、スマート玩具の需要が高まっています。全米教育統計センターによると、"2021年、家庭でコンピューターを使ってインターネットに接続している3歳から18歳の割合は、両親が学士以上の学位を取得している人の割合が最も高く(98%)、両親が高校卒業未満の資格しか取得していない人の割合は最も低かった(78%)"。さらに、ブラジル、インド、中国などの新興経済諸国では、従来の玩具に対するスマート玩具の利点や優位性に関する消費者の意識が高まっており、当面のスマート玩具の需要を促進すると予想されます。さらに、可処分所得の増加と、オフラインおよびオンライン販売チャネルが世界中に普及していることによるスマート玩具の容易な入手が、スマート玩具市場の成長を積極的に促進しています。
しかし、スマート玩具にはいくつかの課題があり、スマート玩具市場の成長を妨げる可能性があります。2023年11月、米国で11歳の少女がオンラインゲーム「ロボロックス」をプレイ中に出会った男に誘拐されました。その後、彼女は自宅から約135マイル離れた場所で発見されました。マイク、追跡装置、カメラが取り付けられた玩具は、子供たちにサイバー脅威をもたらします。したがって、デジタル技術に関連したサイバー脅威の増加は、世界中のスマート玩具の需要に悪影響を及ぼす可能性があります。
しかし、安全・安心に対するメーカーの関心の高まりや、玩具やデジタル機器の安全基準に関する政府当局の規制は、スマート玩具市場にプラスの影響を与えると予想されます。さらに、主要な市場プレーヤーによって実施された新製品の発売、買収、事業拡大などの開発戦略は、今後数年間の市場の成長を促進すると予想されます。例えば、2022年4月、LeapFrog Enterprises, Inc.はScout and Violet plush palsを発売し、子供たちに楽しい学習体験を提供する創造的なタッチセンシティブ玩具を提供しました。2022年7月、Smart Toys and GamesはThe Happy Puzzle Companyを買収し、Happy Puzzleの製品ポートフォリオをSmart Toys and Gamesの成長ポートフォリオに統合しました。この買収は、Smart Toys and Gamesのポートフォリオと販売網を強化することを目的としています。
スマート玩具市場は、タイプ、技術、流通チャネル、地域によって区分されます。タイプ別では、スマート玩具市場はロボット、インタラクティブゲーム、教育ロボットに分類されます。技術ベースでは、市場はWi-Fi、Bluetooth、RFIDまたはNFC、その他に分けられます。流通チャネル別では、市場はオフラインとオンラインに二分されます。地域別では、市場は北米(米国、カナダ、メキシコ)、欧州(ドイツ、フランス、英国、イタリア、スペイン、その他欧州地域)、アジア太平洋地域(中国、日本、インド、韓国、オーストラリア、その他アジア太平洋地域)、アジア太平洋地域(ブラジル、南アフリカ、オーストラリア、その他アジア太平洋地域)、アラブ首長国連邦(UAE)、その他アジア太平洋地域に分析されます。
利害関係者にとっての主なメリット
- 当レポートでは、2023年から2033年までのスマート玩具市場分析の市場セグメント、現在の動向、推定・動向分析、ダイナミクスを定量的に分析し、スマート玩具市場の有力な機会を特定します。
- 市場促進要因、市場抑制要因、市場機会に関連する情報とともに市場調査を提供します。
- ポーターのファイブフォース分析では、利害関係者が利益重視のビジネス決定を下し、サプライヤーとバイヤーのネットワークを強化できるように、バイヤーとサプライヤーの潜在力を強調します。
- スマート玩具の市場セグメンテーションの詳細な分析は、市場機会を決定するのに役立ちます。
- 各地域の主要国は、世界市場への収益貢献度に応じてマッピングされています。
- 市場プレイヤーのポジショニングは、ベンチマーキングを容易にし、市場プレイヤーの現在のポジションの明確な理解を提供します。
- 本レポートには、地域および世界のスマート玩具市場動向、主要企業、市場セグメント、応用分野、市場成長戦略の分析が含まれています。
本レポートで可能なカスタマイズ(追加費用とスケジュールがあります。)
- 消費者の購買行動分析
- 消費者の平均支出
- ペインポイント分析
- クライアントの関心に応じた企業プロファイルの追加
- 国別・地域別追加分析-市場規模と予測
- クリスクロスセグメント分析-市場規模と予測
- 企業プロファイルの拡張リスト
- 過去の市場データ
- 主要プレーヤーの詳細(所在地、連絡先、サプライヤー/ベンダーネットワークなどを含む、エクセル形式)
- SWOT分析
目次
第1章 イントロダクション
第2章 エグゼクティブサマリー
第3章 市場概要
- 市場の定義と範囲
- 主な調査結果
- 影響要因
- 主な投資機会
- ポーターのファイブフォース分析
- 市場力学
- 促進要因
- 抑制要因
- 機会
- 平均販売価格
第4章 スマート玩具市場:タイプ別
- 概要
- ロボット
- インタラクティブゲーム
- 教育用ロボット
第5章 スマート玩具市場:技術別
- 概要
- Wi Fi
- Bluetooth
- RFIDまたはNFC
- その他
第6章 スマート玩具市場:流通チャネル別
- 概要
- オフライン
- オンライン
第7章 スマートトイ市場:地域別
- 概要
- 北米
- 米国
- カナダ
- メキシコ
- 欧州
- ドイツ
- フランス
- 英国
- イタリア
- スペイン
- その他
- アジア太平洋
- 中国
- インド
- 日本
- オーストラリア
- 韓国
- その他
- ラテンアメリカ・中東・アフリカ
- ブラジル
- 南アフリカ
- サウジアラビア
- アラブ首長国連邦
- その他
第8章 競争情勢
- イントロダクション
- 主要成功戦略
- 主要10社の製品マッピング
- 競合ダッシュボード
- 競合ヒートマップ
- 主要企業のポジショニング、2023年
第9章 企業プロファイル
- The Lego Group
- hasbro inc
- K'NEX Industries, Inc.
- Mattel, Inc.
- JAKKS Pacific Inc.
- WowWee Group Ltd.
- Anki, Inc.
- Sphero Inc.
- littleBits Electronics, Inc.
- UBTECH Robotics Corporation
LIST OF TABLES
- TABLE 01. GLOBAL SMART TOYS MARKET, BY TYPE, 2023-2033 ($MILLION)
- TABLE 02. SMART TOYS MARKET FOR ROBOTS, BY REGION, 2023-2033 ($MILLION)
- TABLE 03. SMART TOYS MARKET FOR INTERACTIVE GAMES, BY REGION, 2023-2033 ($MILLION)
- TABLE 04. SMART TOYS MARKET FOR EDUCATIONAL ROBOTS, BY REGION, 2023-2033 ($MILLION)
- TABLE 05. GLOBAL SMART TOYS MARKET, BY TECHNOLOGY, 2023-2033 ($MILLION)
- TABLE 06. SMART TOYS MARKET FOR WI FI, BY REGION, 2023-2033 ($MILLION)
- TABLE 07. SMART TOYS MARKET FOR BLUETOOTH, BY REGION, 2023-2033 ($MILLION)
- TABLE 08. SMART TOYS MARKET FOR RFID OR NFC, BY REGION, 2023-2033 ($MILLION)
- TABLE 09. SMART TOYS MARKET FOR OTHERS, BY REGION, 2023-2033 ($MILLION)
- TABLE 10. GLOBAL SMART TOYS MARKET, BY DISTRIBUTION CHANNEL, 2023-2033 ($MILLION)
- TABLE 11. SMART TOYS MARKET FOR OFFLINE, BY REGION, 2023-2033 ($MILLION)
- TABLE 12. SMART TOYS MARKET FOR ONLINE, BY REGION, 2023-2033 ($MILLION)
- TABLE 13. SMART TOYS MARKET, BY REGION, 2023-2033 ($MILLION)
- TABLE 14. NORTH AMERICA SMART TOYS MARKET, BY TYPE, 2023-2033 ($MILLION)
- TABLE 15. NORTH AMERICA SMART TOYS MARKET, BY TECHNOLOGY, 2023-2033 ($MILLION)
- TABLE 16. NORTH AMERICA SMART TOYS MARKET, BY DISTRIBUTION CHANNEL, 2023-2033 ($MILLION)
- TABLE 17. NORTH AMERICA SMART TOYS MARKET, BY COUNTRY, 2023-2033 ($MILLION)
- TABLE 18. U.S. SMART TOYS MARKET, BY TYPE, 2023-2033 ($MILLION)
- TABLE 19. U.S. SMART TOYS MARKET, BY TECHNOLOGY, 2023-2033 ($MILLION)
- TABLE 20. U.S. SMART TOYS MARKET, BY DISTRIBUTION CHANNEL, 2023-2033 ($MILLION)
- TABLE 21. CANADA SMART TOYS MARKET, BY TYPE, 2023-2033 ($MILLION)
- TABLE 22. CANADA SMART TOYS MARKET, BY TECHNOLOGY, 2023-2033 ($MILLION)
- TABLE 23. CANADA SMART TOYS MARKET, BY DISTRIBUTION CHANNEL, 2023-2033 ($MILLION)
- TABLE 24. MEXICO SMART TOYS MARKET, BY TYPE, 2023-2033 ($MILLION)
- TABLE 25. MEXICO SMART TOYS MARKET, BY TECHNOLOGY, 2023-2033 ($MILLION)
- TABLE 26. MEXICO SMART TOYS MARKET, BY DISTRIBUTION CHANNEL, 2023-2033 ($MILLION)
- TABLE 27. EUROPE SMART TOYS MARKET, BY TYPE, 2023-2033 ($MILLION)
- TABLE 28. EUROPE SMART TOYS MARKET, BY TECHNOLOGY, 2023-2033 ($MILLION)
- TABLE 29. EUROPE SMART TOYS MARKET, BY DISTRIBUTION CHANNEL, 2023-2033 ($MILLION)
- TABLE 30. EUROPE SMART TOYS MARKET, BY COUNTRY, 2023-2033 ($MILLION)
- TABLE 31. GERMANY SMART TOYS MARKET, BY TYPE, 2023-2033 ($MILLION)
- TABLE 32. GERMANY SMART TOYS MARKET, BY TECHNOLOGY, 2023-2033 ($MILLION)
- TABLE 33. GERMANY SMART TOYS MARKET, BY DISTRIBUTION CHANNEL, 2023-2033 ($MILLION)
- TABLE 34. FRANCE SMART TOYS MARKET, BY TYPE, 2023-2033 ($MILLION)
- TABLE 35. FRANCE SMART TOYS MARKET, BY TECHNOLOGY, 2023-2033 ($MILLION)
- TABLE 36. FRANCE SMART TOYS MARKET, BY DISTRIBUTION CHANNEL, 2023-2033 ($MILLION)
- TABLE 37. UK SMART TOYS MARKET, BY TYPE, 2023-2033 ($MILLION)
- TABLE 38. UK SMART TOYS MARKET, BY TECHNOLOGY, 2023-2033 ($MILLION)
- TABLE 39. UK SMART TOYS MARKET, BY DISTRIBUTION CHANNEL, 2023-2033 ($MILLION)
- TABLE 40. ITALY SMART TOYS MARKET, BY TYPE, 2023-2033 ($MILLION)
- TABLE 41. ITALY SMART TOYS MARKET, BY TECHNOLOGY, 2023-2033 ($MILLION)
- TABLE 42. ITALY SMART TOYS MARKET, BY DISTRIBUTION CHANNEL, 2023-2033 ($MILLION)
- TABLE 43. SPAIN SMART TOYS MARKET, BY TYPE, 2023-2033 ($MILLION)
- TABLE 44. SPAIN SMART TOYS MARKET, BY TECHNOLOGY, 2023-2033 ($MILLION)
- TABLE 45. SPAIN SMART TOYS MARKET, BY DISTRIBUTION CHANNEL, 2023-2033 ($MILLION)
- TABLE 46. REST OF EUROPE SMART TOYS MARKET, BY TYPE, 2023-2033 ($MILLION)
- TABLE 47. REST OF EUROPE SMART TOYS MARKET, BY TECHNOLOGY, 2023-2033 ($MILLION)
- TABLE 48. REST OF EUROPE SMART TOYS MARKET, BY DISTRIBUTION CHANNEL, 2023-2033 ($MILLION)
- TABLE 49. ASIA-PACIFIC SMART TOYS MARKET, BY TYPE, 2023-2033 ($MILLION)
- TABLE 50. ASIA-PACIFIC SMART TOYS MARKET, BY TECHNOLOGY, 2023-2033 ($MILLION)
- TABLE 51. ASIA-PACIFIC SMART TOYS MARKET, BY DISTRIBUTION CHANNEL, 2023-2033 ($MILLION)
- TABLE 52. ASIA-PACIFIC SMART TOYS MARKET, BY COUNTRY, 2023-2033 ($MILLION)
- TABLE 53. CHINA SMART TOYS MARKET, BY TYPE, 2023-2033 ($MILLION)
- TABLE 54. CHINA SMART TOYS MARKET, BY TECHNOLOGY, 2023-2033 ($MILLION)
- TABLE 55. CHINA SMART TOYS MARKET, BY DISTRIBUTION CHANNEL, 2023-2033 ($MILLION)
- TABLE 56. INDIA SMART TOYS MARKET, BY TYPE, 2023-2033 ($MILLION)
- TABLE 57. INDIA SMART TOYS MARKET, BY TECHNOLOGY, 2023-2033 ($MILLION)
- TABLE 58. INDIA SMART TOYS MARKET, BY DISTRIBUTION CHANNEL, 2023-2033 ($MILLION)
- TABLE 59. JAPAN SMART TOYS MARKET, BY TYPE, 2023-2033 ($MILLION)
- TABLE 60. JAPAN SMART TOYS MARKET, BY TECHNOLOGY, 2023-2033 ($MILLION)
- TABLE 61. JAPAN SMART TOYS MARKET, BY DISTRIBUTION CHANNEL, 2023-2033 ($MILLION)
- TABLE 62. AUSTRALIA SMART TOYS MARKET, BY TYPE, 2023-2033 ($MILLION)
- TABLE 63. AUSTRALIA SMART TOYS MARKET, BY TECHNOLOGY, 2023-2033 ($MILLION)
- TABLE 64. AUSTRALIA SMART TOYS MARKET, BY DISTRIBUTION CHANNEL, 2023-2033 ($MILLION)
- TABLE 65. SOUTH KOREA SMART TOYS MARKET, BY TYPE, 2023-2033 ($MILLION)
- TABLE 66. SOUTH KOREA SMART TOYS MARKET, BY TECHNOLOGY, 2023-2033 ($MILLION)
- TABLE 67. SOUTH KOREA SMART TOYS MARKET, BY DISTRIBUTION CHANNEL, 2023-2033 ($MILLION)
- TABLE 68. REST OF ASIA-PACIFIC SMART TOYS MARKET, BY TYPE, 2023-2033 ($MILLION)
- TABLE 69. REST OF ASIA-PACIFIC SMART TOYS MARKET, BY TECHNOLOGY, 2023-2033 ($MILLION)
- TABLE 70. REST OF ASIA-PACIFIC SMART TOYS MARKET, BY DISTRIBUTION CHANNEL, 2023-2033 ($MILLION)
- TABLE 71. LAMEA SMART TOYS MARKET, BY TYPE, 2023-2033 ($MILLION)
- TABLE 72. LAMEA SMART TOYS MARKET, BY TECHNOLOGY, 2023-2033 ($MILLION)
- TABLE 73. LAMEA SMART TOYS MARKET, BY DISTRIBUTION CHANNEL, 2023-2033 ($MILLION)
- TABLE 74. LAMEA SMART TOYS MARKET, BY COUNTRY, 2023-2033 ($MILLION)
- TABLE 75. BRAZIL SMART TOYS MARKET, BY TYPE, 2023-2033 ($MILLION)
- TABLE 76. BRAZIL SMART TOYS MARKET, BY TECHNOLOGY, 2023-2033 ($MILLION)
- TABLE 77. BRAZIL SMART TOYS MARKET, BY DISTRIBUTION CHANNEL, 2023-2033 ($MILLION)
- TABLE 78. SOUTH AFRICA SMART TOYS MARKET, BY TYPE, 2023-2033 ($MILLION)
- TABLE 79. SOUTH AFRICA SMART TOYS MARKET, BY TECHNOLOGY, 2023-2033 ($MILLION)
- TABLE 80. SOUTH AFRICA SMART TOYS MARKET, BY DISTRIBUTION CHANNEL, 2023-2033 ($MILLION)
- TABLE 81. SAUDI ARABIA SMART TOYS MARKET, BY TYPE, 2023-2033 ($MILLION)
- TABLE 82. SAUDI ARABIA SMART TOYS MARKET, BY TECHNOLOGY, 2023-2033 ($MILLION)
- TABLE 83. SAUDI ARABIA SMART TOYS MARKET, BY DISTRIBUTION CHANNEL, 2023-2033 ($MILLION)
- TABLE 84. UNITED ARAB EMIRATES SMART TOYS MARKET, BY TYPE, 2023-2033 ($MILLION)
- TABLE 85. UNITED ARAB EMIRATES SMART TOYS MARKET, BY TECHNOLOGY, 2023-2033 ($MILLION)
- TABLE 86. UNITED ARAB EMIRATES SMART TOYS MARKET, BY DISTRIBUTION CHANNEL, 2023-2033 ($MILLION)
- TABLE 87. REST OF LAMEA SMART TOYS MARKET, BY TYPE, 2023-2033 ($MILLION)
- TABLE 88. REST OF LAMEA SMART TOYS MARKET, BY TECHNOLOGY, 2023-2033 ($MILLION)
- TABLE 89. REST OF LAMEA SMART TOYS MARKET, BY DISTRIBUTION CHANNEL, 2023-2033 ($MILLION)
- TABLE 90. THE LEGO GROUP: KEY EXECUTIVES
- TABLE 91. THE LEGO GROUP: COMPANY SNAPSHOT
- TABLE 92. THE LEGO GROUP: PRODUCT SEGMENTS
- TABLE 93. THE LEGO GROUP: SERVICE SEGMENTS
- TABLE 94. THE LEGO GROUP: PRODUCT PORTFOLIO
- TABLE 95. THE LEGO GROUP: KEY STRATERGIES
- TABLE 96. HASBRO INC: KEY EXECUTIVES
- TABLE 97. HASBRO INC: COMPANY SNAPSHOT
- TABLE 98. HASBRO INC: PRODUCT SEGMENTS
- TABLE 99. HASBRO INC: SERVICE SEGMENTS
- TABLE 100. HASBRO INC: PRODUCT PORTFOLIO
- TABLE 101. HASBRO INC: KEY STRATERGIES
- TABLE 102. K'NEX INDUSTRIES, INC.: KEY EXECUTIVES
- TABLE 103. K'NEX INDUSTRIES, INC.: COMPANY SNAPSHOT
- TABLE 104. K'NEX INDUSTRIES, INC.: PRODUCT SEGMENTS
- TABLE 105. K'NEX INDUSTRIES, INC.: SERVICE SEGMENTS
- TABLE 106. K'NEX INDUSTRIES, INC.: PRODUCT PORTFOLIO
- TABLE 107. K'NEX INDUSTRIES, INC.: KEY STRATERGIES
- TABLE 108. MATTEL, INC.: KEY EXECUTIVES
- TABLE 109. MATTEL, INC.: COMPANY SNAPSHOT
- TABLE 110. MATTEL, INC.: PRODUCT SEGMENTS
- TABLE 111. MATTEL, INC.: SERVICE SEGMENTS
- TABLE 112. MATTEL, INC.: PRODUCT PORTFOLIO
- TABLE 113. MATTEL, INC.: KEY STRATERGIES
- TABLE 114. JAKKS PACIFIC INC.: KEY EXECUTIVES
- TABLE 115. JAKKS PACIFIC INC.: COMPANY SNAPSHOT
- TABLE 116. JAKKS PACIFIC INC.: PRODUCT SEGMENTS
- TABLE 117. JAKKS PACIFIC INC.: SERVICE SEGMENTS
- TABLE 118. JAKKS PACIFIC INC.: PRODUCT PORTFOLIO
- TABLE 119. JAKKS PACIFIC INC.: KEY STRATERGIES
- TABLE 120. WOWWEE GROUP LTD.: KEY EXECUTIVES
- TABLE 121. WOWWEE GROUP LTD.: COMPANY SNAPSHOT
- TABLE 122. WOWWEE GROUP LTD.: PRODUCT SEGMENTS
- TABLE 123. WOWWEE GROUP LTD.: SERVICE SEGMENTS
- TABLE 124. WOWWEE GROUP LTD.: PRODUCT PORTFOLIO
- TABLE 125. WOWWEE GROUP LTD.: KEY STRATERGIES
- TABLE 126. ANKI, INC.: KEY EXECUTIVES
- TABLE 127. ANKI, INC.: COMPANY SNAPSHOT
- TABLE 128. ANKI, INC.: PRODUCT SEGMENTS
- TABLE 129. ANKI, INC.: SERVICE SEGMENTS
- TABLE 130. ANKI, INC.: PRODUCT PORTFOLIO
- TABLE 131. ANKI, INC.: KEY STRATERGIES
- TABLE 132. SPHERO INC.: KEY EXECUTIVES
- TABLE 133. SPHERO INC.: COMPANY SNAPSHOT
- TABLE 134. SPHERO INC.: PRODUCT SEGMENTS
- TABLE 135. SPHERO INC.: SERVICE SEGMENTS
- TABLE 136. SPHERO INC.: PRODUCT PORTFOLIO
- TABLE 137. SPHERO INC.: KEY STRATERGIES
- TABLE 138. LITTLEBITS ELECTRONICS, INC.: KEY EXECUTIVES
- TABLE 139. LITTLEBITS ELECTRONICS, INC.: COMPANY SNAPSHOT
- TABLE 140. LITTLEBITS ELECTRONICS, INC.: PRODUCT SEGMENTS
- TABLE 141. LITTLEBITS ELECTRONICS, INC.: SERVICE SEGMENTS
- TABLE 142. LITTLEBITS ELECTRONICS, INC.: PRODUCT PORTFOLIO
- TABLE 143. LITTLEBITS ELECTRONICS, INC.: KEY STRATERGIES
- TABLE 144. UBTECH ROBOTICS CORPORATION: KEY EXECUTIVES
- TABLE 145. UBTECH ROBOTICS CORPORATION: COMPANY SNAPSHOT
- TABLE 146. UBTECH ROBOTICS CORPORATION: PRODUCT SEGMENTS
- TABLE 147. UBTECH ROBOTICS CORPORATION: SERVICE SEGMENTS
- TABLE 148. UBTECH ROBOTICS CORPORATION: PRODUCT PORTFOLIO
- TABLE 149. UBTECH ROBOTICS CORPORATION: KEY STRATERGIES
LIST OF FIGURES
- FIGURE 01. SMART TOYS MARKET, 2023-2033
- FIGURE 02. SEGMENTATION OF SMART TOYS MARKET,2023-2033
- FIGURE 03. TOP IMPACTING FACTORS IN SMART TOYS MARKET
- FIGURE 04. TOP INVESTMENT POCKETS IN SMART TOYS MARKET (2024-2033)
- FIGURE 05. BARGAINING POWER OF SUPPLIERS
- FIGURE 06. BARGAINING POWER OF BUYERS
- FIGURE 07. THREAT OF SUBSTITUTION
- FIGURE 08. THREAT OF SUBSTITUTION
- FIGURE 09. COMPETITIVE RIVALRY
- FIGURE 10. GLOBAL SMART TOYS MARKET:DRIVERS, RESTRAINTS AND OPPORTUNITIES
- FIGURE 11. SMART TOYS MARKET, BY TYPE, 2023 AND 2033(%)
- FIGURE 12. COMPARATIVE SHARE ANALYSIS OF SMART TOYS MARKET FOR ROBOTS, BY COUNTRY 2023 AND 2033(%)
- FIGURE 13. COMPARATIVE SHARE ANALYSIS OF SMART TOYS MARKET FOR INTERACTIVE GAMES, BY COUNTRY 2023 AND 2033(%)
- FIGURE 14. COMPARATIVE SHARE ANALYSIS OF SMART TOYS MARKET FOR EDUCATIONAL ROBOTS, BY COUNTRY 2023 AND 2033(%)
- FIGURE 15. SMART TOYS MARKET, BY TECHNOLOGY, 2023 AND 2033(%)
- FIGURE 16. COMPARATIVE SHARE ANALYSIS OF SMART TOYS MARKET FOR WI FI, BY COUNTRY 2023 AND 2033(%)
- FIGURE 17. COMPARATIVE SHARE ANALYSIS OF SMART TOYS MARKET FOR BLUETOOTH, BY COUNTRY 2023 AND 2033(%)
- FIGURE 18. COMPARATIVE SHARE ANALYSIS OF SMART TOYS MARKET FOR RFID OR NFC, BY COUNTRY 2023 AND 2033(%)
- FIGURE 19. COMPARATIVE SHARE ANALYSIS OF SMART TOYS MARKET FOR OTHERS, BY COUNTRY 2023 AND 2033(%)
- FIGURE 20. SMART TOYS MARKET, BY DISTRIBUTION CHANNEL, 2023 AND 2033(%)
- FIGURE 21. COMPARATIVE SHARE ANALYSIS OF SMART TOYS MARKET FOR OFFLINE, BY COUNTRY 2023 AND 2033(%)
- FIGURE 22. COMPARATIVE SHARE ANALYSIS OF SMART TOYS MARKET FOR ONLINE, BY COUNTRY 2023 AND 2033(%)
- FIGURE 23. SMART TOYS MARKET BY REGION, 2023 AND 2033(%)
- FIGURE 24. U.S. SMART TOYS MARKET, 2023-2033 ($MILLION)
- FIGURE 25. CANADA SMART TOYS MARKET, 2023-2033 ($MILLION)
- FIGURE 26. MEXICO SMART TOYS MARKET, 2023-2033 ($MILLION)
- FIGURE 27. GERMANY SMART TOYS MARKET, 2023-2033 ($MILLION)
- FIGURE 28. FRANCE SMART TOYS MARKET, 2023-2033 ($MILLION)
- FIGURE 29. UK SMART TOYS MARKET, 2023-2033 ($MILLION)
- FIGURE 30. ITALY SMART TOYS MARKET, 2023-2033 ($MILLION)
- FIGURE 31. SPAIN SMART TOYS MARKET, 2023-2033 ($MILLION)
- FIGURE 32. REST OF EUROPE SMART TOYS MARKET, 2023-2033 ($MILLION)
- FIGURE 33. CHINA SMART TOYS MARKET, 2023-2033 ($MILLION)
- FIGURE 34. INDIA SMART TOYS MARKET, 2023-2033 ($MILLION)
- FIGURE 35. JAPAN SMART TOYS MARKET, 2023-2033 ($MILLION)
- FIGURE 36. AUSTRALIA SMART TOYS MARKET, 2023-2033 ($MILLION)
- FIGURE 37. SOUTH KOREA SMART TOYS MARKET, 2023-2033 ($MILLION)
- FIGURE 38. REST OF ASIA-PACIFIC SMART TOYS MARKET, 2023-2033 ($MILLION)
- FIGURE 39. BRAZIL SMART TOYS MARKET, 2023-2033 ($MILLION)
- FIGURE 40. SOUTH AFRICA SMART TOYS MARKET, 2023-2033 ($MILLION)
- FIGURE 41. SAUDI ARABIA SMART TOYS MARKET, 2023-2033 ($MILLION)
- FIGURE 42. UNITED ARAB EMIRATES SMART TOYS MARKET, 2023-2033 ($MILLION)
- FIGURE 43. REST OF LAMEA SMART TOYS MARKET, 2023-2033 ($MILLION)
- FIGURE 44. TOP WINNING STRATEGIES, BY YEAR
- FIGURE 45. TOP WINNING STRATEGIES, BY DEVELOPMENT
- FIGURE 46. TOP WINNING STRATEGIES, BY COMPANY
- FIGURE 47. PRODUCT MAPPING OF TOP 10 PLAYERS
- FIGURE 48. COMPETITIVE DASHBOARD
- FIGURE 49. COMPETITIVE HEATMAP: SMART TOYS MARKET
- FIGURE 50. TOP PLAYER POSITIONING, 2023
The smart toys market has witnessed significant growth in developed economies such as the U.S., Canada, Germany, the UK, and France due to the increased cultural acceptance of technology-based products in the past decade. Consumers in developed regions such as Europe and North America generally prefer technologically advanced products in various aspects. The higher digital literacy and presence of a higher number of tech-savvy parents in the developed regions have led to a higher demand for smart toys. According to the National Center for Education Statistics, "In 2021, the percentage of 3 to 18 year olds who had home internet access through a computer was highest for those whose parents had attained a bachelor or higher degree (98 %) and lowest for those whose parents had attained less than a high school credential (78%)." Moreover, the growth in consumer awareness regarding the benefits or advantages of smart toys over traditional toys in developing economies such as Brazil, India, and China are expected to foster the demand for smart toys in the foreseeable future. Furthermore, the rise in disposable income coupled with the easy availability of smart toys due to the presence of widespread offline and online sales channels across the globe has positively fostered the growth of the smart toys market.
However, there are several challenges associated with smart toys that may hamper the growth of the smart toys market. In November 2023, an 11-year-old girl in the U.S. was kidnapped by a man she encountered while playing an online game named Robolox. She was later found at about 135 miles away from her home. The toys installed with microphones, trackers, and cameras pose a cyber threat to children. Therefore, increase in cyber threats associated with digital technologies may negatively impact the demand for smart toys across the globe.
However, the growth in focus of the manufacturers on safety and security and the regulations framed by the government authorities regarding the safety standards of toys and digital devices are expected to positively impact the smart toys market. Furthermore, the developmental strategies such as new product launches, acquisitions, and business expansion undertaken by the major market players are expected to drive the growth of the market in the forthcoming years. For instance, in April 2022, LeapFrog Enterprises, Inc. launched Scout and Violet plush pals to offer a creative touch-sensitive toy to provide fun learning experiences to the children. In July 2022, Smart Toys and Games acquired The Happy Puzzle Company to merge the product portfolio of Happy Puzzle into Smart Toys and Games' growing portfolio. This acquisition is aimed at strengthening the portfolio and distribution network of Smart Toys and Games.
The smart toys market is segmented on the basis of type, technology, distribution channel, and region. On the basis of type, the smart toys market is segregated into robots, interactive games, and educational robots. On the basis of technology, the market is divided into Wi-Fi, Bluetooth, RFID or NFC, and others. On the basis of distribution channel, the market is bifurcated into offline and online. On the basis of region, the market is analyzed across North America (the U.S., Canada, and Mexico), Europe (Germany, France, the UK, Italy, Spain, and rest of Europe), Asia-Pacific (China, Japan, India, South Korea, Australia, and rest of Asia-Pacific), and LAMEA (Brazil, South Africa, Saudi Arabia, UAE, and rest of LAMEA).
Mattel, Inc., LEGO Group, Hasbro, Inc., K'NEX Industries, Inc., Jakks Pacific, Inc., WowWee Group Limited, Anki, Inc., Sphero, Inc., LittleBits Electronics, Inc., UBTECH Robotics, Inc., and Fisher-Price, Inc. are the major companies profiled in the smart toys market report. These players are constantly engaged in various developmental strategies such as partnerships, mergers, acquisitions, and new product launches to gain a competitive edge and exploit the prevailing smart toys market opportunities.
Key Benefits For Stakeholders
- This report provides a quantitative analysis of the market segments, current trends, estimations, and dynamics of the smart toys market analysis from 2023 to 2033 to identify the prevailing smart toys market opportunities.
- The market research is offered along with information related to key drivers, restraints, and opportunities.
- Porter's five forces analysis highlights the potency of buyers and suppliers to enable stakeholders make profit-oriented business decisions and strengthen their supplier-buyer network.
- In-depth analysis of the smart toys market segmentation assists to determine the prevailing market opportunities.
- Major countries in each region are mapped according to their revenue contribution to the global market.
- Market player positioning facilitates benchmarking and provides a clear understanding of the present position of the market players.
- The report includes the analysis of the regional as well as global smart toys market trends, key players, market segments, application areas, and market growth strategies.
Additional benefits you will get with this purchase are:
- Quarterly Update and* (only available with a corporate license, on listed price)
- 5 additional Company Profile of client Choice pre- or Post-purchase, as a free update.
- Free Upcoming Version on the Purchase of Five and Enterprise User License.
- 16 analyst hours of support* (post-purchase, if you find additional data requirements upon review of the report, you may receive support amounting to 16 analyst hours to solve questions, and post-sale queries)
- 15% Free Customization* (in case the scope or segment of the report does not match your requirements, 15% is equivalent to 3 working days of free work, applicable once)
- Free data Pack on the Five and Enterprise User License. (Excel version of the report)
- Free Updated report if the report is 6-12 months old or older.
- 24-hour priority response*
- Free Industry updates and white papers.
Possible Customization with this report (with additional cost and timeline, please talk to the sales executive to know more)
- Consumer Buying Behavior Analysis
- Average Consumer Expenditure
- Pain Point Analysis
- Additional company profiles with specific to client's interest
- Additional country or region analysis- market size and forecast
- Criss-cross segment analysis- market size and forecast
- Expanded list for Company Profiles
- Historic market data
- Key player details (including location, contact details, supplier/vendor network etc. in excel format)
- SWOT Analysis
Key Market Segments
By Type
- Robots
- Interactive Games
- Educational Robots
By Technology
- Wi Fi
- Bluetooth
- RFID or NFC
- Others
By Distribution Channel
- Offline
- Online
By Region
- North America
- U.S.
- Canada
- Mexico
- Europe
- Germany
- France
- UK
- Italy
- Spain
- Rest of Europe
- Asia-Pacific
- China
- India
- Japan
- Australia
- South Korea
- Rest of Asia-Pacific
- LAMEA
- Brazil
- South Africa
- Saudi Arabia
- United Arab Emirates
- Rest of LAMEA
Key Market Players:
- The Lego Group
- hasbro inc
- K'NEX Industries, Inc.
- Mattel, Inc.
- JAKKS Pacific Inc.
- WowWee Group Ltd.
- Anki, Inc.
- Sphero Inc.
- littleBits Electronics, Inc.
- UBTECH Robotics Corporation
TABLE OF CONTENTS
CHAPTER 1: INTRODUCTION
- 1.1. Report description
- 1.2. Key market segments
- 1.3. Key benefits to the stakeholders
- 1.4. Research methodology
- 1.4.1. Primary research
- 1.4.2. Secondary research
- 1.4.3. Analyst tools and models
CHAPTER 2: EXECUTIVE SUMMARY
- 2.1. CXO Perspective
CHAPTER 3: MARKET OVERVIEW
- 3.1. Market definition and scope
- 3.2. Key findings
- 3.2.1. Top impacting factors
- 3.2.2. Top investment pockets
- 3.3. Porter's five forces analysis
- 3.4. Market dynamics
- 3.4.1. Drivers
- 3.4.2. Restraints
- 3.4.3. Opportunities
- 3.5. Average Selling Price
CHAPTER 4: SMART TOYS MARKET, BY TYPE
- 4.1. Overview
- 4.1.1. Market size and forecast
- 4.2. Robots
- 4.2.1. Key market trends, growth factors and opportunities
- 4.2.2. Market size and forecast, by region
- 4.2.3. Market share analysis by country
- 4.3. Interactive Games
- 4.3.1. Key market trends, growth factors and opportunities
- 4.3.2. Market size and forecast, by region
- 4.3.3. Market share analysis by country
- 4.4. Educational Robots
- 4.4.1. Key market trends, growth factors and opportunities
- 4.4.2. Market size and forecast, by region
- 4.4.3. Market share analysis by country
CHAPTER 5: SMART TOYS MARKET, BY TECHNOLOGY
- 5.1. Overview
- 5.1.1. Market size and forecast
- 5.2. Wi Fi
- 5.2.1. Key market trends, growth factors and opportunities
- 5.2.2. Market size and forecast, by region
- 5.2.3. Market share analysis by country
- 5.3. Bluetooth
- 5.3.1. Key market trends, growth factors and opportunities
- 5.3.2. Market size and forecast, by region
- 5.3.3. Market share analysis by country
- 5.4. RFID or NFC
- 5.4.1. Key market trends, growth factors and opportunities
- 5.4.2. Market size and forecast, by region
- 5.4.3. Market share analysis by country
- 5.5. Others
- 5.5.1. Key market trends, growth factors and opportunities
- 5.5.2. Market size and forecast, by region
- 5.5.3. Market share analysis by country
CHAPTER 6: SMART TOYS MARKET, BY DISTRIBUTION CHANNEL
- 6.1. Overview
- 6.1.1. Market size and forecast
- 6.2. Offline
- 6.2.1. Key market trends, growth factors and opportunities
- 6.2.2. Market size and forecast, by region
- 6.2.3. Market share analysis by country
- 6.3. Online
- 6.3.1. Key market trends, growth factors and opportunities
- 6.3.2. Market size and forecast, by region
- 6.3.3. Market share analysis by country
CHAPTER 7: SMART TOYS MARKET, BY REGION
- 7.1. Overview
- 7.1.1. Market size and forecast By Region
- 7.2. North America
- 7.2.1. Key market trends, growth factors and opportunities
- 7.2.2. Market size and forecast, by Type
- 7.2.3. Market size and forecast, by Technology
- 7.2.4. Market size and forecast, by Distribution Channel
- 7.2.5. Market size and forecast, by country
- 7.2.5.1. U.S.
- 7.2.5.1.1. Market size and forecast, by Type
- 7.2.5.1.2. Market size and forecast, by Technology
- 7.2.5.1.3. Market size and forecast, by Distribution Channel
- 7.2.5.2. Canada
- 7.2.5.2.1. Market size and forecast, by Type
- 7.2.5.2.2. Market size and forecast, by Technology
- 7.2.5.2.3. Market size and forecast, by Distribution Channel
- 7.2.5.3. Mexico
- 7.2.5.3.1. Market size and forecast, by Type
- 7.2.5.3.2. Market size and forecast, by Technology
- 7.2.5.3.3. Market size and forecast, by Distribution Channel
- 7.3. Europe
- 7.3.1. Key market trends, growth factors and opportunities
- 7.3.2. Market size and forecast, by Type
- 7.3.3. Market size and forecast, by Technology
- 7.3.4. Market size and forecast, by Distribution Channel
- 7.3.5. Market size and forecast, by country
- 7.3.5.1. Germany
- 7.3.5.1.1. Market size and forecast, by Type
- 7.3.5.1.2. Market size and forecast, by Technology
- 7.3.5.1.3. Market size and forecast, by Distribution Channel
- 7.3.5.2. France
- 7.3.5.2.1. Market size and forecast, by Type
- 7.3.5.2.2. Market size and forecast, by Technology
- 7.3.5.2.3. Market size and forecast, by Distribution Channel
- 7.3.5.3. UK
- 7.3.5.3.1. Market size and forecast, by Type
- 7.3.5.3.2. Market size and forecast, by Technology
- 7.3.5.3.3. Market size and forecast, by Distribution Channel
- 7.3.5.4. Italy
- 7.3.5.4.1. Market size and forecast, by Type
- 7.3.5.4.2. Market size and forecast, by Technology
- 7.3.5.4.3. Market size and forecast, by Distribution Channel
- 7.3.5.5. Spain
- 7.3.5.5.1. Market size and forecast, by Type
- 7.3.5.5.2. Market size and forecast, by Technology
- 7.3.5.5.3. Market size and forecast, by Distribution Channel
- 7.3.5.6. Rest of Europe
- 7.3.5.6.1. Market size and forecast, by Type
- 7.3.5.6.2. Market size and forecast, by Technology
- 7.3.5.6.3. Market size and forecast, by Distribution Channel
- 7.4. Asia-Pacific
- 7.4.1. Key market trends, growth factors and opportunities
- 7.4.2. Market size and forecast, by Type
- 7.4.3. Market size and forecast, by Technology
- 7.4.4. Market size and forecast, by Distribution Channel
- 7.4.5. Market size and forecast, by country
- 7.4.5.1. China
- 7.4.5.1.1. Market size and forecast, by Type
- 7.4.5.1.2. Market size and forecast, by Technology
- 7.4.5.1.3. Market size and forecast, by Distribution Channel
- 7.4.5.2. India
- 7.4.5.2.1. Market size and forecast, by Type
- 7.4.5.2.2. Market size and forecast, by Technology
- 7.4.5.2.3. Market size and forecast, by Distribution Channel
- 7.4.5.3. Japan
- 7.4.5.3.1. Market size and forecast, by Type
- 7.4.5.3.2. Market size and forecast, by Technology
- 7.4.5.3.3. Market size and forecast, by Distribution Channel
- 7.4.5.4. Australia
- 7.4.5.4.1. Market size and forecast, by Type
- 7.4.5.4.2. Market size and forecast, by Technology
- 7.4.5.4.3. Market size and forecast, by Distribution Channel
- 7.4.5.5. South Korea
- 7.4.5.5.1. Market size and forecast, by Type
- 7.4.5.5.2. Market size and forecast, by Technology
- 7.4.5.5.3. Market size and forecast, by Distribution Channel
- 7.4.5.6. Rest of Asia-Pacific
- 7.4.5.6.1. Market size and forecast, by Type
- 7.4.5.6.2. Market size and forecast, by Technology
- 7.4.5.6.3. Market size and forecast, by Distribution Channel
- 7.5. LAMEA
- 7.5.1. Key market trends, growth factors and opportunities
- 7.5.2. Market size and forecast, by Type
- 7.5.3. Market size and forecast, by Technology
- 7.5.4. Market size and forecast, by Distribution Channel
- 7.5.5. Market size and forecast, by country
- 7.5.5.1. Brazil
- 7.5.5.1.1. Market size and forecast, by Type
- 7.5.5.1.2. Market size and forecast, by Technology
- 7.5.5.1.3. Market size and forecast, by Distribution Channel
- 7.5.5.2. South Africa
- 7.5.5.2.1. Market size and forecast, by Type
- 7.5.5.2.2. Market size and forecast, by Technology
- 7.5.5.2.3. Market size and forecast, by Distribution Channel
- 7.5.5.3. Saudi Arabia
- 7.5.5.3.1. Market size and forecast, by Type
- 7.5.5.3.2. Market size and forecast, by Technology
- 7.5.5.3.3. Market size and forecast, by Distribution Channel
- 7.5.5.4. United Arab Emirates
- 7.5.5.4.1. Market size and forecast, by Type
- 7.5.5.4.2. Market size and forecast, by Technology
- 7.5.5.4.3. Market size and forecast, by Distribution Channel
- 7.5.5.5. Rest of LAMEA
- 7.5.5.5.1. Market size and forecast, by Type
- 7.5.5.5.2. Market size and forecast, by Technology
- 7.5.5.5.3. Market size and forecast, by Distribution Channel
CHAPTER 8: COMPETITIVE LANDSCAPE
- 8.1. Introduction
- 8.2. Top winning strategies
- 8.3. Product mapping of top 10 player
- 8.4. Competitive dashboard
- 8.5. Competitive heatmap
- 8.6. Top player positioning, 2023
CHAPTER 9: COMPANY PROFILES
- 9.1. The Lego Group
- 9.1.1. Company overview
- 9.1.2. Key executives
- 9.1.3. Company snapshot
- 9.1.4. Operating business segments
- 9.1.5. Product portfolio
- 9.1.6. Business performance
- 9.1.7. Key strategic moves and developments
- 9.2. hasbro inc
- 9.2.1. Company overview
- 9.2.2. Key executives
- 9.2.3. Company snapshot
- 9.2.4. Operating business segments
- 9.2.5. Product portfolio
- 9.2.6. Business performance
- 9.2.7. Key strategic moves and developments
- 9.3. K'NEX Industries, Inc.
- 9.3.1. Company overview
- 9.3.2. Key executives
- 9.3.3. Company snapshot
- 9.3.4. Operating business segments
- 9.3.5. Product portfolio
- 9.3.6. Business performance
- 9.3.7. Key strategic moves and developments
- 9.4. Mattel, Inc.
- 9.4.1. Company overview
- 9.4.2. Key executives
- 9.4.3. Company snapshot
- 9.4.4. Operating business segments
- 9.4.5. Product portfolio
- 9.4.6. Business performance
- 9.4.7. Key strategic moves and developments
- 9.5. JAKKS Pacific Inc.
- 9.5.1. Company overview
- 9.5.2. Key executives
- 9.5.3. Company snapshot
- 9.5.4. Operating business segments
- 9.5.5. Product portfolio
- 9.5.6. Business performance
- 9.5.7. Key strategic moves and developments
- 9.6. WowWee Group Ltd.
- 9.6.1. Company overview
- 9.6.2. Key executives
- 9.6.3. Company snapshot
- 9.6.4. Operating business segments
- 9.6.5. Product portfolio
- 9.6.6. Business performance
- 9.6.7. Key strategic moves and developments
- 9.7. Anki, Inc.
- 9.7.1. Company overview
- 9.7.2. Key executives
- 9.7.3. Company snapshot
- 9.7.4. Operating business segments
- 9.7.5. Product portfolio
- 9.7.6. Business performance
- 9.7.7. Key strategic moves and developments
- 9.8. Sphero Inc.
- 9.8.1. Company overview
- 9.8.2. Key executives
- 9.8.3. Company snapshot
- 9.8.4. Operating business segments
- 9.8.5. Product portfolio
- 9.8.6. Business performance
- 9.8.7. Key strategic moves and developments
- 9.9. littleBits Electronics, Inc.
- 9.9.1. Company overview
- 9.9.2. Key executives
- 9.9.3. Company snapshot
- 9.9.4. Operating business segments
- 9.9.5. Product portfolio
- 9.9.6. Business performance
- 9.9.7. Key strategic moves and developments
- 9.10. UBTECH Robotics Corporation
- 9.10.1. Company overview
- 9.10.2. Key executives
- 9.10.3. Company snapshot
- 9.10.4. Operating business segments
- 9.10.5. Product portfolio
- 9.10.6. Business performance
- 9.10.7. Key strategic moves and developments
