|
|
市場調査レポート
商品コード
1344502
エンベデッドファイナンス市場:タイプ別、業界別:2023年~2032年の世界の機会分析と産業予測Embedded Finance Market By Type, By Industry Vertical : Global Opportunity Analysis and Industry Forecast, 2023-2032 |
||||||
|
|
|||||||
|
|||||||


| エンベデッドファイナンス市場:タイプ別、業界別:2023年~2032年の世界の機会分析と産業予測 |
|
出版日: 2023年06月01日
発行: Allied Market Research
ページ情報: 英文 328 Pages
納期: 2~3営業日
|

- 全表示
- 概要
- 図表
- 目次
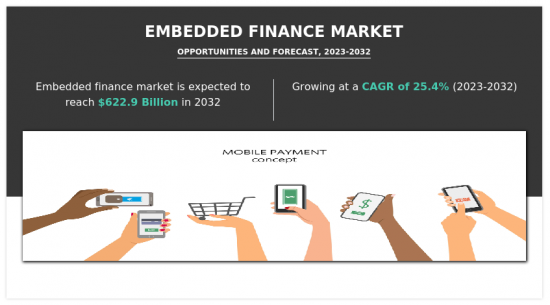
エンベデッドファイナンス市場は2022年に668億米ドルと評価され、2023年から2032年にかけてCAGR 25.4%で成長し、2032年には6,229億米ドルに達すると推定されます。
金融を含むいくつかの分野でデジタルトランスフォーメーションの動向が高まっていることは、金融サービスの提供・消費方法に革命をもたらしており、エンベデッド・ファイナンス市場の成長を促す主要因となっています。さらに、消費者はシームレスで手間のかからない体験をますます優先するようになり、日常の活動ややりとりの中に組み込まれた金融サービスを求めるようになっています。それゆえ、利便性を求める顧客の需要が起爆剤となり、さまざまな業界の企業が既存のプラットフォームに金融サービスを組み込み、ユーザーの進化するニーズに応えるよう促しています。加えて、金融包摂イニシアチブに後押しされた世界規模でのエンベデッドファイナンスの拡大は、人々の財務管理方法を変革し、これまで未開拓だった市場の経済成長を促進する可能性を秘めています。しかし、規制法は金融サービスを非金融プラットフォームや商品に統合するものであり、異なるセクター間の従来の境界を曖昧にし、複雑な規制上の問題を引き起こすため、規制上の課題がエンベデッドファイナンス市場にとって大きな抑制要因となっています。さらに、国によって規制環境が異なるため、国境を越えて事業を展開する企業にとっては、複雑なコンプライアンス要件を乗り越えることが難しくなっています。その結果、多くの企業がエンベデッドファイナンスサービスを世界に拡大する上で障壁に直面し、市場の拡大可能性が制限されています。逆に、金融サービスをプラットフォームに直接統合することで、企業は金融プロセスを自動化し、手作業による介入と関連コストを削減することができます。これにより業務が合理化され、効率が向上し、リアルタイムの取引が可能になるため、企業と消費者の双方にメリットがもたらされます。したがって、自動化と効率化は市場成長にとって有利な機会となると思われます。
目次
第1章 イントロダクション
第2章 エグゼクティブサマリー
第3章 市場概要
- 市場の定義と範囲
- 主な調査結果
- 影響要因
- 主な投資機会
- ポーターのファイブフォース分析
- 供給企業の交渉力
- 買い手の交渉力
- 代替品の脅威
- 新規参入業者の脅威
- 競合の激しさ
- 市場力学
- 促進要因
- デジタルトランスフォーメーションの増加
- 利便性に対する顧客の要求
- 世界展開と金融包摂
- 抑制要因
- 規制上の課題
- 機会
- 顧客基盤の拡大
- 促進要因
- COVID-19市場への影響分析
第4章 エンベデッドファイナンス市場:タイプ別
- 概要
- エンベデッドペイメント
- エンベデッドレンディング
- エンベデッドインベストメント
- エンベデッドインシュアランス
第5章 エンベデッドファイナンス市場:業界別
- 概要
- 小売・eコマース
- 運輸・物流
- ヘルスケア
- メディアとエンターテインメント
- その他
第6章 エンベデッドファイナンス市場:地域別
- 概要
- 北米
- 米国
- カナダ
- 欧州
- 英国
- ドイツ
- フランス
- イタリア
- スペイン
- その他欧州
- アジア太平洋
- 中国
- 日本
- インド
- オーストラリア
- 韓国
- その他アジア太平洋地域
- ラテンアメリカ
- ラテンアメリカ
- 中東
- アフリカ
第7章 競合情勢
- イントロダクション
- 主要成功戦略
- 主要10社の製品マッピング
- 競合ダッシュボード
- 競合ヒートマップ
- 主要企業のポジショニング、2022年
第8章 企業プロファイル
- Block, Inc.
- Cybrid Technology Inc
- Fortis Payment Systems, LLC("Fortis")
- Finastra International Limited
- FinBox
- Lendflow
- PAYRIX
- PayPal Holdings, Inc
- Stripe
- Zopa Bank Limited
LIST OF TABLES
- TABLE 01. GLOBAL EMBEDDED FINANCE MARKET, BY TYPE, 2022-2032 ($MILLION)
- TABLE 02. EMBEDDED FINANCE MARKET FOR EMBEDDED PAYMENT, BY REGION, 2022-2032 ($MILLION)
- TABLE 03. EMBEDDED FINANCE MARKET FOR EMBEDDED LENDING, BY REGION, 2022-2032 ($MILLION)
- TABLE 04. EMBEDDED FINANCE MARKET FOR EMBEDDED INVESTMENT, BY REGION, 2022-2032 ($MILLION)
- TABLE 05. EMBEDDED FINANCE MARKET FOR EMBEDDED INSURANCE, BY REGION, 2022-2032 ($MILLION)
- TABLE 06. GLOBAL EMBEDDED FINANCE MARKET, BY INDUSTRY VERTICAL, 2022-2032 ($MILLION)
- TABLE 07. EMBEDDED FINANCE MARKET FOR RETAIL AND E-COMMERCE, BY REGION, 2022-2032 ($MILLION)
- TABLE 08. EMBEDDED FINANCE MARKET FOR TRANSPORTATION AND LOGISTICS, BY REGION, 2022-2032 ($MILLION)
- TABLE 09. EMBEDDED FINANCE MARKET FOR HEALTHCARE, BY REGION, 2022-2032 ($MILLION)
- TABLE 10. EMBEDDED FINANCE MARKET FOR MEDIA AND ENTERTAINMENT, BY REGION, 2022-2032 ($MILLION)
- TABLE 11. EMBEDDED FINANCE MARKET FOR OTHERS, BY REGION, 2022-2032 ($MILLION)
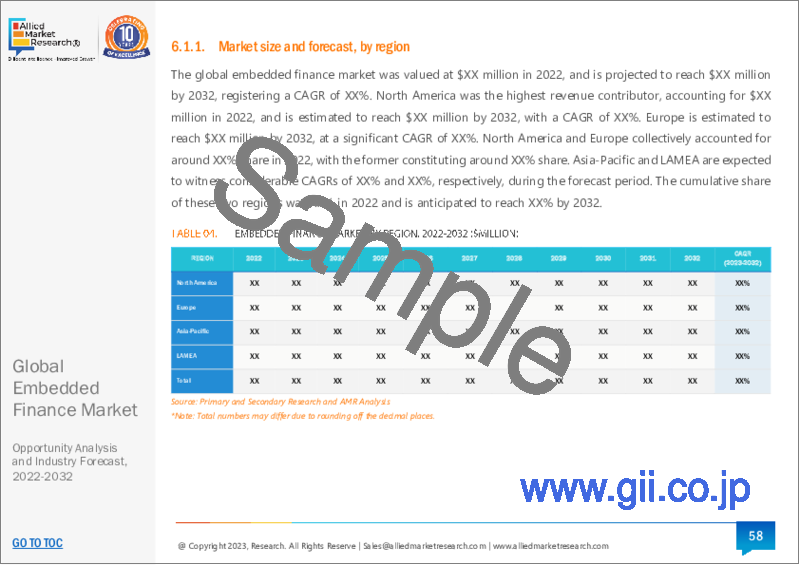
- TABLE 12. EMBEDDED FINANCE MARKET, BY REGION, 2022-2032 ($MILLION)
- TABLE 13. NORTH AMERICA EMBEDDED FINANCE MARKET, BY TYPE, 2022-2032 ($MILLION)
- TABLE 14. NORTH AMERICA EMBEDDED FINANCE MARKET, BY INDUSTRY VERTICAL, 2022-2032 ($MILLION)
- TABLE 15. NORTH AMERICA EMBEDDED FINANCE MARKET, BY COUNTRY, 2022-2032 ($MILLION)
- TABLE 16. U.S. EMBEDDED FINANCE MARKET, BY TYPE, 2022-2032 ($MILLION)
- TABLE 17. U.S. EMBEDDED FINANCE MARKET, BY INDUSTRY VERTICAL, 2022-2032 ($MILLION)
- TABLE 18. CANADA EMBEDDED FINANCE MARKET, BY TYPE, 2022-2032 ($MILLION)
- TABLE 19. CANADA EMBEDDED FINANCE MARKET, BY INDUSTRY VERTICAL, 2022-2032 ($MILLION)
- TABLE 20. EUROPE EMBEDDED FINANCE MARKET, BY TYPE, 2022-2032 ($MILLION)
- TABLE 21. EUROPE EMBEDDED FINANCE MARKET, BY INDUSTRY VERTICAL, 2022-2032 ($MILLION)
- TABLE 22. EUROPE EMBEDDED FINANCE MARKET, BY COUNTRY, 2022-2032 ($MILLION)
- TABLE 23. UK EMBEDDED FINANCE MARKET, BY TYPE, 2022-2032 ($MILLION)
- TABLE 24. UK EMBEDDED FINANCE MARKET, BY INDUSTRY VERTICAL, 2022-2032 ($MILLION)
- TABLE 25. GERMANY EMBEDDED FINANCE MARKET, BY TYPE, 2022-2032 ($MILLION)
- TABLE 26. GERMANY EMBEDDED FINANCE MARKET, BY INDUSTRY VERTICAL, 2022-2032 ($MILLION)
- TABLE 27. FRANCE EMBEDDED FINANCE MARKET, BY TYPE, 2022-2032 ($MILLION)
- TABLE 28. FRANCE EMBEDDED FINANCE MARKET, BY INDUSTRY VERTICAL, 2022-2032 ($MILLION)
- TABLE 29. ITALY EMBEDDED FINANCE MARKET, BY TYPE, 2022-2032 ($MILLION)
- TABLE 30. ITALY EMBEDDED FINANCE MARKET, BY INDUSTRY VERTICAL, 2022-2032 ($MILLION)
- TABLE 31. SPAIN EMBEDDED FINANCE MARKET, BY TYPE, 2022-2032 ($MILLION)
- TABLE 32. SPAIN EMBEDDED FINANCE MARKET, BY INDUSTRY VERTICAL, 2022-2032 ($MILLION)
- TABLE 33. REST OF EUROPE EMBEDDED FINANCE MARKET, BY TYPE, 2022-2032 ($MILLION)
- TABLE 34. REST OF EUROPE EMBEDDED FINANCE MARKET, BY INDUSTRY VERTICAL, 2022-2032 ($MILLION)
- TABLE 35. ASIA-PACIFIC EMBEDDED FINANCE MARKET, BY TYPE, 2022-2032 ($MILLION)
- TABLE 36. ASIA-PACIFIC EMBEDDED FINANCE MARKET, BY INDUSTRY VERTICAL, 2022-2032 ($MILLION)
- TABLE 37. ASIA-PACIFIC EMBEDDED FINANCE MARKET, BY COUNTRY, 2022-2032 ($MILLION)
- TABLE 38. CHINA EMBEDDED FINANCE MARKET, BY TYPE, 2022-2032 ($MILLION)
- TABLE 39. CHINA EMBEDDED FINANCE MARKET, BY INDUSTRY VERTICAL, 2022-2032 ($MILLION)
- TABLE 40. JAPAN EMBEDDED FINANCE MARKET, BY TYPE, 2022-2032 ($MILLION)
- TABLE 41. JAPAN EMBEDDED FINANCE MARKET, BY INDUSTRY VERTICAL, 2022-2032 ($MILLION)
- TABLE 42. INDIA EMBEDDED FINANCE MARKET, BY TYPE, 2022-2032 ($MILLION)
- TABLE 43. INDIA EMBEDDED FINANCE MARKET, BY INDUSTRY VERTICAL, 2022-2032 ($MILLION)
- TABLE 44. AUSTRALIA EMBEDDED FINANCE MARKET, BY TYPE, 2022-2032 ($MILLION)
- TABLE 45. AUSTRALIA EMBEDDED FINANCE MARKET, BY INDUSTRY VERTICAL, 2022-2032 ($MILLION)
- TABLE 46. SOUTH KOREA EMBEDDED FINANCE MARKET, BY TYPE, 2022-2032 ($MILLION)
- TABLE 47. SOUTH KOREA EMBEDDED FINANCE MARKET, BY INDUSTRY VERTICAL, 2022-2032 ($MILLION)
- TABLE 48. REST OF ASIA-PACIFIC EMBEDDED FINANCE MARKET, BY TYPE, 2022-2032 ($MILLION)
- TABLE 49. REST OF ASIA-PACIFIC EMBEDDED FINANCE MARKET, BY INDUSTRY VERTICAL, 2022-2032 ($MILLION)
- TABLE 50. LAMEA EMBEDDED FINANCE MARKET, BY TYPE, 2022-2032 ($MILLION)
- TABLE 51. LAMEA EMBEDDED FINANCE MARKET, BY INDUSTRY VERTICAL, 2022-2032 ($MILLION)
- TABLE 52. LAMEA EMBEDDED FINANCE MARKET, BY COUNTRY, 2022-2032 ($MILLION)
- TABLE 53. LATIN AMERICA EMBEDDED FINANCE MARKET, BY TYPE, 2022-2032 ($MILLION)
- TABLE 54. LATIN AMERICA EMBEDDED FINANCE MARKET, BY INDUSTRY VERTICAL, 2022-2032 ($MILLION)
- TABLE 55. MIDDLE EAST EMBEDDED FINANCE MARKET, BY TYPE, 2022-2032 ($MILLION)
- TABLE 56. MIDDLE EAST EMBEDDED FINANCE MARKET, BY INDUSTRY VERTICAL, 2022-2032 ($MILLION)
- TABLE 57. AFRICA EMBEDDED FINANCE MARKET, BY TYPE, 2022-2032 ($MILLION)
- TABLE 58. AFRICA EMBEDDED FINANCE MARKET, BY INDUSTRY VERTICAL, 2022-2032 ($MILLION)
- TABLE 59. BLOCK, INC.: KEY EXECUTIVES
- TABLE 60. BLOCK, INC.: COMPANY SNAPSHOT
- TABLE 61. BLOCK, INC.: SERVICE SEGMENTS
- TABLE 62. BLOCK, INC.: PRODUCT PORTFOLIO
- TABLE 63. CYBRID TECHNOLOGY INC: KEY EXECUTIVES
- TABLE 64. CYBRID TECHNOLOGY INC: COMPANY SNAPSHOT
- TABLE 65. CYBRID TECHNOLOGY INC: SERVICE SEGMENTS
- TABLE 66. CYBRID TECHNOLOGY INC: PRODUCT PORTFOLIO
- TABLE 67. FORTIS PAYMENT SYSTEMS, LLC ("FORTIS"): KEY EXECUTIVES
- TABLE 68. FORTIS PAYMENT SYSTEMS, LLC ("FORTIS"): COMPANY SNAPSHOT
- TABLE 69. FORTIS PAYMENT SYSTEMS, LLC ("FORTIS"): SERVICE SEGMENTS
- TABLE 70. FORTIS PAYMENT SYSTEMS, LLC ("FORTIS"): PRODUCT PORTFOLIO
- TABLE 71. FORTIS PAYMENT SYSTEMS, LLC ("FORTIS"): KEY STRATERGIES
- TABLE 72. FINASTRA INTERNATIONAL LIMITED: KEY EXECUTIVES
- TABLE 73. FINASTRA INTERNATIONAL LIMITED: COMPANY SNAPSHOT
- TABLE 74. FINASTRA INTERNATIONAL LIMITED: SERVICE SEGMENTS
- TABLE 75. FINASTRA INTERNATIONAL LIMITED: PRODUCT PORTFOLIO
- TABLE 76. FINASTRA INTERNATIONAL LIMITED: KEY STRATERGIES
- TABLE 77. FINBOX: KEY EXECUTIVES
- TABLE 78. FINBOX: COMPANY SNAPSHOT
- TABLE 79. FINBOX: SERVICE SEGMENTS
- TABLE 80. FINBOX: PRODUCT PORTFOLIO
- TABLE 81. FINBOX: KEY STRATERGIES
- TABLE 82. LENDFLOW: KEY EXECUTIVES
- TABLE 83. LENDFLOW: COMPANY SNAPSHOT
- TABLE 84. LENDFLOW: SERVICE SEGMENTS
- TABLE 85. LENDFLOW: PRODUCT PORTFOLIO
- TABLE 86. LENDFLOW: KEY STRATERGIES
- TABLE 87. PAYRIX: KEY EXECUTIVES
- TABLE 88. PAYRIX: COMPANY SNAPSHOT
- TABLE 89. PAYRIX: SERVICE SEGMENTS
- TABLE 90. PAYRIX: PRODUCT PORTFOLIO
- TABLE 91. PAYRIX: KEY STRATERGIES
- TABLE 92. PAYPAL HOLDINGS, INC: KEY EXECUTIVES
- TABLE 93. PAYPAL HOLDINGS, INC: COMPANY SNAPSHOT
- TABLE 94. PAYPAL HOLDINGS, INC: SERVICE SEGMENTS
- TABLE 95. PAYPAL HOLDINGS, INC: PRODUCT PORTFOLIO
- TABLE 96. STRIPE: KEY EXECUTIVES
- TABLE 97. STRIPE: COMPANY SNAPSHOT
- TABLE 98. STRIPE: SERVICE SEGMENTS
- TABLE 99. STRIPE: PRODUCT PORTFOLIO
- TABLE 100. STRIPE: KEY STRATERGIES
- TABLE 101. ZOPA BANK LIMITED: KEY EXECUTIVES
- TABLE 102. ZOPA BANK LIMITED: COMPANY SNAPSHOT
- TABLE 103. ZOPA BANK LIMITED: SERVICE SEGMENTS
- TABLE 104. ZOPA BANK LIMITED: PRODUCT PORTFOLIO
- TABLE 105. ZOPA BANK LIMITED: KEY STRATERGIES
LIST OF FIGURES
- FIGURE 01. EMBEDDED FINANCE MARKET, 2022-2032
- FIGURE 02. SEGMENTATION OF EMBEDDED FINANCE MARKET, 2022-2032
- FIGURE 03. TOP INVESTMENT POCKETS IN EMBEDDED FINANCE MARKET (2023-2032)
- FIGURE 04. LOW BARGAINING POWER OF SUPPLIERS
- FIGURE 05. LOW BARGAINING POWER OF BUYERS
- FIGURE 06. LOW THREAT OF SUBSTITUTES
- FIGURE 07. LOW THREAT OF NEW ENTRANTS
- FIGURE 08. LOW INTENSITY OF RIVALRY
- FIGURE 09. DRIVERS, RESTRAINTS AND OPPORTUNITIES: GLOBALEMBEDDED FINANCE MARKET
- FIGURE 10. EMBEDDED FINANCE MARKET, BY TYPE, 2022(%)
- FIGURE 11. COMPARATIVE SHARE ANALYSIS OF EMBEDDED FINANCE MARKET FOR EMBEDDED PAYMENT, BY COUNTRY 2022 AND 2032(%)
- FIGURE 12. COMPARATIVE SHARE ANALYSIS OF EMBEDDED FINANCE MARKET FOR EMBEDDED LENDING, BY COUNTRY 2022 AND 2032(%)
- FIGURE 13. COMPARATIVE SHARE ANALYSIS OF EMBEDDED FINANCE MARKET FOR EMBEDDED INVESTMENT, BY COUNTRY 2022 AND 2032(%)
- FIGURE 14. COMPARATIVE SHARE ANALYSIS OF EMBEDDED FINANCE MARKET FOR EMBEDDED INSURANCE, BY COUNTRY 2022 AND 2032(%)
- FIGURE 15. EMBEDDED FINANCE MARKET, BY INDUSTRY VERTICAL, 2022(%)
- FIGURE 16. COMPARATIVE SHARE ANALYSIS OF EMBEDDED FINANCE MARKET FOR RETAIL AND E-COMMERCE, BY COUNTRY 2022 AND 2032(%)
- FIGURE 17. COMPARATIVE SHARE ANALYSIS OF EMBEDDED FINANCE MARKET FOR TRANSPORTATION AND LOGISTICS, BY COUNTRY 2022 AND 2032(%)
- FIGURE 18. COMPARATIVE SHARE ANALYSIS OF EMBEDDED FINANCE MARKET FOR HEALTHCARE, BY COUNTRY 2022 AND 2032(%)
- FIGURE 19. COMPARATIVE SHARE ANALYSIS OF EMBEDDED FINANCE MARKET FOR MEDIA AND ENTERTAINMENT, BY COUNTRY 2022 AND 2032(%)
- FIGURE 20. COMPARATIVE SHARE ANALYSIS OF EMBEDDED FINANCE MARKET FOR OTHERS, BY COUNTRY 2022 AND 2032(%)
- FIGURE 21. EMBEDDED FINANCE MARKET BY REGION, 2022
- FIGURE 22. U.S. EMBEDDED FINANCE MARKET, 2022-2032 ($MILLION)
- FIGURE 23. CANADA EMBEDDED FINANCE MARKET, 2022-2032 ($MILLION)
- FIGURE 24. UK EMBEDDED FINANCE MARKET, 2022-2032 ($MILLION)
- FIGURE 25. GERMANY EMBEDDED FINANCE MARKET, 2022-2032 ($MILLION)
- FIGURE 26. FRANCE EMBEDDED FINANCE MARKET, 2022-2032 ($MILLION)
- FIGURE 27. ITALY EMBEDDED FINANCE MARKET, 2022-2032 ($MILLION)
- FIGURE 28. SPAIN EMBEDDED FINANCE MARKET, 2022-2032 ($MILLION)
- FIGURE 29. REST OF EUROPE EMBEDDED FINANCE MARKET, 2022-2032 ($MILLION)
- FIGURE 30. CHINA EMBEDDED FINANCE MARKET, 2022-2032 ($MILLION)
- FIGURE 31. JAPAN EMBEDDED FINANCE MARKET, 2022-2032 ($MILLION)
- FIGURE 32. INDIA EMBEDDED FINANCE MARKET, 2022-2032 ($MILLION)
- FIGURE 33. AUSTRALIA EMBEDDED FINANCE MARKET, 2022-2032 ($MILLION)
- FIGURE 34. SOUTH KOREA EMBEDDED FINANCE MARKET, 2022-2032 ($MILLION)
- FIGURE 35. REST OF ASIA-PACIFIC EMBEDDED FINANCE MARKET, 2022-2032 ($MILLION)
- FIGURE 36. LATIN AMERICA EMBEDDED FINANCE MARKET, 2022-2032 ($MILLION)
- FIGURE 37. MIDDLE EAST EMBEDDED FINANCE MARKET, 2022-2032 ($MILLION)
- FIGURE 38. AFRICA EMBEDDED FINANCE MARKET, 2022-2032 ($MILLION)
- FIGURE 39. TOP WINNING STRATEGIES, BY YEAR
- FIGURE 40. TOP WINNING STRATEGIES, BY DEVELOPMENT
- FIGURE 41. TOP WINNING STRATEGIES, BY COMPANY
- FIGURE 42. PRODUCT MAPPING OF TOP 10 PLAYERS
- FIGURE 43. COMPETITIVE DASHBOARD
- FIGURE 44. COMPETITIVE HEATMAP: EMBEDDED FINANCE MARKET
- FIGURE 45. TOP PLAYER POSITIONING, 2022
- FIGURE 46. PAYPAL HOLDINGS, INC: NET REVENUE, 2019-2021 ($MILLION)
- FIGURE 47. PAYPAL HOLDINGS, INC: RESEARCH & DEVELOPMENT EXPENDITURE, 2019-2021 ($MILLION)
- FIGURE 48. PAYPAL HOLDINGS, INC: REVENUE SHARE BY REGION, 2021 (%)
According to a new report published by Allied Market Research, titled, "Embedded Finance Market," The embedded finance market was valued at $66.8 billion in 2022, and is estimated to reach $622.9 billion by 2032, growing at a CAGR of 25.4% from 2023 to 2032.
The rising trend of digital transformation in several sectors including finance is the key factor driving growth of embedded finance market, as it is revolutionizing the way financial services are delivered and consumed. Furthermore, as consumers increasingly prioritize seamless and hassle-free experiences, they seek out financial services integrated within their everyday activities and interactions. Hence, customer demand for convenience acts as a catalyst, prompting businesses across various industries to embed financial services within their existing platforms and meet the evolving needs of their users. In addition, the expansion of embedded finance on a global scale, driven by financial inclusion initiatives, has the potential to transform the way people manage their finances and drive economic growth in previously untapped markets. However, regulatory challenges act as a significant restraint for the embedded finance market, as the regulatory laws involve the integration of financial services into non-financial platforms or products and blur the traditional boundaries between different sectors and raises complex regulatory issues. Moreover, different countries have varying regulatory environments, making it difficult for businesses operating across borders to navigate the complex compliance requirements. As a result, many companies face barriers to scaling their embedded finance offerings globally, limiting the market's expansion potential. On the contrary, by integrating financial services directly into platforms, companies can automate financial processes, reducing manual intervention and associated costs. This streamlines operations, improves efficiency, and enables real-time transactions, benefiting both businesses and consumers. Hence, automation and efficiency will provide lucrative opportunity for the growth of the market.
The embedded finance market is segmented on the basis of type, industry vertical and region. By type, it is segmented into embedded payment, embedded lending, embedded investment, and embedded insurance. By industry vertical, it is segmented into retail and e-commerce, transportation and logistics, healthcare, media and entertainment, and others. Region wise, it is analyzed across North America, Europe, Asia-Pacific, and LAMEA.
The report analyzes the profiles of key players operating in embedded finance market such as Block, Inc., Cybrid Technology Inc, Fortis Payment Systems, LLC ("Fortis"), Finastra International Limited, FinBox, Lendflow, PAYRIX, PayPal Holdings, Inc, Stripe, and Zopa Bank Limited. These players have adopted various strategies to increase their market penetration and strengthen their position in the embedded finance industry.
Key Benefits for Stakeholders
- The study provides in-depth analysis of the global embedded finance market along with the current & future trends to illustrate the imminent investment pockets.
- Information about key drivers, restrains, & opportunities and their impact analysis on the global embedded finance market size are provided in the report.
- Porter's five forces analysis illustrates the potency of buyers and suppliers operating in the industry.
- The quantitative analysis of the global embedded finance market from 2023 to 2032 is provided to determine the market potential.
Key Market Segments
By Type
- Embedded Payment
- Embedded Lending
- Embedded Investment
- Embedded Insurance
By Industry Vertical
- Retail and E-Commerce
- Transportation and Logistics
- Healthcare
- Media and Entertainment
- Others
By Region
- North America
- U.S.
- Canada
- Europe
- UK
- Germany
- France
- Italy
- Spain
- Rest of Europe
- Asia-Pacific
- China
- Japan
- India
- Australia
- South Korea
- Rest of Asia-Pacific
- LAMEA
- Latin America
- Middle East
- Africa
Key Market Players:
- Block, Inc.
- Cybrid Technology Inc
- Finastra International Limited
- FinBox
- Fortis Payment Systems, LLC ("Fortis")
- Lendflow
- PayPal Holdings, Inc
- PAYRIX
- Stripe
- Zopa Bank Limited
TABLE OF CONTENTS
CHAPTER 1: INTRODUCTION
- 1.1. Report description
- 1.2. Key market segments
- 1.3. Key benefits to the stakeholders
- 1.4. Research Methodology
- 1.4.1. Primary research
- 1.4.2. Secondary research
- 1.4.3. Analyst tools and models
CHAPTER 2: EXECUTIVE SUMMARY
- 2.1. CXO Perspective
CHAPTER 3: MARKET OVERVIEW
- 3.1. Market definition and scope
- 3.2. Key findings
- 3.2.1. Top impacting factors
- 3.2.2. Top investment pockets
- 3.3. Porter's five forces analysis
- 3.3.1. Bargaining power of suppliers
- 3.3.2. Bargaining power of buyers
- 3.3.3. Threat of substitutes
- 3.3.4. Threat of new entrants
- 3.3.5. Intensity of rivalry
- 3.4. Market dynamics
- 3.4.1. Drivers
- 3.4.1.1. Increase in digital transformation
- 3.4.1.2. Customer demand for convenience
- 3.4.1.3. Global expansion and financial inclusion
- 3.4.1. Drivers
- 3.4.2. Restraints
- 3.4.2.1. Regulatory challenges
- 3.4.3. Opportunities
- 3.4.3.1. Expanded customer base
- 3.5. COVID-19 Impact Analysis on the market
CHAPTER 4: EMBEDDED FINANCE MARKET, BY TYPE
- 4.1. Overview
- 4.1.1. Market size and forecast
- 4.2. Embedded Payment
- 4.2.1. Key market trends, growth factors and opportunities
- 4.2.2. Market size and forecast, by region
- 4.2.3. Market share analysis by country
- 4.3. Embedded Lending
- 4.3.1. Key market trends, growth factors and opportunities
- 4.3.2. Market size and forecast, by region
- 4.3.3. Market share analysis by country
- 4.4. Embedded Investment
- 4.4.1. Key market trends, growth factors and opportunities
- 4.4.2. Market size and forecast, by region
- 4.4.3. Market share analysis by country
- 4.5. Embedded Insurance
- 4.5.1. Key market trends, growth factors and opportunities
- 4.5.2. Market size and forecast, by region
- 4.5.3. Market share analysis by country
CHAPTER 5: EMBEDDED FINANCE MARKET, BY INDUSTRY VERTICAL
- 5.1. Overview
- 5.1.1. Market size and forecast
- 5.2. Retail and E-Commerce
- 5.2.1. Key market trends, growth factors and opportunities
- 5.2.2. Market size and forecast, by region
- 5.2.3. Market share analysis by country
- 5.3. Transportation and Logistics
- 5.3.1. Key market trends, growth factors and opportunities
- 5.3.2. Market size and forecast, by region
- 5.3.3. Market share analysis by country
- 5.4. Healthcare
- 5.4.1. Key market trends, growth factors and opportunities
- 5.4.2. Market size and forecast, by region
- 5.4.3. Market share analysis by country
- 5.5. Media and Entertainment
- 5.5.1. Key market trends, growth factors and opportunities
- 5.5.2. Market size and forecast, by region
- 5.5.3. Market share analysis by country
- 5.6. Others
- 5.6.1. Key market trends, growth factors and opportunities
- 5.6.2. Market size and forecast, by region
- 5.6.3. Market share analysis by country
CHAPTER 6: EMBEDDED FINANCE MARKET, BY REGION
- 6.1. Overview
- 6.1.1. Market size and forecast By Region
- 6.2. North America
- 6.2.1. Key trends and opportunities
- 6.2.2. Market size and forecast, by Type
- 6.2.3. Market size and forecast, by Industry Vertical
- 6.2.4. Market size and forecast, by country
- 6.2.4.1. U.S.
- 6.2.4.1.1. Key market trends, growth factors and opportunities
- 6.2.4.1.2. Market size and forecast, by Type
- 6.2.4.1.3. Market size and forecast, by Industry Vertical
- 6.2.4.2. Canada
- 6.2.4.2.1. Key market trends, growth factors and opportunities
- 6.2.4.2.2. Market size and forecast, by Type
- 6.2.4.2.3. Market size and forecast, by Industry Vertical
- 6.3. Europe
- 6.3.1. Key trends and opportunities
- 6.3.2. Market size and forecast, by Type
- 6.3.3. Market size and forecast, by Industry Vertical
- 6.3.4. Market size and forecast, by country
- 6.3.4.1. UK
- 6.3.4.1.1. Key market trends, growth factors and opportunities
- 6.3.4.1.2. Market size and forecast, by Type
- 6.3.4.1.3. Market size and forecast, by Industry Vertical
- 6.3.4.2. Germany
- 6.3.4.2.1. Key market trends, growth factors and opportunities
- 6.3.4.2.2. Market size and forecast, by Type
- 6.3.4.2.3. Market size and forecast, by Industry Vertical
- 6.3.4.3. France
- 6.3.4.3.1. Key market trends, growth factors and opportunities
- 6.3.4.3.2. Market size and forecast, by Type
- 6.3.4.3.3. Market size and forecast, by Industry Vertical
- 6.3.4.4. Italy
- 6.3.4.4.1. Key market trends, growth factors and opportunities
- 6.3.4.4.2. Market size and forecast, by Type
- 6.3.4.4.3. Market size and forecast, by Industry Vertical
- 6.3.4.5. Spain
- 6.3.4.5.1. Key market trends, growth factors and opportunities
- 6.3.4.5.2. Market size and forecast, by Type
- 6.3.4.5.3. Market size and forecast, by Industry Vertical
- 6.3.4.6. Rest of Europe
- 6.3.4.6.1. Key market trends, growth factors and opportunities
- 6.3.4.6.2. Market size and forecast, by Type
- 6.3.4.6.3. Market size and forecast, by Industry Vertical
- 6.4. Asia-Pacific
- 6.4.1. Key trends and opportunities
- 6.4.2. Market size and forecast, by Type
- 6.4.3. Market size and forecast, by Industry Vertical
- 6.4.4. Market size and forecast, by country
- 6.4.4.1. China
- 6.4.4.1.1. Key market trends, growth factors and opportunities
- 6.4.4.1.2. Market size and forecast, by Type
- 6.4.4.1.3. Market size and forecast, by Industry Vertical
- 6.4.4.2. Japan
- 6.4.4.2.1. Key market trends, growth factors and opportunities
- 6.4.4.2.2. Market size and forecast, by Type
- 6.4.4.2.3. Market size and forecast, by Industry Vertical
- 6.4.4.3. India
- 6.4.4.3.1. Key market trends, growth factors and opportunities
- 6.4.4.3.2. Market size and forecast, by Type
- 6.4.4.3.3. Market size and forecast, by Industry Vertical
- 6.4.4.4. Australia
- 6.4.4.4.1. Key market trends, growth factors and opportunities
- 6.4.4.4.2. Market size and forecast, by Type
- 6.4.4.4.3. Market size and forecast, by Industry Vertical
- 6.4.4.5. South Korea
- 6.4.4.5.1. Key market trends, growth factors and opportunities
- 6.4.4.5.2. Market size and forecast, by Type
- 6.4.4.5.3. Market size and forecast, by Industry Vertical
- 6.4.4.6. Rest of Asia-Pacific
- 6.4.4.6.1. Key market trends, growth factors and opportunities
- 6.4.4.6.2. Market size and forecast, by Type
- 6.4.4.6.3. Market size and forecast, by Industry Vertical
- 6.5. LAMEA
- 6.5.1. Key trends and opportunities
- 6.5.2. Market size and forecast, by Type
- 6.5.3. Market size and forecast, by Industry Vertical
- 6.5.4. Market size and forecast, by country
- 6.5.4.1. Latin America
- 6.5.4.1.1. Key market trends, growth factors and opportunities
- 6.5.4.1.2. Market size and forecast, by Type
- 6.5.4.1.3. Market size and forecast, by Industry Vertical
- 6.5.4.2. Middle East
- 6.5.4.2.1. Key market trends, growth factors and opportunities
- 6.5.4.2.2. Market size and forecast, by Type
- 6.5.4.2.3. Market size and forecast, by Industry Vertical
- 6.5.4.3. Africa
- 6.5.4.3.1. Key market trends, growth factors and opportunities
- 6.5.4.3.2. Market size and forecast, by Type
- 6.5.4.3.3. Market size and forecast, by Industry Vertical
CHAPTER 7: COMPETITIVE LANDSCAPE
- 7.1. Introduction
- 7.2. Top winning strategies
- 7.3. Product Mapping of Top 10 Player
- 7.4. Competitive Dashboard
- 7.5. Competitive Heatmap
- 7.6. Top player positioning, 2022
CHAPTER 8: COMPANY PROFILES
- 8.1. Block, Inc.
- 8.1.1. Company overview
- 8.1.2. Key Executives
- 8.1.3. Company snapshot
- 8.1.4. Operating business segments
- 8.1.5. Product portfolio
- 8.2. Cybrid Technology Inc
- 8.2.1. Company overview
- 8.2.2. Key Executives
- 8.2.3. Company snapshot
- 8.2.4. Operating business segments
- 8.2.5. Product portfolio
- 8.3. Fortis Payment Systems, LLC ("Fortis")
- 8.3.1. Company overview
- 8.3.2. Key Executives
- 8.3.3. Company snapshot
- 8.3.4. Operating business segments
- 8.3.5. Product portfolio
- 8.3.6. Key strategic moves and developments
- 8.4. Finastra International Limited
- 8.4.1. Company overview
- 8.4.2. Key Executives
- 8.4.3. Company snapshot
- 8.4.4. Operating business segments
- 8.4.5. Product portfolio
- 8.4.6. Key strategic moves and developments
- 8.5. FinBox
- 8.5.1. Company overview
- 8.5.2. Key Executives
- 8.5.3. Company snapshot
- 8.5.4. Operating business segments
- 8.5.5. Product portfolio
- 8.5.6. Key strategic moves and developments
- 8.6. Lendflow
- 8.6.1. Company overview
- 8.6.2. Key Executives
- 8.6.3. Company snapshot
- 8.6.4. Operating business segments
- 8.6.5. Product portfolio
- 8.6.6. Key strategic moves and developments
- 8.7. PAYRIX
- 8.7.1. Company overview
- 8.7.2. Key Executives
- 8.7.3. Company snapshot
- 8.7.4. Operating business segments
- 8.7.5. Product portfolio
- 8.7.6. Key strategic moves and developments
- 8.8. PayPal Holdings, Inc
- 8.8.1. Company overview
- 8.8.2. Key Executives
- 8.8.3. Company snapshot
- 8.8.4. Operating business segments
- 8.8.5. Product portfolio
- 8.8.6. Business performance
- 8.9. Stripe
- 8.9.1. Company overview
- 8.9.2. Key Executives
- 8.9.3. Company snapshot
- 8.9.4. Operating business segments
- 8.9.5. Product portfolio
- 8.9.6. Key strategic moves and developments
- 8.10. Zopa Bank Limited
- 8.10.1. Company overview
- 8.10.2. Key Executives
- 8.10.3. Company snapshot
- 8.10.4. Operating business segments
- 8.10.5. Product portfolio
- 8.10.6. Key strategic moves and developments