|
|
市場調査レポート
商品コード
1132028
コンピューターグラフィックスの世界市場 (2022~2030年):成長・将来の展望・競合分析Computer Graphics Market - Growth, Future Prospects and Competitive Analysis, 2022 - 2030 |
||||||
|
|
|||||||


| コンピューターグラフィックスの世界市場 (2022~2030年):成長・将来の展望・競合分析 |
|
出版日: 2022年08月11日
発行: Acute Market Reports
ページ情報: 英文 115 Pages
納期: 即日から翌営業日
|
- 全表示
- 概要
- 図表
- 目次
コンピューターグラフィックスの市場規模は、2021年の1,975億米ドルから、2022年から2030年の予測期間中は7.0%のCAGRで成長すると予測されています。
世界市場での革新的な新技術への需要が同市場を牽引するもっとも顕著な要因となっています。また、企業におけるデジタル化への需要の増加や、デジタル化のメリットに対する意識の高まりも市場の需要を後押ししていると思われます。
当レポートでは、世界のコンピューターグラフィックスの市場を調査し、市場概要、市場成長への各種影響因子の分析、市場規模の推移・予測、各種区分・地域/主要国別の内訳、主要企業のプロファイルなどをまとめています。
目次
第1章 序文
第2章 エグゼクティブサマリー
第3章 コンピューターグラフィックス市場:事業の展望・市場力学
- 市場規模:2020年~2030年
- 市場力学
- 市場促進要因
- 市場抑制要因
- 主な課題
- 主な機会
- 促進要因・抑制要因の影響分析
- シーソー分析
- ポーターのファイブフォースモデル
- PESTEL分析
第4章 コンピューターグラフィックス市場:コンポーネント別
- 市場概要
- 成長・収益分析:2021年・2030年
- 市場の分類
- アプリケーション
- ハードウェア
第5章 コンピューターグラフィックス市場:用途別
- 市場概要
- 成長・収益分析:2021年・2030年
- 市場の分類
- CAD
- 画像処理
- エンターテイメント
- ユーザーインターフェース
第6章 コンピューターグラフィックス市場:産業別
- 市場概要
- 成長・収益分析:2021年・2030年
- 市場の分類
- 自動車
- ヘルスケア
- 航空宇宙・防衛
- メディア&エンターテイメント
- 製造
第7章 北米のコンピューターグラフィックス市場
- 市場概要
- コンピューターグラフィックス市場:コンポーネント別
- コンピューターグラフィックス市場:用途別
- コンピューターグラフィックス市場:産業別
- コンピューターグラフィックス市場:地域別
第8章 英国およびEUのコンピューターグラフィックス市場
- 市場概要
- コンピューターグラフィックス市場:コンポーネント別
- コンピューターグラフィックス市場:用途別
- コンピューターグラフィックス市場:産業別
- コンピューターグラフィックス市場:地域別
第9章 アジア太平洋のコンピューターグラフィックス市場
- 市場概要
- コンピューターグラフィックス市場:コンポーネント別
- コンピューターグラフィックス市場:用途別
- コンピューターグラフィックス市場:産業別
- コンピューターグラフィックス市場:地域別
第10章 ラテンアメリカのコンピューターグラフィックス市場
- 市場概要
- コンピューターグラフィックス市場:コンポーネント別
- コンピューターグラフィックス市場:用途別
- コンピューターグラフィックス市場:産業別
- コンピューターグラフィックス市場:地域別
第11章 中東およびアフリカのコンピューターグラフィックス市場
- 市場概要
- コンピューターグラフィックス市場:コンポーネント別
- コンピューターグラフィックス市場:用途別
- コンピューターグラフィックス市場:産業別
- コンピューターグラフィックス市場:地域別
第12章 企業プロファイル
- Microsoft Corporation
- Intel Corporation
- Advanced Micro Devices(AMD), Inc.
- ARM Ltd.
- Adobe Systems Ltd.
- Imagination Technologies Limited
- Sony Corporation
- Nvidia Corporation
- Siemens PLM Software
- Autodesk Inc
- Dassault Systemes SA.
List of Tables
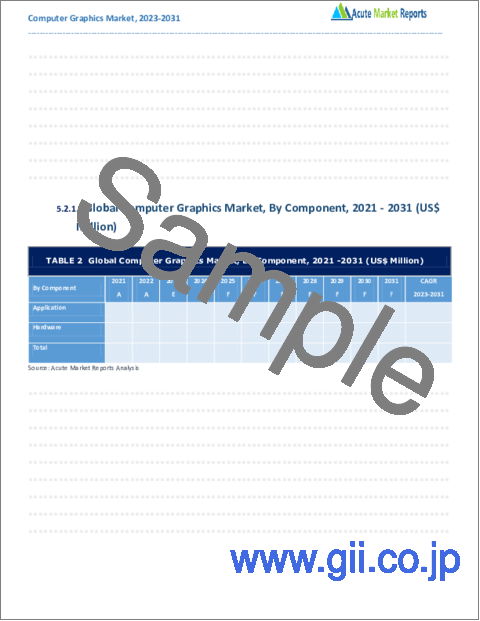
- TABLE 1 Global Computer Graphics Market By Component, 2020-2030, USD (Million)
- TABLE 2 Global Computer Graphics Market By Application, 2020-2030, USD (Million)
- TABLE 3 Global Computer Graphics Market By Industry Vertical, 2020-2030, USD (Million)
- TABLE 4 North America Computer Graphics Market By Component, 2020-2030, USD (Million)
- TABLE 5 North America Computer Graphics Market By Application, 2020-2030, USD (Million)
- TABLE 6 North America Computer Graphics Market By Industry Vertical, 2020-2030, USD (Million)
- TABLE 7 UK and European Union Computer Graphics Market By Component, 2020-2030, USD (Million)
- TABLE 8 UK and European Union Computer Graphics Market By Application, 2020-2030, USD (Million)
- TABLE 9 UK and European Union Computer Graphics Market By Industry Vertical, 2020-2030, USD (Million)
- TABLE 10 Asia Pacific Computer Graphics Market By Component, 2020-2030, USD (Million)
- TABLE 11 Asia Pacific Computer Graphics Market By Application, 2020-2030, USD (Million)
- TABLE 12 Asia Pacific Computer Graphics Market By Industry Vertical, 2020-2030, USD (Million)
- TABLE 13 Latin America Computer Graphics Market By Component, 2020-2030, USD (Million)
- TABLE 14 Latin America Computer Graphics Market By Application, 2020-2030, USD (Million)
- TABLE 15 Latin America Computer Graphics Market By Industry Vertical, 2020-2030, USD (Million)
- TABLE 16 Middle East and Africa Computer Graphics Market By Component, 2020-2030, USD (Million)
- TABLE 17 Middle East and Africa Computer Graphics Market By Application, 2020-2030, USD (Million)
- TABLE 18 Middle East and Africa Computer Graphics Market By Industry Vertical, 2020-2030, USD (Million)
List of Figures
- FIG. 1 Global Computer Graphics Market: Market Coverage
- FIG. 2 Research Methodology and Data Sources
- FIG. 3 Market Size Estimation - Top Down & Bottom-Up Approach
- FIG. 4 Global Computer Graphics Market: Quality Assurance
- FIG. 5 Global Computer Graphics Market, By Component, 2021
- FIG. 6 Global Computer Graphics Market, By Application, 2021
- FIG. 7 Global Computer Graphics Market, By Industry Vertical, 2021
- FIG. 8 Global Computer Graphics Market, By Geography, 2021
- FIG. 9 Global Computer Graphics Market, By Component, 2021 Vs 2030, %
- FIG. 10 Global Computer Graphics Market, By Application, 2021 Vs 2030, %
- FIG. 11 Global Computer Graphics Market, By Industry Vertical, 2021 Vs 2030, %
- FIG. 12 U.S. Computer Graphics Market (US$ Million), 2020 - 2030
- FIG. 13 Canada Computer Graphics Market (US$ Million), 2020 - 2030
- FIG. 14 Rest of North America Computer Graphics Market (US$ Million), 2020 - 2030
- FIG. 15 UK Computer Graphics Market (US$ Million), 2020 - 2030
- FIG. 16 Germany Computer Graphics Market (US$ Million), 2020 - 2030
- FIG. 17 Spain Computer Graphics Market (US$ Million), 2020 - 2030
- FIG. 18 Italy Computer Graphics Market (US$ Million), 2020 - 2030
- FIG. 19 France Computer Graphics Market (US$ Million), 2020 - 2030
- FIG. 20 Rest of Europe Computer Graphics Market (US$ Million), 2020 - 2030
- FIG. 21 China Computer Graphics Market (US$ Million), 2020 - 2030
- FIG. 22 Japan Computer Graphics Market (US$ Million), 2020 - 2030
- FIG. 23 India Computer Graphics Market (US$ Million), 2020 - 2030
- FIG. 24 Australia Computer Graphics Market (US$ Million), 2020 - 2030
- FIG. 25 South Korea Computer Graphics Market (US$ Million), 2020 - 2030
- FIG. 26 Rest of Asia Computer Graphics Market (US$ Million), 2020 - 2030
- FIG. 27 Brazil Computer Graphics Market (US$ Million), 2020 - 2030
- FIG. 28 Mexico Computer Graphics Market (US$ Million), 2020 - 2030
- FIG. 29 Rest of Latin America Computer Graphics Market (US$ Million), 2020 - 2030
- FIG. 30 GCC Computer Graphics Market (US$ Million), 2020 - 2030
- FIG. 31 Africa Computer Graphics Market (US$ Million), 2020 - 2030
- FIG. 32 Rest of Middle East and Africa Computer Graphics Market (US$ Million), 2020 - 2030
Demand for Innovative Technology to Boost the Demand for Computer Graphics Market
The computer graphics market worldwide is set to expand with a CAGR of 7.0% over the estimation period from 2022 to 2030, starting from US$ 197.5 Bn in the year 2021. The demand for new and innovative technologies in the global market is the most prominent aspect driving the computer graphics market. Computer graphics are the visual representation of data displayed on the monitor or screen. Thus, they have enhanced the mode of communication between computers and users. Further, the increase in demand for digitalization in corporate and rising awareness towards benefits for the same shall back the demand in the market. Thus, we estimate that the computer graphics market will show significant growth over the forecast period.
Hardware Segment will led the Market
In the previous year, global computer graphics market was segmented into application and hardware sub-segments. Hardware enables to pin the different applications of computer graphics along with associated tools and technologies. Hardware includes various critical components like graphic cards, graphic processing units, storage, RAM, 3D scanners, etc. Backed by the expensiveness of these critical components, the hardware sub-segment shall continue to lead the computer graphics market. Thus, we expect that the hardware segment will show dominance during the forecast period 2022-2030.
North America will led the Market
In 2021, North America led the computer graphics market. North America accounts for more than 2/5th of the market share in 2020. Asia Pacific has its dominance due to largest manufacturing hub for smartphones, tablets and other smart devices. Owing to presence of various local and regional manufacturers and developers of software and hardware, the computer graphics market shall flourish in the Asia Pacific region. Further, outsourced work from North America shall back the growth of the computer graphics market in emerging economies of India and China. As a result, we expect that Asia Pacific region will grow at a significant pace throughout the forecast period.
Some of the prominent players operating in the computer graphics market: Microsoft Corporation, Intel Corporation, Advanced Micro Devices (AMD), Inc., ARM Ltd., Adobe Systems Ltd., Imagination Technologies Limited, Sony Corporation, Nvidia Corporation, Siemens PLM Software, Autodesk Inc. and Dassault Systemes SA. among others.
Historical & Forecast Period:
This study report represents analysis of each segment from 2020 to 2030 considering 2021 as the base year. Compounded Annual Growth Rate (CAGR) for each of the respective segments estimated for the forecast period of 2022 to 2030.
The current report comprises of quantitative market estimations for each micro market for every geographical region and qualitative market analysis such as micro and macro environment analysis, market trends, competitive intelligence, segment analysis, porters five force model, top winning strategies, top investment markets, emerging trends and technological analysis, case studies, strategic conclusions and recommendations and other key market insights.
Research Methodology
The complete research study was conducted in three phases, namely: secondary research, primary research, and expert panel review. key data point that enables the estimation of Computer Graphics market are as follows:
- Research and development budgets of manufacturers and government spending
- Revenues of key companies in the market segment
- Number of end users and consumption volume, price and value.
- Geographical revenues generate by countries considered in the report
- Micro and macro environment factors that are currently influencing the Computer Graphics market and their expected impact during the forecast period.
Market forecast was performed through proprietary software that analyzes various qualitative and quantitative factors. Growth rate and CAGR were estimated through intensive secondary and primary research. Data triangulation across various data points provides accuracy across various analyzed market segments in the report. Application of both top down and bottom-up approach for validation of market estimation assures logical, methodical and mathematical consistency of the quantitative data.
ATTRIBUTE DETAILS
- Research Period: 2020-2030
- Base Year: 2021
- Forecast Period: 2022-2030
- Historical Year: 2020
- Unit: USD Million
Segmentation
Component
- Application
- Hardware
Application
- CAD
- Image Processing
- Entertainment
- User-Interfaces
Industry Vertical
- Automotive
- Healthcare
- Aerospace & Defense
- Media & Entertainment
- Manufacturing
Region Segment (2020-2030; US$ Million)
- North America
- U.S.
- Canada
- Rest of North America
- UK and European Union
- UK
- Germany
- Spain
- Italy
- France
- Rest of Europe
- Asia Pacific
- China
- Japan
- India
- Australia
- South Korea
- Rest of Asia Pacific
- Latin America
- Brazil
- Mexico
- Rest of Latin America
- Middle East and Africa
- GCC
- Africa
- Rest of Middle East and Africa
Global Impact of COVID-19 Segment (2020-2021; US$ Million )
- Pre COVID-19 situation
- Post COVID-19 situation
Key questions answered in this report:
- What are the key micro and macro environmental factors that are impacting the growth of Computer Graphics market?
- What are the key investment pockets with respect to product segments and geographies currently and during the forecast period?
- Estimated forecast and market projections up to 2030.
- Which segment accounts for the fastest CAGR during the forecast period?
- Which market segment holds a larger market share and why?
- Are low and middle-income economies investing in the Computer Graphics market?
- Which is the largest regional market for Computer Graphics market?
- What are the market trends and dynamics in emerging markets such as Asia Pacific, Latin America, and Middle East & Africa?
- Which are the key trends driving Computer Graphics market growth?
- Who are the key competitors and what are their key strategies to enhance their market presence in the Computer Graphics market worldwide?
Table of Contents
1. Preface
- 1.1. Report Description
- 1.1.1. Purpose of the Report
- 1.1.2. Target Audience
- 1.1.3. Key Offerings
- 1.2. Market Segmentation
- 1.3. Research Methodology
- 1.3.1. Phase I - Secondary Research
- 1.3.2. Phase II - Primary Research
- 1.3.3. Phase III - Expert Panel Review
- 1.3.4. Assumptions
- 1.3.5. Approach Adopted
2. Executive Summary
- 2.1. Market Snapshot: Global Computer Graphics Market
- 2.2. Global Computer Graphics Market, By Component, 2021 (US$ Million)
- 2.3. Global Computer Graphics Market, By Application, 2021 (US$ Million)
- 2.4. Global Computer Graphics Market, By Industry Vertical, 2021 (US$ Million)
- 2.5. Global Computer Graphics Market, By Geography, 2021 (US$ Million)
- 2.6. Impact of Covid 19
- 2.7. Attractive Investment Proposition by Geography, 2021
- 2.8. Competitive Analysis
- 2.8.1. Market Positioning of Key Computer Graphics Market Vendors
- 2.8.2. Strategies Adopted by Computer Graphics Market Vendors
- 2.8.3. Key Industry Strategies
3. Computer Graphics Market: Business Outlook & Market Dynamics
- 3.1. Introduction
- 3.2. Global Computer Graphics Market Value, 2020 - 2030, (US$ Million)
- 3.3. Market Dynamics
- 3.3.1. Market Drivers
- 3.3.2. Market Restraints
- 3.3.3. Key Challenges
- 3.3.4. Key Opportunities
- 3.4. Impact Analysis of Drivers and Restraints
- 3.5. See-Saw Analysis
- 3.6. Porter's Five Force Model
- 3.6.1. Supplier Power
- 3.6.2. Buyer Power
- 3.6.3. Threat Of Substitutes
- 3.6.4. Threat Of New Entrants
- 3.6.5. Competitive Rivalry
- 3.7. PESTEL Analysis
- 3.7.1. Political Landscape
- 3.7.2. Economic Landscape
- 3.7.3. Technology Landscape
- 3.7.4. Legal Landscape
- 3.7.5. Social Landscape
4. Computer Graphics Market: By Component, 2020-2030, USD (Million)
- 4.1. Market Overview
- 4.2. Growth & Revenue Analysis: 2021 Versus 2030
- 4.3. Market Segmentation
- 4.3.1. Application
- 4.3.2. Hardware
5. Computer Graphics Market: By Application, 2020-2030, USD (Million)
- 5.1. Market Overview
- 5.2. Growth & Revenue Analysis: 2021 Versus 2030
- 5.3. Market Segmentation
- 5.3.1. CAD
- 5.3.2. Image Processing
- 5.3.3. Entertainment
- 5.3.4. User-Interfaces
6. Computer Graphics Market: By Industry Vertical, 2020-2030, USD (Million)
- 6.1. Market Overview
- 6.2. Growth & Revenue Analysis: 2021 Versus 2030
- 6.3. Market Segmentation
- 6.3.1. Automotive
- 6.3.2. Healthcare
- 6.3.3. Aerospace & Defense
- 6.3.4. Media & Entertainment
- 6.3.5. Manufacturing
7. North America Computer Graphics Market, 2020-2030, USD (Million)
- 7.1. Market Overview
- 7.2. Computer Graphics Market: By Component, 2020-2030, USD (Million)
- 7.3. Computer Graphics Market: By Application, 2020-2030, USD (Million)
- 7.4. Computer Graphics Market: By Industry Vertical, 2020-2030, USD (Million)
- 7.5.Computer Graphics Market: By Region, 2020-2030, USD (Million)
- 7.5.1.North America
- 7.5.1.1. U.S.
- 7.5.1.2. Canada
- 7.5.1.3. Rest of North America
- 7.5.1.North America
8. UK and European Union Computer Graphics Market, 2020-2030, USD (Million)
- 8.1. Market Overview
- 8.2. Computer Graphics Market: By Component, 2020-2030, USD (Million)
- 8.3. Computer Graphics Market: By Application, 2020-2030, USD (Million)
- 8.4. Computer Graphics Market: By Industry Vertical, 2020-2030, USD (Million)
- 8.5.Computer Graphics Market: By Region, 2020-2030, USD (Million)
- 8.5.1.UK and European Union
- 8.5.1.1. UK
- 8.5.1.2. Germany
- 8.5.1.3. Spain
- 8.5.1.4. Italy
- 8.5.1.5. France
- 8.5.1.6. Rest of Europe
- 8.5.1.UK and European Union
9. Asia Pacific Computer Graphics Market, 2020-2030, USD (Million)
- 9.1. Market Overview
- 9.2. Computer Graphics Market: By Component, 2020-2030, USD (Million)
- 9.3. Computer Graphics Market: By Application, 2020-2030, USD (Million)
- 9.4. Computer Graphics Market: By Industry Vertical, 2020-2030, USD (Million)
- 9.5.Computer Graphics Market: By Region, 2020-2030, USD (Million)
- 9.5.1.Asia Pacific
- 9.5.1.1. China
- 9.5.1.2. Japan
- 9.5.1.3. India
- 9.5.1.4. Australia
- 9.5.1.5. South Korea
- 9.5.1.6. Rest of Asia Pacific
- 9.5.1.Asia Pacific
10. Latin America Computer Graphics Market, 2020-2030, USD (Million)
- 10.1. Market Overview
- 10.2. Computer Graphics Market: By Component, 2020-2030, USD (Million)
- 10.3. Computer Graphics Market: By Application, 2020-2030, USD (Million)
- 10.4. Computer Graphics Market: By Industry Vertical, 2020-2030, USD (Million)
- 10.5.Computer Graphics Market: By Region, 2020-2030, USD (Million)
- 10.5.1.Latin America
- 10.5.1.1. Brazil
- 10.5.1.2. Mexico
- 10.5.1.3. Rest of Latin America
- 10.5.1.Latin America
11. Middle East and Africa Computer Graphics Market, 2020-2030, USD (Million)
- 11.1. Market Overview
- 11.2. Computer Graphics Market: By Component, 2020-2030, USD (Million)
- 11.3. Computer Graphics Market: By Application, 2020-2030, USD (Million)
- 11.4. Computer Graphics Market: By Industry Vertical, 2020-2030, USD (Million)
- 11.5.Computer Graphics Market: By Region, 2020-2030, USD (Million)
- 11.5.1.Middle East and Africa
- 11.5.1.1. GCC
- 11.5.1.2. Africa
- 11.5.1.3. Rest of Middle East and Africa
- 11.5.1.Middle East and Africa
12. Company Profile
- 12.1. Microsoft Corporation
- 12.1.1. Company Overview
- 12.1.2. Financial Performance
- 12.1.3. Product Portfolio
- 12.1.4. Strategic Initiatives
- 12.2. Intel Corporation
- 12.2.1. Company Overview
- 12.2.2. Financial Performance
- 12.2.3. Product Portfolio
- 12.2.4. Strategic Initiatives
- 12.3. Advanced Micro Devices (AMD), Inc.
- 12.3.1. Company Overview
- 12.3.2. Financial Performance
- 12.3.3. Product Portfolio
- 12.3.4. Strategic Initiatives
- 12.4. ARM Ltd.
- 12.4.1. Company Overview
- 12.4.2. Financial Performance
- 12.4.3. Product Portfolio
- 12.4.4. Strategic Initiatives
- 12.5. Adobe Systems Ltd.
- 12.5.1. Company Overview
- 12.5.2. Financial Performance
- 12.5.3. Product Portfolio
- 12.5.4. Strategic Initiatives
- 12.6. Imagination Technologies Limited
- 12.6.1. Company Overview
- 12.6.2. Financial Performance
- 12.6.3. Product Portfolio
- 12.6.4. Strategic Initiatives
- 12.7. Sony Corporation
- 12.7.1. Company Overview
- 12.7.2. Financial Performance
- 12.7.3. Product Portfolio
- 12.7.4. Strategic Initiatives
- 12.8. Nvidia Corporation
- 12.8.1. Company Overview
- 12.8.2. Financial Performance
- 12.8.3. Product Portfolio
- 12.8.4. Strategic Initiatives
- 12.9. Siemens PLM Software
- 12.9.1. Company Overview
- 12.9.2. Financial Performance
- 12.9.3. Product Portfolio
- 12.9.4. Strategic Initiatives
- 12.10. Autodesk Inc
- 12.10.1. Company Overview
- 12.10.2. Financial Performance
- 12.10.3. Product Portfolio
- 12.10.4. Strategic Initiatives
- 12.11. Dassault Systemes SA.
- 12.11.1. Company Overview
- 12.11.2. Financial Performance
- 12.11.3. Product Portfolio
- 12.11.4. Strategic Initiatives