|
|
市場調査レポート
商品コード
1373581
コンピュータグラフィックス (CG) の世界市場 (2016-2030年):展開・用途・エンドユーザー・地域別の機会および予測Computer Graphics Market Assessment, By Deployment, By Application, By End-user, By Region, Opportunities, and Forecast, 2016-2030F |
||||||
|
|
|||||||
カスタマイズ可能
|
|||||||


| コンピュータグラフィックス (CG) の世界市場 (2016-2030年):展開・用途・エンドユーザー・地域別の機会および予測 |
|
出版日: 2023年11月03日
発行: Markets & Data
ページ情報: 英文 147 Pages
納期: 3~5営業日
|

全表示
- 概要
- 図表
- 目次
世界のコンピュータグラフィックス (CG) の市場は、近年大きな成長を遂げており、今後も力強い拡大ペースを維持すると予測されています。市場規模は2022年の約316億7,000万米ドルから、予測期間中は6.1%のCAGRで推移し、2030年には508億6,000万米ドルの規模に成長すると予測されています。
ゲーム産業がCG産業に大きな需要を創出
現代のビデオゲームは、ゲーマーを魅了するために、ますますリアルで没入感のあるグラフィックスを要求しています。GPUは、詳細なキャラクターモデルから、複雑なテクスチャや照明効果を持つ広大なゲーム世界まで、リアルなビジュアルをレンダリングするために不可欠です。特に、PCゲームは成長を続けており、愛好家たちはハイエンドGPUを搭載したカスタムゲーミングリグを構築しています。これらのGPUは、ゲームを最高設定で実行し、高いフレームレートを達成するために不可欠であり、優れたゲーム体験を提供できます。さらに、eスポーツや競合ゲームの台頭により、スムーズで応答性の高いゲームプレイを実現できる高リフレッシュレートのモニターやGPUに対する需要が生まれています。プロゲーマーは、競争力を高めるために一流のGPUに投資することが多く、これが市場をさらに加速させています。
CG市場に影響を与えるARとVRの実装
拡張現実(AR)と仮想現実(VR)は、コンピューターグラフィックスの分野で大きな影響力を持ち、技術革新を推進し、高度なビジュアル技術の開発を形成しています。ARおよびVRの用途では、高品質でリアルタイムの3Dグラフィックスをレンダリングするために、強力なGPUとグラフィックスハードウェアが必要です。より高性能なハードウェアへの要求は、GPU技術の革新につながり、コンピュータグラフィックス (CG) で可能なことの限界を押し広げています。
北米地域がCG市場で最大のシェア
2022年には、北米地域が全体の市場をリードし、28%超の大幅な市場シェアを示しました。北米におけるゲーム産業の著しい躍進が、市場拡大の大きな起爆剤となっています。この地域はゲーム開発と消費の活気あるハブであり、視覚的に美しく没入感のあるゲーム体験を切望する幅広い視聴者がいます。
当レポートでは、世界のコンピュータグラフィックス (CG) の市場を調査し、市場の定義と概要、市場規模の推移・予測、各種区分・地域別の詳細分析、産業構造、市場成長への影響因子の分析、ケーススタディ、競合情勢、主要企業のプロファイルなどをまとめています。
目次
第1章 調査手法
第2章 プロジェクトの範囲と定義
第3章 世界のコンピュータグラフィックス (CG) 市場に対するCOVID-19の影響
第4章 エグゼクティブサマリー
第5章 世界のコンピュータグラフィックス (CG) 市場の展望
- 市場規模・予測
- 展開別
- ハードウェア
- ソフトウェア
- 用途別
- アニメーション
- エンジニアリング設計・3Dモデリング
- AR&VR
- データの視覚化
- その他
- エンドユーザー別
- メディア&エンターテイメント
- ヘルスケア
- 自動車
- BFSI
- その他
- 地域別
- 北米
- 欧州
- 南米
- アジア太平洋
- 中東・アフリカ
- 企業シェア
第6章 世界のコンピュータグラフィックス (CG) 市場の展望:地域別
- 北米
- 欧州
- 南米
- アジア太平洋
- 中東・アフリカ
- 市場規模・予測
- 展開別
- 用途別
- エンドユーザー別
- 国別
第7章 市場マッピング
第8章 マクロ環境と産業構造
- PESTEL分析
- ポーターのファイブフォース分析
第9章 市場力学
- 成長促進因子
- 成長抑制因子 (課題・制約)
第10章 主要企業の情勢
- 市場リーダー上位5社の競合マトリックス
- 市場リーダー上位5社の市場収益分析
- M&A・ジョイントベンチャー (該当する場合)
- SWOT分析 (参入5社)
- 特許分析 (該当する場合)
第11章 ケーススタディ
第12章 主要企業の見通し
- NVIDIA Corporation
- Advanced Micro Devices, Inc.
- Intel Corporation
- Apple Inc.
- ASUSTeK Computer Inc.
- GIGA-BYTE Technology Co., Ltd.
- Micro-Star International Co., Ltd.
- SAPPHIRE Technology Limited
- Qualcomm Technologies, Inc.
- Matrox Graphics, Inc.
第13章 戦略的推奨事項
第14章 当社について・免責事項
List of Tables
- Table 1. Pricing Analysis of Products from Key Players
- Table 2. Competition Matrix of Top 5 Market Leaders
- Table 3. Mergers & Acquisitions/ Joint Ventures (If Applicable)
- Table 4. About Us - Regions and Countries Where We Have Executed Client Projects
List of Figures
- Figure 1. Global Computer Graphics Market, By Value, In USD Billion, 2016-2030F
- Figure 2. Global Computer Graphics Market Share, By Deployment, In USD Billion, 2016-2030F
- Figure 3. Global Computer Graphics Market Share, By Application, In USD Billion, 2016-2030F
- Figure 4. Global Computer Graphics Market Share, By End-user, In USD Billion, 2016-2030F
- Figure 5. Global Computer Graphics Market Share, By Region, In USD Billion, 2016-2030F
- Figure 6. North America Computer Graphics Market, By Value, In USD Billion, 2016-2030F
- Figure 7. North America Computer Graphics Market Share, By Deployment, In USD Billion, 2016-2030F
- Figure 8. North America Computer Graphics Market Share, By Application, In USD Billion, 2016-2030F
- Figure 9. North America Computer Graphics Market Share, By End-user, In USD Billion, 2016-2030F
- Figure 10. North America Computer Graphics Market Share, By Country, In USD Billion, 2016-2030F
- Figure 11. United States Computer Graphics Market, By Value, In USD Billion, 2016-2030F
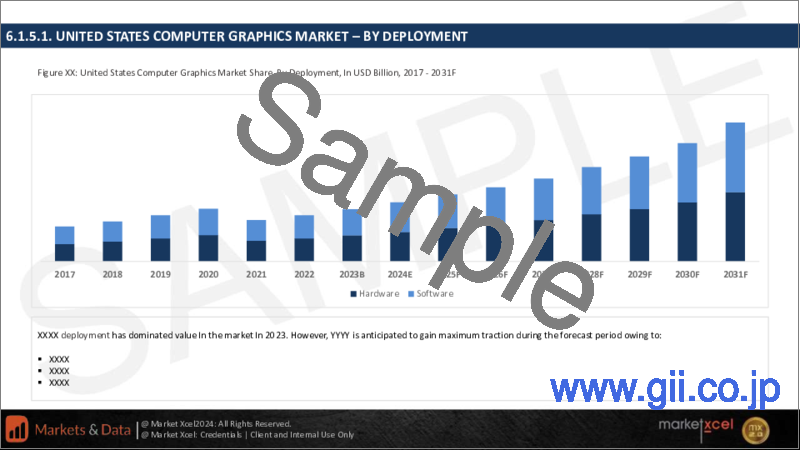
- Figure 12. United States Computer Graphics Market Share, By Deployment, In USD Billion, 2016-2030F
- Figure 13. United States Computer Graphics Market Share, By Application, In USD Billion, 2016-2030F
- Figure 14. United States Computer Graphics Market Share, By End-user, In USD Billion, 2016-2030F
- Figure 15. Canada Computer Graphics Market, By Value, In USD Billion, 2016-2030F
- Figure 16. Canada Computer Graphics Market Share, By Deployment, In USD Billion, 2016-2030F
- Figure 17. Canada Computer Graphics Market Share, By Application, In USD Billion, 2016-2030F
- Figure 18. Canada Computer Graphics Market Share, By End-user, In USD Billion, 2016-2030F
- Figure 19. Mexico Computer Graphics Market, By Value, In USD Billion, 2016-2030F
- Figure 20. Mexico Computer Graphics Market Share, By Deployment, In USD Billion, 2016-2030F
- Figure 21. Mexico Computer Graphics Market Share, By Application, In USD Billion, 2016-2030F
- Figure 22. Mexico Computer Graphics Market Share, By End-user, In USD Billion, 2016-2030F
- Figure 23. Europe Computer Graphics Market, By Value, In USD Billion, 2016-2030F
- Figure 24. Europe Computer Graphics Market Share, By Deployment, In USD Billion, 2016-2030F
- Figure 25. Europe Computer Graphics Market Share, By Application, In USD Billion, 2016-2030F
- Figure 26. Europe Computer Graphics Market Share, By End-user, In USD Billion, 2016-2030F
- Figure 27. Europe Computer Graphics Market Share, By Country, In USD Billion, 2016-2030F
- Figure 28. Germany Computer Graphics Market, By Value, In USD Billion, 2016-2030F
- Figure 29. Germany Computer Graphics Market Share, By Deployment, In USD Billion, 2016-2030F
- Figure 30. Germany Computer Graphics Market Share, By Application, In USD Billion, 2016-2030F
- Figure 31. Germany Computer Graphics Market Share, By End-user, In USD Billion, 2016-2030F
- Figure 32. France Computer Graphics Market, By Value, In USD Billion, 2016-2030F
- Figure 33. France Computer Graphics Market Share, By Deployment, In USD Billion, 2016-2030F
- Figure 34. France Computer Graphics Market Share, By Application, In USD Billion, 2016-2030F
- Figure 35. France Computer Graphics Market Share, By End-user, In USD Billion, 2016-2030F
- Figure 36. Italy Computer Graphics Market, By Value, In USD Billion, 2016-2030F
- Figure 37. Italy Computer Graphics Market Share, By Deployment, In USD Billion, 2016-2030F
- Figure 38. Italy Computer Graphics Market Share, By Application, In USD Billion, 2016-2030F
- Figure 39. Italy Computer Graphics Market Share, By End-user, In USD Billion, 2016-2030F
- Figure 40. United Kingdom Computer Graphics Market, By Value, In USD Billion, 2016-2030F
- Figure 41. United Kingdom Computer Graphics Market Share, By Deployment, In USD Billion, 2016-2030F
- Figure 42. United Kingdom Computer Graphics Market Share, By Application, In USD Billion, 2016-2030F
- Figure 43. United Kingdom Computer Graphics Market Share, By End-user, In USD Billion, 2016-2030F
- Figure 44. Russia Computer Graphics Market, By Value, In USD Billion, 2016-2030F
- Figure 45. Russia Computer Graphics Market Share, By Deployment, In USD Billion, 2016-2030F
- Figure 46. Russia Computer Graphics Market Share, By Application, In USD Billion, 2016-2030F
- Figure 47. Russia Computer Graphics Market Share, By End-user, In USD Billion, 2016-2030F
- Figure 48. Netherlands Computer Graphics Market, By Value, In USD Billion, 2016-2030F
- Figure 49. Netherlands Computer Graphics Market Share, By Deployment, In USD Billion, 2016-2030F
- Figure 50. Netherlands Computer Graphics Market Share, By Application, In USD Billion, 2016-2030F
- Figure 51. Netherlands Computer Graphics Market Share, By End-user, In USD Billion, 2016-2030F
- Figure 52. Spain Computer Graphics Market, By Value, In USD Billion, 2016-2030F
- Figure 53. Spain Computer Graphics Market Share, By Deployment, In USD Billion, 2016-2030F
- Figure 54. Spain Computer Graphics Market Share, By Application, In USD Billion, 2016-2030F
- Figure 55. Spain Computer Graphics Market Share, By End-user, In USD Billion, 2016-2030F
- Figure 56. Turkey Computer Graphics Market, By Value, In USD Billion, 2016-2030F
- Figure 57. Turkey Computer Graphics Market Share, By Deployment, In USD Billion, 2016-2030F
- Figure 58. Turkey Computer Graphics Market Share, By Application, In USD Billion, 2016-2030F
- Figure 59. Turkey Computer Graphics Market Share, By End-user, In USD Billion, 2016-2030F
- Figure 60. Poland Computer Graphics Market, By Value, In USD Billion, 2016-2030F
- Figure 61. Poland Computer Graphics Market Share, By Deployment, In USD Billion, 2016-2030F
- Figure 62. Poland Computer Graphics Market Share, By Application, In USD Billion, 2016-2030F
- Figure 63. Poland Computer Graphics Market Share, By End-user, In USD Billion, 2016-2030F
- Figure 64. South America Computer Graphics Market, By Value, In USD Billion, 2016-2030F
- Figure 65. South America Computer Graphics Market Share, By Deployment, In USD Billion, 2016-2030F
- Figure 66. South America Computer Graphics Market Share, By Application, In USD Billion, 2016-2030F
- Figure 67. South America Computer Graphics Market Share, By End-user, In USD Billion, 2016-2030F
- Figure 68. South America Computer Graphics Market Share, By Country, In USD Billion, 2016-2030F
- Figure 69. Brazil Computer Graphics Market, By Value, In USD Billion, 2016-2030F
- Figure 70. Brazil Computer Graphics Market Share, By Deployment, In USD Billion, 2016-2030F
- Figure 71. Brazil Computer Graphics Market Share, By Application, In USD Billion, 2016-2030F
- Figure 72. Brazil Computer Graphics Market Share, By End-user, In USD Billion, 2016-2030F
- Figure 73. Argentina Computer Graphics Market, By Value, In USD Billion, 2016-2030F
- Figure 74. Argentina Computer Graphics Market Share, By Deployment, In USD Billion, 2016-2030F
- Figure 75. Argentina Computer Graphics Market Share, By Application, In USD Billion, 2016-2030F
- Figure 76. Argentina Computer Graphics Market Share, By End-user, In USD Billion, 2016-2030F
- Figure 77. Asia-Pacific Computer Graphics Market, By Value, In USD Billion, 2016-2030F
- Figure 78. Asia-Pacific Computer Graphics Market Share, By Deployment, In USD Billion, 2016-2030F
- Figure 79. Asia-Pacific Computer Graphics Market Share, By Application, In USD Billion, 2016-2030F
- Figure 80. Asia-Pacific Computer Graphics Market Share, By End-user, In USD Billion, 2016-2030F
- Figure 81. Asia-Pacific Computer Graphics Market Share, By End-use Industry, In USD Billion, 2016-2030F
- Figure 82. Asia-Pacific Computer Graphics Market Share, By Country, In USD Billion, 2016-2030F
- Figure 83. India Computer Graphics Market, By Value, In USD Billion, 2016-2030F
- Figure 84. India Computer Graphics Market Share, By Deployment, In USD Billion, 2016-2030F
- Figure 85. India Computer Graphics Market Share, By Application, In USD Billion, 2016-2030F
- Figure 86. India Computer Graphics Market Share, By End-user, In USD Billion, 2016-2030F
- Figure 87. China Computer Graphics Market, By Value, In USD Billion, 2016-2030F
- Figure 88. China Computer Graphics Market Share, By Deployment, In USD Billion, 2016-2030F
- Figure 89. China Computer Graphics Market Share, By Application, In USD Billion, 2016-2030F
- Figure 90. China Computer Graphics Market Share, By End-user, In USD Billion, 2016-2030F
- Figure 91. Japan Computer Graphics Market, By Value, In USD Billion, 2016-2030F
- Figure 92. Japan Computer Graphics Market Share, By Deployment, In USD Billion, 2016-2030F
- Figure 93. Japan Computer Graphics Market Share, By Application, In USD Billion, 2016-2030F
- Figure 94. Japan Computer Graphics Market Share, By End-user, In USD Billion, 2016-2030F
- Figure 95. Australia Computer Graphics Market, By Value, In USD Billion, 2016-2030F
- Figure 96. Australia Computer Graphics Market Share, By Deployment, In USD Billion, 2016-2030F
- Figure 97. Australia Computer Graphics Market Share, By Application, In USD Billion, 2016-2030F
- Figure 98. Australia Computer Graphics Market Share, By End-user, In USD Billion, 2016-2030F
- Figure 99. Vietnam Computer Graphics Market, By Value, In USD Billion, 2016-2030F
- Figure 100. Vietnam Computer Graphics Market Share, By Deployment, In USD Billion, 2016-2030F
- Figure 101. Vietnam Computer Graphics Market Share, By Application, In USD Billion, 2016-2030F
- Figure 102. Vietnam Computer Graphics Market Share, By End-user, In USD Billion, 2016-2030F
- Figure 103. South Korea Computer Graphics Market, By Value, In USD Billion, 2016-2030F
- Figure 104. South Korea Computer Graphics Market Share, By Deployment, In USD Billion, 2016-2030F
- Figure 105. South Korea Computer Graphics Market Share, By Application, In USD Billion, 2016-2030F
- Figure 106. South Korea Computer Graphics Market Share, By End-user, In USD Billion, 2016-2030F
- Figure 107. Indonesia Computer Graphics Market, By Value, In USD Billion, 2016-2030F
- Figure 108. Indonesia Computer Graphics Market Share, By Deployment, In USD Billion, 2016-2030F
- Figure 109. Indonesia Computer Graphics Market Share, By Application, In USD Billion, 2016-2030F
- Figure 110. Indonesia Computer Graphics Market Share, By End-user, In USD Billion, 2016-2030F
- Figure 111. Philippines Computer Graphics Market, By Value, In USD Billion, 2016-2030F
- Figure 112. Philippines Computer Graphics Market Share, By Deployment, In USD Billion, 2016-2030F
- Figure 113. Philippines Computer Graphics Market Share, By Application, In USD Billion, 2016-2030F
- Figure 114. Philippines Computer Graphics Market Share, By End-user, In USD Billion, 2016-2030F
- Figure 115. Middle East & Africa Computer Graphics Market, By Value, In USD Billion, 2016-2030F
- Figure 116. Middle East & Africa Computer Graphics Market Share, By Deployment, In USD Billion, 2016-2030F
- Figure 117. Middle East & Africa Computer Graphics Market Share, By Application, In USD Billion, 2016-2030F
- Figure 118. Middle East & Africa Computer Graphics Market Share, By End-user, In USD Billion, 2016-2030F
- Figure 119. Middle East & Africa Computer Graphics Market Share, By Country, In USD Billion, 2016-2030F
- Figure 120. Saudi Arabia Computer Graphics Market, By Value, In USD Billion, 2016-2030F
- Figure 121. Saudi Arabia Computer Graphics Market Share, By Deployment, In USD Billion, 2016-2030F
- Figure 122. Saudi Arabia Computer Graphics Market Share, By Application, In USD Billion, 2016-2030F
- Figure 123. Saudi Arabia Computer Graphics Market Share, By End-user, In USD Billion, 2016-2030F
- Figure 124. UAE Computer Graphics Market, By Value, In USD Billion, 2016-2030F
- Figure 125. UAE Computer Graphics Market Share, By Deployment, In USD Billion, 2016-2030F
- Figure 126. UAE Computer Graphics Market Share, By Application, In USD Billion, 2016-2030F
- Figure 127. UAE Computer Graphics Market Share, By End-user, In USD Billion, 2016-2030F
- Figure 128. South Africa Computer Graphics Market, By Value, In USD Billion, 2016-2030F
- Figure 129. South Africa Computer Graphics Market Share, By Deployment, In USD Billion, 2016-2030F
- Figure 130. South Africa Computer Graphics Market Share, By Application, In USD Billion, 2016-2030F
- Figure 131. South Africa Computer Graphics Market Share, By End-user, In USD Billion, 2016-2030F
- Figure 132. By Deployment Map-Market Size (USD Billion) & Growth Rate (%), 2022
- Figure 133. By Application Map-Market Size (USD Billion) & Growth Rate (%), 2022
- Figure 134. By End-user Map-Market Size (USD Billion) & Growth Rate (%), 2022
- Figure 135. By Region Map-Market Size (USD Billion) & Growth Rate (%), 2022
Global Computer Graphics Market has experienced significant growth in recent years and is expected to maintain a strong pace of expansion in the coming years. With projected revenue of approximately USD 31.67 billion in 2022, the market is forecasted to reach a value of USD 50.86 billion by 2030, displaying a robust CAGR of 6.1% from 2023 to 2030.
The Computer Graphics Market is a highly dynamic and progressive sector that plays a pivotal role in enhancing high-quality graphics and visual computing across diverse industries. Often referred to as graphics processing units (GPUs), these are specialized electronic circuits designed to display images, videos, and animations. The gaming industry remained a driving force behind the demand for high-performance GPUs, with NVIDIA and AMD leading the way in the consumer market. Moreover, GPUs played a critical role in data centers by accelerating AI and deep learning tasks. Periodically, shortages in GPUs occurred due to cryptocurrency mining, particularly for Bitcoin and Ethereum. These shortages were aggravated by the essential role GPUs played in cryptocurrency mining. In industries such as CAD and content creation, professional graphics solutions from companies like NVIDIA and AMD remained indispensable.
The introduction of ray tracing technology in gaming GPUs marked a significant advancement, offering realistic graphics that mirrored real-world lighting effects. The market also witnessed the entry of new players like Intel and Apple, intensifying the competition. However, challenges in the supply chain, notably semiconductor shortages, had a substantial impact on GPU availability and pricing. Despite these challenges, the graphics processor market continued to evolve, with applications extending beyond gaming. Areas such as AI, rendering, and data processing played a central role in driving the market's growth, highlighting its dynamic and multifaceted nature.
Gaming Industry Creating Significant Demand for Computer Graphics Industry
Modern video games require increasingly realistic and immersive graphics to captivate gamers. GPUs are essential for rendering lifelike visuals, from detailed character models to expansive game worlds with intricate textures and lighting effects. Specially, PC gaming continues to thrive, with enthusiasts building custom gaming rigs that feature high-end GPUs. These GPUs are essential for running games at the highest settings and achieving high frame rates, providing superior gaming experience. Moreover, the rise of e-sports and competitive gaming has created a demand for high-refresh-rate monitors and GPUs capable of delivering smooth and responsive gameplay. Professional gamers often invest in top-tier GPUs to gain a competitive edge which further accelerates the market.
For example, in November 2022, AMD introduced fresh graphics cards that leverage the next-generation AMD RDNA3 architecture, renowned for its high performance and energy efficiency. These new offerings from AMD include the Radeon RX 7900 XTX and Radeon RX 7900 XT graphics cards. In a continuation of the success seen with AMD's "Zen" architecture-based Ryzen chiplet processors, these newly unveiled graphics cards proudly stand as the world's initial gaming graphics cards to incorporate a cutting-edge AMD chiplet design.
Implementation of AR & VR Influencing Computer Graphics Market
Augmented Reality (AR) and Virtual Reality (VR) are significant influencers in the field of computer graphics, driving innovation and shaping the development of advanced visual technologies. AR and VR applications necessitate powerful GPUs and graphics hardware to render high-quality, real-time 3D graphics. The demand for more capable hardware leads to innovations in GPU technology, pushing the boundaries of what's possible in computer graphics. AR relies on spatial computing, where virtual objects interact with the real-world environment. This interaction demands sophisticated algorithms and graphics processing to ensure that virtual objects seamlessly integrate with the user's surroundings, requiring complex computer graphics techniques. Moreover, AR and VR require intuitive and immersive interfaces. Designing user interfaces in 3D space challenges traditional concepts, leading to the development of new UI/UX paradigms. This innovation in interface design is closely tied to advancements in computer graphics.
For example, in December 2022, Meta revealed its decision to provide developers with an additional 7% of graphics processing unit (GPU) compute power for Meta Quest 2 devices. The boost aims to enhance application performance on the virtual reality (VR) headsets. The heightened GPU power will enable developers to utilize higher pixel density more effectively, without significantly compromising resolution to maintain the desired frame rate.
North America Region Holding Largest Share in the Computer Graphics Market
In 2022, North America region took the lead in the overall market, securing a substantial market share of more than 28%. The remarkable surge in the gaming industry within North America is a significant catalyst for market expansion. This region is a vibrant hub for game development and consumption, boasting an extensive audience that craves visually stunning and immersive gaming encounters. Graphic processing units (GPUs) are indispensable in empowering developers to craft cutting-edge games that cater to the discerning gaming community's demands. Furthermore, the North America region's emphasis on advanced technologies like artificial intelligence, robotics, and autonomous vehicles further amplifies the demand for GPUs. These transformative fields rely on intricate computations, a domain where GPUs excel, fostering innovation across diverse industries.
The escalating demand for cloud services and data centers within the region is another driving force for GPU demand. These facilities necessitate robust GPUs to manage resource-intensive applications, encompassing AI-driven analytics and high-performance computing tasks. This trend supports the region's technological advancement and contributes significantly to its economic growth.
Government Initiatives
In 2023, the UK government is committing £100 million in public funds to expedite the manufacturing of computer chips to establish a domestic AI asset within Britain. This initiative involves procurement from prominent chip manufacturers like Intel, AMD, and Nvidia. As part of this effort, the government has ordered 5,000 graphics processing units (GPUs), commonly called graphics cards, from Nvidia. These GPUs are essential for executing the intricate tasks artificial intelligence (AI) demands.
Impact of COVID-19
The COVID-19 pandemic had a favorable impact on the market. As a result of lockdowns and social distancing measures, individuals spent more time at home, leading to a surge in the demand for digital content and entertainment. This resulted in a heightened interest in computer graphics and visual effects within the realms of television, gaming, and cinema. Additionally, to adhere to social distancing guidelines, numerous companies operating in the computer graphics industry shifted toward remote work, effectively sustaining production through remote collaboration tools. The market experienced increased demand, primarily driven by the widespread adoption of virtualization and cloud-based technologies. While businesses and individuals adapted to remote work setups and increased online engagement, the demand for enhanced digital experiences grew significantly. This heightened the importance of Computer Graphics, particularly in the gaming sector, which saw remarkable growth during the pandemic. With more people seeking entertainment options at home, the gaming industry experienced a notable upswing, driving increased demand for Computer Graphics to deliver immersive visuals and seamless gameplay.
Furthermore, the market witnessed a spike in demand for animation and visual effects, particularly for original programming, largely due to the proliferation of online streaming platforms like Amazon, Netflix, and Disney+. Simultaneously, the demand for gaming laptops and graphics cards experienced a notable uptick, in direct response to the escalating popularity of gaming activities.
Key Players Landscape and Outlook
The Computer Graphics Market is witnessing a swift growth trajectory due to the increasing emphasis placed by companies worldwide on establishing advanced digital infrastructure. Furthermore, the market expansion is greatly facilitated by increasing users in the gaming industry, along with significant investments made by companies to enhance research and development resources, engage in collaboration projects, bolster marketing efforts, and expand distribution networks. These factors collectively contribute to the rapid expansion of the market.
In March 2022, Intel entered the discrete graphics business, unveiling its Intel Arc graphics product range, tailored for laptops. Intel has introduced the Arc A-series graphics within this product lineup, built on the new Xe HPG architecture. The company has introduced three GPUs as part of the Arc series - the Arc 3, Arc 5, and Arc 7. The Arc 3 represents the entry-level GPU in the company's portfolio, while the Arc 5 occupies a mid-range position, and the Arc 7 stands as the flagship GPU offering from Intel.
Table of Contents
1. Research Methodology
2. Project Scope & Definitions
3. Impact of COVID-19 on Computer Graphics Market
4. Executive Summary
5. Computer Graphics Market Outlook, 2016-2030F
- 5.1. Market Size & Forecast
- 5.1.1. By Value
- 5.2. By Deployment
- 5.2.1. Hardware
- 5.2.2. Software
- 5.3. By Application
- 5.3.1. Animation
- 5.3.2. Engineering Design & 3D Modelling
- 5.3.3. AR & VR
- 5.3.4. Data Visualization
- 5.3.5. Others
- 5.4. By End-user
- 5.4.1. Media and Entertainment
- 5.4.2. Healthcare
- 5.4.3. Automotive
- 5.4.4. BFSI
- 5.4.5. Others
- 5.5. By Region
- 5.5.1. North America
- 5.5.2. Europe
- 5.5.3. South America
- 5.5.4. Asia-Pacific
- 5.5.5. Middle East and Africa
- 5.6. By Company Market Share (%), 2022
6. Computer Graphics Market Outlook, By Region, 2016-2030F
- 6.1. North America*
- 6.1.1. Market Size & Forecast
- 6.1.1.1. By Value
- 6.1.2. By Deployment
- 6.1.2.1. Hardware
- 6.1.2.2. Software
- 6.1.3. By Application
- 6.1.3.1. Animation
- 6.1.3.2. Engineering Design & 3D Modelling
- 6.1.3.3. AR & VR
- 6.1.3.4. Data Visualization
- 6.1.3.5. Others
- 6.1.4. By End-user
- 6.1.4.1. Media and Entertainment
- 6.1.4.2. Healthcare
- 6.1.4.3. Automotive
- 6.1.4.4. BFSI
- 6.1.4.5. Others
- 6.1.5. United States*
- 6.1.5.1. Market Size & Forecast
- 6.1.5.1.1. By Value
- 6.1.5.2. By Deployment
- 6.1.5.2.1. Hardware
- 6.1.5.2.2. Software
- 6.1.5.3. By Application
- 6.1.5.3.1. Animation
- 6.1.5.3.2. Engineering Design & 3D Modelling
- 6.1.5.3.3. AR & VR
- 6.1.5.3.4. Data Visualization
- 6.1.5.3.5. Others
- 6.1.5.4. By End-user
- 6.1.5.4.1. Media and Entertainment
- 6.1.5.4.2. Healthcare
- 6.1.5.4.3. Automotive
- 6.1.5.4.4. BFSI
- 6.1.5.4.5. Others
- 6.1.6. Canada
- 6.1.7. Mexico
- 6.1.1. Market Size & Forecast
All segments will be provided for all regions and countries covered
- 6.2. Europe
- 6.2.1. Germany
- 6.2.2. France
- 6.2.3. Italy
- 6.2.4. United Kingdom
- 6.2.5. Russia
- 6.2.6. Netherlands
- 6.2.7. Spain
- 6.2.8. Turkey
- 6.2.9. Poland
- 6.3. South America
- 6.3.1. Brazil
- 6.3.2. Argentina
- 6.4. Asia-Pacific
- 6.4.1. India
- 6.4.2. China
- 6.4.3. Japan
- 6.4.4. Australia
- 6.4.5. Vietnam
- 6.4.6. South Korea
- 6.4.7. Indonesia
- 6.4.8. Philippines
- 6.5. Middle East & Africa
- 6.5.1. Saudi Arabia
- 6.5.2. UAE
- 6.5.3. South Africa
7. Market Mapping, 2022
- 7.1. By Deployment
- 7.2. By Application
- 7.3. By End-user
- 7.4. By Region
8. Macro Environment and Industry Structure
- 8.1. PESTEL Analysis
- 8.2. Porter's Five Forces Analysis
9. Market Dynamics
- 9.1. Growth Drivers
- 9.2. Growth Inhibitors (Challenges, Restraints)
10. Key Players Landscape
- 10.1. Competition Matrix of Top Five Market Leaders
- 10.2. Market Revenue Analysis of Top Five Market Leaders (in %, 2022)
- 10.3. Mergers and Acquisitions/Joint Ventures (If Applicable)
- 10.4. SWOT Analysis (For Five Market Players)
- 10.5. Patent Analysis (If Applicable)
11. Case Studies (If applicable)
12. Key Players Outlook
- 12.1. NVIDIA Corporation
- 12.1.1. Company Details
- 12.1.2. Key Management Personnel
- 12.1.3. Products & Services
- 12.1.4. Financials (As reported)
- 12.1.5. Key Market Focus & Geographical Presence
- 12.1.6. Recent Developments
- 12.2. Advanced Micro Devices, Inc.
- 12.3. Intel Corporation
- 12.4. Apple Inc.
- 12.5. ASUSTeK Computer Inc.
- 12.6. GIGA-BYTE Technology Co., Ltd.
- 12.7. Micro-Star International Co., Ltd.
- 12.8. SAPPHIRE Technology Limited
- 12.9. Qualcomm Technologies, Inc.
- 12.10. Matrox Graphics, Inc.
Companies mentioned above DO NOT hold any order as per market share and can be changed as per information available during research work

