|
|
市場調査レポート
商品コード
1226846
アジア太平洋地域の栄養バー市場の2028年までの予測- 地域別分析- タイプ別、カテゴリー別、流通チャネル別Asia Pacific Nutritional Bars Market Forecast to 2028 - COVID-19 Impact and Regional Analysis by Type, Category, Distribution Channel |
||||||
|
|
|||||||


| アジア太平洋地域の栄養バー市場の2028年までの予測- 地域別分析- タイプ別、カテゴリー別、流通チャネル別 |
|
出版日: 2023年02月10日
発行: The Insight Partners
ページ情報: 英文 109 Pages
納期: 即納可能
|
- 全表示
- 概要
- 図表
- 目次
アジア太平洋地域の栄養バー市場は、2022年の17億8,507万米ドルから2028年には26億4,414万米ドルに成長すると予測されています。2022年から2028年までのCAGRは6.8%と推定されています。
フィットネス動向の高まりがアジア太平洋地域の栄養バー市場を牽引する
ここ数年、人々は健康的なライフスタイルを送ることの重要性をより強く認識するようになりました。多くの人々が座りがちなライフスタイルを送るようになり、肉体的・精神的な健康に影響を及ぼしています。このような背景から、人々は健康維持のために身体活動やワークアウト、健康的な食生活を選択するようになりました。このように、フィットネスと健康的な食事は世界的に顕著な動向となっており、その結果、世界のフィットネス・栄養バー産業は急速に普及しています。COVID-19パンデミックが菓子類産業に及ぼす悪影響とは無関係に、2020-2021年の間に栄養バーを消費する人々の数は顕著に増加しています。
さらに、フィットネスセンター、ヘルスクラブ、ジムの数が増加しており、国民のフィットネスに対する意識の高まりと相まって、栄養バーの需要が増加しています。また、ヨガの人気が高まっていることも、栄養バーの需要を増加させると予想されます。これらすべての要因が、栄養バーの市場成長に寄与しています。
アジア太平洋地域の栄養バー市場の概要
アジア太平洋地域の栄養バー市場の成長は、外出先での間食、食事の代替、機能性食品、嗜好品への嗜好の高まりに起因しています。消費者は、COVID-19のパンデミック時に免疫力を高めるために、栄養価の高い健康的な代替食品や飲料を探しました。また、若年層やアスリートからのプロテインバー、高繊維質バー、食事代替バーなどの栄養バーに対する需要の高まりも、この地域の市場成長を後押ししています。これらの栄養バーは、アスリートやフィットネスライフスタイルユーザーのパフォーマンスやスタミナを向上させる。さらに、健康やフィットネスに関心の高い個人の増加により、栄養バーのような機能性製品の需要が高まっています。米国労働統計局によると、スポーツや運動への1日の平均参加率は、2003年から2015年の間に3.6%増加しました。米国におけるスポーツ参加者の増加は、予測期間中、アジア太平洋地域におけるエナジーバーの需要を押し上げると考えられます。また、無糖、グルテンフリー、低炭水化物の栄養バーの人気は、この地域全体で高まっています。
さらに、ビーガン人口の増加とビーガン主義が、植物ベースの栄養バーの需要を押し上げています。そのため、大手メーカーは消費者の需要に応えるため、植物由来の栄養バーを発売しています。例えば、2020年6月、Kelloggの子会社であるRXBARは、初の植物ベースの栄養バーを発売しました。このバーには、エンドウ豆とアーモンドから得た10gの植物性タンパク質が含まれています。メーカーによるこのような製品革新は、予測期間中にアジア太平洋地域の栄養バー市場の成長を後押しすると期待されています。
アジア太平洋地域の栄養バー市場の収益と2028年までの予測
アジア太平洋地域の栄養バー市場のセグメンテーション
アジア太平洋地域の栄養バー市場は、タイプ、カテゴリー、流通チャネル、国別に区分されます。
タイプに基づき、アジア太平洋地域の栄養バー市場は、プロテインバー、ハイファイバーバー、その他に区分されます。2022年、アジア太平洋地域の栄養バー市場では、プロテインバー分野が最大のシェアを占めました。
カテゴリーに基づき、アジア太平洋地域の栄養バー市場は、従来型とグルテンフリーに二分されます。2022年、アジア太平洋地域の栄養バー市場では、従来型セグメントがより大きなシェアを占めました。
流通チャネルに基づき、アジア太平洋地域の栄養バー市場はスーパーマーケット&ハイパーマーケット、コンビニエンスストア、オンライン小売、その他に分類されます。2022年、スーパーマーケット&ハイパーマーケット部門は、アジア太平洋地域の栄養バー市場で最大のシェアを占めました。
国別に見ると、アジア太平洋地域の栄養バー市場は、中国、日本、インド、オーストラリア、韓国、その他アジア太平洋地域に区分されます。2022年、その他アジア太平洋地域セグメントは、アジア太平洋地域の栄養バー市場で最大のシェアを占めました。
Clif Bar &Co;General Mills Inc;Mars Inc;The Kellogg Co;The Quaker Oats Co;and The Simply Good Foods Coは、アジア太平洋地域の栄養バー市場で事業を展開している主要企業です。
目次
第1章 イントロダクション
第2章 重要なポイント
第3章 調査手法
- 調査対象範囲
- 調査手法
- データ収集
- 一次インタビュー
- 仮説の策定
- マクロ経済要因分析
- ベースナンバーの作成
- データの三角測量
- 国別レベルデータ
第4章 アジア太平洋地域の栄養バーの市場概要
- 市場概要
- アジア太平洋地域のPEST分析
- エキスパートオピニオン
第5章 アジア太平洋地域の栄養バー市場- 主要な市場力学
- 市場促進要因
- ミレニアル世代におけるヘルシースナッキングへの嗜好の高まり
- 栄養バーのメーカー別製品開発・上市
- 市場抑制要因
- 代替品の入手可能性
- 市場機会
- ラベルへの機能性表示の搭載
- 今後の動向
- フィットネス動向の高まり
- 促進要因と抑制要因の影響分析
第6章 栄養バーのアジア太平洋地域市場分析
- アジア太平洋地域の栄養バー市場の概要
第7章 アジア太平洋地域の栄養バーの分析- タイプ別
- アジア太平洋地域の栄養バー市場、タイプ別(2021年、2028年)
- プロテインバー
- 高繊維バー
- その他
第8章 アジア太平洋地域の栄養バーの市場分析- カテゴリー別
- アジア太平洋地域の栄養バー市場、カテゴリー別(2021年、2028年)
- コンベンショナル
- グルテンフリー
第9章 アジア太平洋地域の栄養バーの分析- 流通チャネル別
- アジア太平洋地域の栄養バー市場:流通チャネル別(2021年、2028年)
- スーパーマーケット、ハイパーマーケット
- コンビニエンスストア
- オンラインショップ
- その他
第10章 アジア太平洋地域の栄養バーの市場- 国別分析
- アジア太平洋地域
- 中国
- 日本
- インド
- オーストラリア
- 韓国
- その他アジア太平洋地域
第11章 業界情勢
- 製品の発売
第12章 企業プロファイル
- The Simply Good Foods Co
- Clif Bar & Co
- General Mills Inc
- The Kellogg Co
- The Quaker Oats Co
- Mars Inc
第13章 付録
List Of Tables
- Table 1. APAC Nutritional Bars Market -Revenue and Forecast to 2028 (US$ Million)
- Table 2. China Nutritional Bars Market, By Type - Revenue and Forecast to 2028 (US$ Million)
- Table 3. China Nutritional Bars Market, by Category - Revenue and Forecast to 2028 (US$ Million)
- Table 4. China Nutritional Bars Market, by Distribution Channel - Revenue and Forecast to 2028 (US$ Million)
- Table 5. Japan Nutritional Bars Market, By Type - Revenue and Forecast to 2028 (US$ Million)
- Table 6. Japan Nutritional Bars Market, by Category - Revenue and Forecast to 2028 (US$ Million)
- Table 7. Japan Nutritional Bars Market, by Distribution Channel - Revenue and Forecast to 2028 (US$ Million)
- Table 8. India Nutritional Bars Market, By Type - Revenue and Forecast to 2028 (US$ Million)
- Table 9. India Nutritional Bars Market, by Category - Revenue and Forecast to 2028 (US$ Million)
- Table 10. India Nutritional Bars Market, by Distribution Channel - Revenue and Forecast to 2028 (US$ Million)
- Table 11. Australia Nutritional Bars Market, By Type- Revenue and Forecast to 2028 (US$ Million)
- Table 12. Australia Nutritional Bars Market, by Category - Revenue and Forecast to 2028 (US$ Million)
- Table 13. Australia Nutritional Bars Market, by Distribution Channel - Revenue and Forecast to 2028 (US$ Million)
- Table 14. South Korea Nutritional Bars Market, By Type - Revenue and Forecast to 2028 (US$ Million)
- Table 15. South Korea Nutritional Bars Market, by Category - Revenue and Forecast to 2028 (US$ Million)
- Table 16. South Korea Nutritional Bars Market, by Distribution Channel - Revenue and Forecast to 2028 (US$ Million)
- Table 17. Rest of Asia Pacific Nutritional Bars Market, By Type - Revenue and Forecast to 2028 (US$ Million)
- Table 18. Rest of Asia Pacific Nutritional Bars Market, by Category - Revenue and Forecast to 2028 (US$ Million)
- Table 19. Rest of Asia Pacific Nutritional Bars Market, by Distribution Channel - Revenue and Forecast to 2028 (US$ Million)
- Table 20. List of Abbreviation
List Of Figures
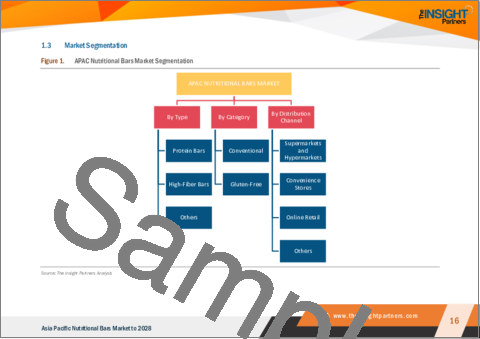
- Figure 1. APAC Nutritional Bars Market Segmentation
- Figure 2. APAC Nutritional Bars Market Segmentation - By Country
- Figure 3. APAC Nutritional Bars Market Overview
- Figure 4. APAC Nutritional Bars Market: By Category
- Figure 5. APAC Nutritional Bars Market: By Country
- Figure 6. APAC: PEST Analysis
- Figure 7. Expert Opinion
- Figure 8. APAC Nutritional Bars Market Impact Analysis of Drivers and Restraints
- Figure 9. APAC: Nutritional Bars Market - Revenue and Forecast to 2028 (US$ Million)
- Figure 10. APAC Nutritional bars Market Revenue Share, By Type (2021 and 2028)
- Figure 11. Protein Bars: APAC Nutritional bars Market - Revenue and Forecast To 2028 (US$ Million)
- Figure 12. High-Fiber Bars: APAC Nutritional bars Market - Revenue and Forecast To 2028 (US$ Million)
- Figure 13. Others: APAC Nutritional bars Market - Revenue and Forecast To 2028 (US$ Million)
- Figure 14. APAC Nutritional bars Market Revenue Share, By Category (2021 and 2028)
- Figure 15. Conventional: APAC Nutritional bars Market - Revenue and Forecast To 2028 (US$ Million)
- Figure 16. Gluten-Free: APAC Nutritional bars Market - Revenue and Forecast To 2028 (US$ Million)
- Figure 17. APAC Nutritional bars Market Revenue Share, By Distribution Channel (2021 and 2028)
- Figure 18. Supermarkets and Hypermarkets: APAC Nutritional bars Market - Revenue and Forecast To 2028 (US$ Million)
- Figure 19. Convenience Stores: APAC Nutritional bars Market - Revenue and Forecast To 2028 (US$ Million)
- Figure 20. Online Retail: APAC Nutritional bars Market - Revenue and Forecast To 2028 (US$ Million)
- Figure 21. Others: APAC Nutritional bars Market - Revenue and Forecast To 2028 (US$ Million)
- Figure 22. Asia Pacific: Nutritional Bars Market, by Key Country- Revenue (2021) (US$ Million)
- Figure 23. Asia Pacific: Nutritional Bars Market Revenue Share, by Key Country (2021 and 2028)
- Figure 24. China: Nutritional Bars Market -Revenue and Forecast to 2028 (US$ Million)
- Figure 25. Japan: Nutritional Bars Market -Revenue and Forecast to 2028 (US$ Million)
- Figure 26. India: Nutritional Bars Market -Revenue and Forecast to 2028 (US$ Million)
- Figure 27. Australia: Nutritional Bars Market -Revenue and Forecast to 2028 (US$ Million)
- Figure 28. South Korea: Nutritional Bars Market -Revenue and Forecast to 2028 (US$ Million)
- Figure 29. Rest of Asia Pacific: Nutritional Bars Market -Revenue and Forecast to 2028 (US$ Million)
The Asia Pacific nutritional bars market is expected to grow from US$ 1,785.07 million in 2022 to US$ 2,644.14 million by 2028. It is estimated to grow at a CAGR of 6.8% from 2022 to 2028.
Rising Fitness Trends will be Driving the Asia Pacific Nutritional Bars Market
In the last couple of years, people have become more aware of the importance of living a healthy lifestyle. The growing prevalence of sedentary lifestyles among a vast population is affecting their physical and mental health. This factor encourages them to opt for physical activities and workouts, and healthy eating to stay fit. Thus, fitness and healthy eating have become prominent trends worldwide, in turn, resulting in the rapid proliferation of the global fitness and nutritional bars industry. Irrespective of the adverse effects of the COVID-19 pandemic on the confectionery industry, there has been a notable increase in the number of people consuming nutritional bars during 2020-2021.
Additionally, a growing number of fitness centers, health clubs, and gymnasiums, coupled with growing awareness about fitness among the population, is increasing the demand for nutritional bars. Also, increasing popularity of yoga is also expected to increase the demand for nutritional bars. All these factors are contributing to the market growth of nutritional bars.
Asia Pacific Nutritional Bars Market Overview
The Asia Pacific nutritional bars market growth is attributed to the rising preference for on-the-go snacking, meal replacement, functional food, and indulgence. Consumers looked for healthier alternatives with high nutritional value in food and beverages to boost immunity during the COVID-19 pandemic. The rising demand for nutritional bars, including protein bars, high-fiber bars, and meal replacement bars, from young adults and athletes, is also driving the market growth in this region. These nutritional bars enhance the performance and stamina of athletes and fitness lifestyle users. Further, the growing number of health and fitness-conscious individuals has increased the demand for functional products such as nutritional bars. According to the US Bureau of Labor Statistics, average daily participation rates in sports and exercise grew by 3.6% between 2003 and 2015. An increasing number of sports participants in the US is likely to boost the demand for energy bars in Asia Pacific during the forecast period. Also, the popularity of sugar-free, gluten-free, and low-carb nutritional bars is growing across the region.
Moreover, the rising vegan population and veganism are boosting the demand for plant-based nutritional bars. Thus, leading manufacturers are launching plant-based nutritional bars to cater to consumers' demands. For instance, in June 2020, RXBAR, a Kellogg subsidiary, launched its first plant-based nutritional bar. This bar contains 10g of plant protein obtained from peas and almonds. Such product innovations by manufacturers are expected to boost the Asia Pacific nutritional bars market growth during the forecast period.
Asia Pacific Nutritional Bars Market Revenue and Forecast to 2028 (US$ Million)
Asia Pacific Nutritional Bars Market Segmentation
The Asia Pacific nutritional bars market is segmented into type, category, distribution channel, and country.
Based on type, the Asia Pacific nutritional bars market is segmented into protein bars, high-fiber bars, and others. In 2022, the protein bars segment registered a largest share in the Asia Pacific nutritional bars market.
Based on category, the Asia Pacific nutritional bars market is bifurcated into conventional and gluten-free. In 2022, the conventional segment registered a larger share in the Asia Pacific nutritional bars market.
Based on distribution channel, the Asia Pacific nutritional bars market is segmented into supermarkets & hypermarkets, convenience stores, online retail, and others. In 2022, the supermarkets & hypermarkets segment registered a largest share in the Asia Pacific nutritional bars market.
Based on country, the Asia Pacific nutritional bars market is segmented into China, Japan, India, Australia, South Korea, and the Rest of Asia Pacific. In 2022, the Rest of Asia Pacific segment registered a largest share in the Asia Pacific nutritional bars market.
Clif Bar & Co; General Mills Inc; Mars Inc; The Kellogg Co; The Quaker Oats Co; and The Simply Good Foods Co are the leading companies operating in the Asia Pacific nutritional bars market.
Reasons to Buy:
- Save and reduce time carrying out entry-level research by identifying the growth, size, leading players, and segments in the Asia Pacific nutritional bars market.
- Highlights key business priorities in order to assist companies to realign their business strategies
- The key findings and recommendations highlight crucial progressive industry trends in the Asia Pacific nutritional bars market, thereby allowing players across the value chain to develop effective long-term strategies
- Develop/modify business expansion plans by using substantial growth offering developed and emerging markets
- Scrutinize in-depth Asia Pacific market trends and outlook coupled with the factors driving the nutritional bars market, as well as those hindering it
- Enhance the decision-making process by understanding the strategies that underpin commercial interest with respect to client products, segmentation, pricing, and distribution
Table Of Contents
1. Introduction
- 1.1 Study Scope
- 1.2 The Insight Partners Research Report Guidance
- 1.3 Market Segmentation
2. Key Takeaways
3. Research Methodology
- 3.1 Scope of the Study
- 3.2 Research Methodology
- 3.2.1 Data Collection:
- 3.2.2 Primary Interviews:
- 3.2.3 Hypothesis Formulation:
- 3.2.4 Macro-economic Factor Analysis:
- 3.2.5 Developing Base Number:
- 3.2.6 Data Triangulation:
- 3.2.7 Country Level Data:
4. APAC Nutritional Bars Market Overview
- 4.1 Market Overview
- 4.2 APAC PEST Analysis
- 4.3 Expert Opinion
5. APAC Nutritional Bars Market - Key Market Dynamics
- 5.1 Market Drivers
- 5.1.1 Growing Preference for Healthy Snacking Among Millennials
- 5.1.2 Product Developments and Launches by Nutritional Bars Manufacturers
- 5.2 Market Restraints
- 5.2.1 Availability of Substitutes
- 5.3 Market Opportunities
- 5.3.1 Inclusion of Functional Claims on Labels
- 5.4 Future Trends
- 5.4.1 Rising Fitness Trends
- 5.5 Impact Analysis of Drivers and Restraints
6. Nutritional Bars - APAC Market Analysis
- 6.1 APAC Nutritional Bars Market Overview
- 6.2 APAC Nutritional Bars Market -Revenue and Forecast to 2028 (US$ Million)
7. APAC Nutritional Bars Analysis - By Type
- 7.1 Overview
- 7.2 APAC Nutritional bars Market, By Type (2021 and 2028)
- 7.3 Protein Bars
- 7.3.1 Overview
- 7.3.2 Protein Bars: APAC Nutritional bars Market - Revenue and Forecast to 2028 (US$ Million)
- 7.4 High-Fiber Bars
- 7.4.1 Overview
- 7.4.2 High-Fiber Bars: APAC Nutritional bars Market - Revenue and Forecast to 2028 (US$ Million)
- 7.5 Others
- 7.5.1 Overview
- 7.5.2 Others: APAC Nutritional bars Market - Revenue and Forecast to 2028 (US$ Million)
8. APAC Nutritional bars Market Analysis - By Category
- 8.1 Overview
- 8.2 APAC Nutritional bars Market, By Category (2021 and 2028)
- 8.3 Conventional
- 8.3.1 Overview
- 8.3.2 Conventional: APAC Nutritional bars Market - Revenue and Forecast to 2028 (US$ Million)
- 8.4 Gluten-Free
- 8.4.1 Overview
- 8.4.2 Gluten-Free: APAC Nutritional bars Market - Revenue and Forecast to 2028 (US$ Million)
9. APAC Nutritional Bars Analysis - By Distribution Channel
- 9.1 Overview
- 9.2 APAC Nutritional bars Market, By Distribution Channel (2021 and 2028)
- 9.3 Supermarkets and Hypermarkets
- 9.3.1 Overview
- 9.3.2 Supermarkets and Hypermarkets: APAC Nutritional bars Market - Revenue and Forecast to 2028 (US$ Million)
- 9.4 Convenience Stores
- 9.4.1 Overview
- 9.4.2 Convenience Stores: APAC Nutritional bars Market - Revenue and Forecast to 2028 (US$ Million)
- 9.5 Online Retail
- 9.5.1 Overview
- 9.5.2 Online Retail: APAC Nutritional bars Market - Revenue and Forecast to 2028 (US$ Million)
- 9.6 Others
- 9.6.1 Overview
- 9.6.2 Others: APAC Nutritional bars Market - Revenue and Forecast to 2028 (US$ Million)
10. APAC Nutritional Bars Market - Country Analysis
- 10.1 Overview
- 10.1.1 Asia Pacific: Nutritional Bars Market, by Key Country
- 10.1.1.1 China: Nutritional Bars Market -Revenue and Forecast to 2028 (US$ Million)
- 10.1.1.1.1 China: Nutritional Bars Market, By Type
- 10.1.1.1.2 China: Nutritional Bars Market, by Category
- 10.1.1.1.3 China: Nutritional Bars Market, by Distribution Channel
- 10.1.1.2 Japan: Nutritional Bars Market -Revenue and Forecast to 2028 (US$ Million)
- 10.1.1.2.1 Japan: Nutritional Bars Market, By Type
- 10.1.1.2.2 Japan: Nutritional Bars Market, by Category
- 10.1.1.2.3 Japan: Nutritional Bars Market, by Distribution Channel
- 10.1.1.3 India: Nutritional Bars Market -Revenue and Forecast to 2028 (US$ Million)
- 10.1.1.3.1 India: Nutritional Bars Market, by Type
- 10.1.1.3.2 India: Nutritional Bars Market, by Category
- 10.1.1.3.3 India: Nutritional Bars Market, by Distribution Channel
- 10.1.1.4 Australia: Nutritional Bars Market -Revenue and Forecast to 2028 (US$ Million)
- 10.1.1.4.1 Australia: Nutritional Bars Market, By Type
- 10.1.1.4.2 Australia: Nutritional Bars Market, by Category
- 10.1.1.4.3 Australia: Nutritional Bars Market, by Distribution Channel
- 10.1.1.5 South Korea: Nutritional Bars Market -Revenue and Forecast to 2028 (US$ Million)
- 10.1.1.5.1 South Korea: Nutritional Bars Market, By Type
- 10.1.1.5.2 South Korea: Nutritional Bars Market, by Category
- 10.1.1.5.3 South Korea: Nutritional Bars Market, by Distribution Channel
- 10.1.1.6 Rest of Asia Pacific: Nutritional Bars Market -Revenue and Forecast to 2028 (US$ Million)
- 10.1.1.6.1 Rest of Asia Pacific: Nutritional Bars Market, By Type
- 10.1.1.6.2 Rest of Asia Pacific: Nutritional Bars Market, by Category
- 10.1.1.6.3 Rest of Asia Pacific: Nutritional Bars Market, by Distribution Channel
- 10.1.1.1 China: Nutritional Bars Market -Revenue and Forecast to 2028 (US$ Million)
- 10.1.1 Asia Pacific: Nutritional Bars Market, by Key Country
11. Industry Landscape
- 11.1 Overview
- 11.2 Product launch
12. Company Profiles
- 12.1 The Simply Good Foods Co
- 12.1.1 Key Facts
- 12.1.2 Business Description
- 12.1.3 Products and Services
- 12.1.4 Financial Overview
- 12.1.5 SWOT Analysis
- 12.1.6 Key Developments
- 12.2 Clif Bar & Co
- 12.2.1 Key Facts
- 12.2.2 Business Description
- 12.2.3 Products and Services
- 12.2.4 Financial Overview
- 12.2.5 SWOT Analysis
- 12.2.6 Key Developments
- 12.3 General Mills Inc
- 12.3.1 Key Facts
- 12.3.2 Business Description
- 12.3.3 Products and Services
- 12.3.4 Financial Overview
- 12.3.5 SWOT Analysis
- 12.3.6 Key Developments
- 12.4 The Kellogg Co
- 12.4.1 Key Facts
- 12.4.2 Business Description
- 12.4.3 Products and Services
- 12.4.4 Financial Overview
- 12.4.5 SWOT Analysis
- 12.4.6 Key Developments
- 12.5 The Quaker Oats Co
- 12.5.1 Key Facts
- 12.5.2 Business Description
- 12.5.3 Products and Services
- 12.5.4 Financial Overview
- 12.5.5 SWOT Analysis
- 12.5.6 Key Developments
- 12.6 Mars Inc
- 12.6.1 Key Facts
- 12.6.2 Business Description
- 12.6.3 Products and Services
- 12.6.4 Financial Overview
- 12.6.5 SWOT Analysis
- 12.6.6 Key Developments
13. Appendix
- 13.1 About The Insight Partners
- 13.2 Word Index