|
|
市場調査レポート
商品コード
1187283
栄養バーの世界市場:2028年までの市場予測-タイプ、カテゴリー、流通チャネル別分析Nutritional Bars Market Forecast to 2028 - COVID-19 Impact and Global Analysis By Type, Category, and Distribution Channel |
||||||
|
|
|||||||


| 栄養バーの世界市場:2028年までの市場予測-タイプ、カテゴリー、流通チャネル別分析 |
|
出版日: 2022年12月22日
発行: The Insight Partners
ページ情報: 英文 154 Pages
納期: 1~5営業日
|
- 全表示
- 概要
- 図表
- 目次
世界の栄養バーの市場規模は、2022年の 71億96万米ドルから2028年には98億3,838万米ドルに拡大すると予測され、2022年から2028年までのCAGRは5.6%と予想されています。
栄養バーには、体の機能を維持するための十分なタンパク質や炭水化物だけでなく、さまざまな重要な栄養素やビタミンが含まれています。栄養バーの需要は、免疫サポートやストレス緩和といった機能的な利点に関する認知度の向上、ミレニアル世代における健康的な間食への嗜好の高まり、栄養バーメーカーによる製品開発・発売の増加により、急増しています。また、すぐに食べられる(RTE)食事やパック食品に対する消費者の嗜好が高まっていることも、栄養バーの需要を押し上げています。
栄養バー市場は、タイプ別にプロテインバー、ハイファイバーバー、その他に分類されます。2021年には、プロテインバー分野が最大の市場シェアを占め、高繊維バー分野は予測期間中に最も高いCAGRを記録すると予測されています。高繊維バーは、しばしばナッツ、オーツ、種子、果物などの食物繊維が豊富な食材を特徴としています。これらの栄養バーは、簡単かつ便利に体内の食物繊維の摂取量を増やすことができ、消化を調整し、全体的な健康を促進するのに役立つ可能性があります。さらに、食物繊維には、運動前後のサポート、継続的なエネルギー供給など、多くの栄養上の利点があります。また、血糖値やコレステロール値の維持・管理にも役立ちます。それはまた、健康的な体重を達成するために腸の健康を維持し、人体に心血管疾患やがんの悪影響を低下させるのに役立つことができます。これらの要因から、高繊維質バーの需要は健康志向の消費者の間で増加しています。
地域別では、栄養バー市場は、北米、欧州、アジア太平洋(APAC)、中東・アフリカ(MEA)、中南米に区分されます。2021年には北米が最大のシェアを占めましたが、2022年から2028年にかけてはアジア太平洋地域が最も高いCAGRを記録すると推定されます。北米の栄養バー市場の成長は、外出先での間食、食事代替、機能性食品、嗜好品への嗜好の高まりに起因しています。消費者は、COVID-19の流行時に免疫力を高めるために、高い栄養価を持つ健康的な食品や飲料の代替品を要求しました。プロテインバー、高繊維バー、食事代替バーなどの栄養バーに対する若年層や運動選手からの需要の高まりも、この地域の市場成長を促進しています。これらの栄養バーは、アスリートやフィットネスライフスタイルユーザーのパフォーマンスやスタミナを向上させます。さらに、健康やフィットネスに関心の高い人々の増加により、栄養バーのような機能性製品の需要も高まっています。
シンプリーグッドフーズ株式会社、クリフバー&Co、ゼネラルミルズ株式会社、ケロッグ株式会社、ライズバー株式会社、クエーカーオーツ株式会社、パーフェクトバーLLC、マース株式会社、Kind LLC、およびプレミア栄養株式会社LLCは、栄養バー市場で動作する主要プレーヤーの一つです。これらの選手は、上昇する顧客の要求を満たし、市場シェアを拡大するために、手頃な価格で革新的な製品の開発に従事しています。
栄養バーの全体的な市場規模は、一次情報および二次情報の両方を使用して導き出されました。調査プロセスを開始するにあたり、市場に関連する質的・量的情報を入手するため、内外の情報源を用いて徹底的な二次調査を実施しました。また、データを検証し、より分析的な洞察を得るために、業界関係者に複数の一次インタビューを実施しました。このプロセスの参加者には、副社長、事業開発マネージャー、市場情報マネージャー、国内営業マネージャー、そして栄養バー市場を専門とする評価専門家、研究アナリスト、キーオピニオンリーダーなどの外部コンサルタントが含まれています。
目次
第1章 イントロダクション
- 調査範囲
- インサイトパートナーズの調査報告書ガイダンス
- 市場セグメンテーション
第2章 重要なポイント
第3章 調査手法
- 調査範囲
- 調査手法
- データ収集
- 一次インタビュー
- 仮説の形成
- マクロ経済要因分析
- ベースナンバーの作成
- データの三角測量
- 国別データ
第4章 栄養バーの市場概要
- 市場概要
- PEST分析
- 北米
- 欧州
- アジア太平洋地域
- 中東&アフリカ
- 中南米
- 専門家の見解
第5章 栄養バーの市場- 主要な市場力学
- 市場促進要因
- ミレニアル世代におけるヘルシースナッキングへの嗜好の高まり
- 栄養バーメーカー別製品開発・上市
- 市場抑制要因
- 代替品の利用可能性
- 市場機会
- ラベルへの機能性表示の盛り込み
- 今後の動向
- フィットネス動向の高まり
- 促進要因と抑制要因の影響分析
第6章 栄養バー:世界市場分析
- 栄養バー市場の概要
- 競合の位置づけ-主要市場プレイヤー
第7章 栄養バーの分析-タイプ別
- 栄養バーのタイプ別市場(2021年、2028年)
- プロテインバー
- 高繊維バー
- その他
第8章 栄養バーの市場分析- カテゴリ別
- 栄養バー市場:カテゴリー別(2021年、2028年)
- コンベンショナル
- グルテンフリー
第9章 栄養バーの分析- 流通チャネル別
- 栄養バー市場:流通チャネル別(2021年、2028年)
- スーパーマーケット、ハイパーマーケット
- コンビニエンスストア
- オンライン小売
- その他
第10章 栄養バーの市場- 地域別分析
- 北米
- 米国
- カナダ
- メキシコ
- 欧州
- ドイツ
- フランス
- 英国
- イタリア
- ロシア
- その他欧州
- アジア太平洋地域
- 中国
- 日本
- インド
- オーストラリア
- 韓国
- その他アジア太平洋地域
- 中南米
- ブラジル
- アルゼンチン
- その他の中南米地域
- 中東・アフリカ地域
- サウジアラビア
- UAE
- 南アフリカ
- その他の中東・アフリカ地域
第11章 COVID-19のパンデミック別栄養バー市場への影響
- COVID-19の栄養バー市場への影響
- 北米
- 欧州
- アジア太平洋地域
- 中東&アフリカ
- 中南米
第12章 業界の情勢
- 製品の発売
第13章 企業プロファイル
- The Simply Good Foods Co
- Clif Bar & Co
- General Mills Inc
- The Kellogg Co
- Rise Bar Inc
- The Quaker Oats Co
- Perfect Bar LLC
- Mars Inc
- Kind LLC
- Premier Nutrition Co LLC
第14章 付録
- The Insight Partners について
- 単語インデックス
List Of Tables
- Table 1. Nutritional Bars Market -Revenue and Forecast to 2028 (US$ Million)
- Table 2. North America Nutritional Bars Market, By Type - Revenue and Forecast to 2028 (US$ Million)
- Table 3. North America Nutritional Bars Market, by Category - Revenue and Forecast to 2028 (US$ Million)
- Table 4. North America Nutritional Bars Market, by Distribution Channel - Revenue and Forecast to 2028 (US$ Million)
- Table 5. US Nutritional Bars Market, Type - Revenue and Forecast to 2028 (US$ Million)
- Table 6. US Nutritional Bars Market, by Category - Revenue and Forecast to 2028 (US$ Million)
- Table 7. US Nutritional Bars Market, by Distribution Channel - Revenue and Forecast to 2028 (US$ Million)
- Table 8. Canada Nutritional Bars Market, By Type - Revenue and Forecast to 2028 (US$ Million)
- Table 9. Canada Nutritional Bars Market, by Category - Revenue and Forecast to 2028 (US$ Million)
- Table 10. Canada Nutritional Bars Market, by Distribution Channel - Revenue and Forecast to 2028 (US$ Million)
- Table 11. Mexico Nutritional Bars Market, By Type - Revenue and Forecast to 2028 (US$ Million)
- Table 12. Mexico Nutritional Bars Market, by Category - Revenue and Forecast to 2028 (US$ Million)
- Table 13. Mexico Nutritional Bars Market, by Distribution Channel - Revenue and Forecast to 2028 (US$ Million)
- Table 14. Europe: Nutritional Bars Market, By Type - Revenue and Forecast to 2028 (US$ Million)
- Table 15. Europe: Nutritional Bars Market, by Category - Revenue and Forecast to 2028 (US$ Million)
- Table 16. Europe: Nutritional Bars Market, by Distribution Channel - Revenue and Forecast to 2028 (US$ Million)
- Table 17. Germany Nutritional Bars Market, By Type - Revenue and Forecast to 2028 (US$ Million)
- Table 18. Germany Nutritional Bars Market, by Category - Revenue and Forecast to 2028 (US$ Million)
- Table 19. Germany Nutritional Bars Market, by Distribution Channel - Revenue and Forecast to 2028 (US$ Million)
- Table 20. France Nutritional Bars Market, By Type - Revenue and Forecast to 2028 (US$ Million)
- Table 21. France Nutritional Bars Market, by Category - Revenue and Forecast to 2028 (US$ Million)
- Table 22. France Nutritional Bars Market, by Distribution Channel - Revenue and Forecast to 2028 (US$ Million)
- Table 23. UK Nutritional Bars Market, By Type - Revenue and Forecast to 2028 (US$ Million)
- Table 24. UK Nutritional Bars Market, by Category - Revenue and Forecast to 2028 (US$ Million)
- Table 25. UK Nutritional Bars Market, by Distribution Channel - Revenue and Forecast to 2028 (US$ Million)
- Table 26. Italy Nutritional Bars Market, By Type - Revenue and Forecast to 2028 (US$ Million)
- Table 27. Italy Nutritional Bars Market, by Category - Revenue and Forecast to 2028 (US$ Million)
- Table 28. Italy Nutritional Bars Market, by Distribution Channel - Revenue and Forecast to 2028 (US$ Million)
- Table 29. Russia Nutritional Bars Market, By Type - Revenue and Forecast to 2028 (US$ Million)
- Table 30. Russia Nutritional Bars Market, by Category - Revenue and Forecast to 2028 (US$ Million)
- Table 31. Russia Nutritional Bars Market, by Distribution Channel - Revenue and Forecast to 2028 (US$ Million)
- Table 32. Rest of Europe Nutritional Bars Market, By Type - Revenue and Forecast to 2028 (US$ Million)
- Table 33. Rest of Europe Nutritional Bars Market, by Category - Revenue and Forecast to 2028 (US$ Million)
- Table 34. Rest of Europe Nutritional Bars Market, by Distribution Channel - Revenue and Forecast to 2028 (US$ Million)
- Table 35. Asia Pacific Nutritional Bars Market, By Type - Revenue and Forecast to 2028 (US$ Million)
- Table 36. Asia Pacific Nutritional Bars Market, by Category - Revenue and Forecast to 2028 (US$ Million)
- Table 37. Asia Pacific: Nutritional Bars Market, by Distribution Channel - Revenue and Forecast to 2028 (US$ Million)
- Table 38. China Nutritional Bars Market, By Type - Revenue and Forecast to 2028 (US$ Million)
- Table 39. China Nutritional Bars Market, by Category - Revenue and Forecast to 2028 (US$ Million)
- Table 40. China Nutritional Bars Market, by Distribution Channel - Revenue and Forecast to 2028 (US$ Million)
- Table 41. Japan Nutritional Bars Market, By Type - Revenue and Forecast to 2028 (US$ Million)
- Table 42. Japan Nutritional Bars Market, by Category - Revenue and Forecast to 2028 (US$ Million)
- Table 43. Japan Nutritional Bars Market, by Distribution Channel - Revenue and Forecast to 2028 (US$ Million)
- Table 44. India Nutritional Bars Market, By Type - Revenue and Forecast to 2028 (US$ Million)
- Table 45. India Nutritional Bars Market, by Category - Revenue and Forecast to 2028 (US$ Million)
- Table 46. India Nutritional Bars Market, by Distribution Channel - Revenue and Forecast to 2028 (US$ Million)
- Table 47. Australia Nutritional Bars Market, By Type- Revenue and Forecast to 2028 (US$ Million)
- Table 48. Australia Nutritional Bars Market, by Category - Revenue and Forecast to 2028 (US$ Million)
- Table 49. Australia Nutritional Bars Market, by Distribution Channel - Revenue and Forecast to 2028 (US$ Million)
- Table 50. South Korea Nutritional Bars Market, By Type - Revenue and Forecast to 2028 (US$ Million)
- Table 51. South Korea Nutritional Bars Market, by Category - Revenue and Forecast to 2028 (US$ Million)
- Table 52. South Korea Nutritional Bars Market, by Distribution Channel - Revenue and Forecast to 2028 (US$ Million)
- Table 53. Rest of Asia Pacific Nutritional Bars Market, By Type - Revenue and Forecast to 2028 (US$ Million)
- Table 54. Rest of Asia Pacific Nutritional Bars Market, by Category - Revenue and Forecast to 2028 (US$ Million)
- Table 55. Rest of Asia Pacific Nutritional Bars Market, by Distribution Channel - Revenue and Forecast to 2028 (US$ Million)
- Table 56. South and Central America Nutritional Bars Market, By Type - Revenue and Forecast to 2028 (US$ Million)
- Table 57. South and Central America Nutritional Bars Market, by Category - Revenue and Forecast to 2028 (US$ Million)
- Table 58. South and Central America: Nutritional Bars Market, by Distribution Channel - Revenue and Forecast to 2028 (US$ Million)
- Table 59. Brazil Nutritional Bars Market, By Type - Revenue and Forecast to 2028 (US$ Million)
- Table 60. Brazil Nutritional Bars Market, by Category - Revenue and Forecast to 2028 (US$ Million)
- Table 61. Brazil Nutritional Bars Market, by Distribution Channel - Revenue and Forecast to 2028 (US$ Million)
- Table 62. Argentina Nutritional Bars Market, By Type - Revenue and Forecast to 2028 (US$ Million)
- Table 63. Argentina Nutritional Bars Market, by Category - Revenue and Forecast to 2028 (US$ Million)
- Table 64. Argentina Nutritional Bars Market, by Distribution Channel - Revenue and Forecast to 2028 (US$ Million)
- Table 65. Rest of South and Central America Nutritional Bars Market, By Type - Revenue and Forecast to 2028 (US$ Million)
- Table 66. Rest of South and Central America Nutritional Bars Market, by Category - Revenue and Forecast to 2028 (US$ Million)
- Table 67. Rest of South and Central America Nutritional Bars Market, by Distribution Channel - Revenue and Forecast to 2028 (US$ Million)
- Table 68. Middle East and Africa Nutritional Bars Market, By Type- Revenue and Forecast to 2028 (US$ Million)
- Table 69. Middle East and Africa Nutritional Bars Market, by Category - Revenue and Forecast to 2028 (US$ Million)
- Table 70. Middle East and Africa: Nutritional Bars Market, by Distribution Channel - Revenue and Forecast to 2028 (US$ Million)
- Table 71. Saudi Arabia Nutritional Bars Market, By Type - Revenue and Forecast to 2028 (US$ Million)
- Table 72. Saudi Arabia Nutritional Bars Market, by Category - Revenue and Forecast to 2028 (US$ Million)
- Table 73. Saudi Arabia Nutritional Bars Market, by Distribution Channel - Revenue and Forecast to 2028 (US$ Million)
- Table 74. UAE Nutritional Bars Market, By Type - Revenue and Forecast to 2028 (US$ Million)
- Table 75. UAE Nutritional Bars Market, by Category - Revenue and Forecast to 2028 (US$ Million)
- Table 76. UAE Nutritional Bars Market, by Distribution Channel - Revenue and Forecast to 2028 (US$ Million)
- Table 77. South Africa Nutritional Bars Market, By Type - Revenue and Forecast to 2028 (US$ Million)
- Table 78. South Africa Nutritional Bars Market, by Category - Revenue and Forecast to 2028 (US$ Million)
- Table 79. South Africa Nutritional Bars Market, by Distribution Channel - Revenue and Forecast to 2028 (US$ Million)
- Table 80. Rest of Middle East and Africa Nutritional Bars Market, by Type - Revenue and Forecast to 2028 (US$ Million)
- Table 81. Rest of Middle East and Africa Nutritional Bars Market, by Category - Revenue and Forecast to 2028 (US$ Million)
- Table 82. Rest of Middle East and Africa Nutritional Bars Market, by Distribution Channel - Revenue and Forecast to 2028 (US$ Million)
- Table 83. List of Abbreviation
List Of Figures
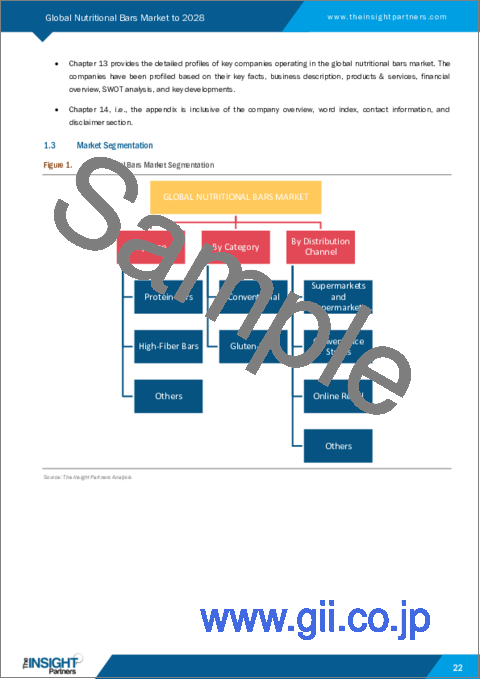
- Figure 1. Nutritional Bars Market Segmentation
- Figure 2. Nutritional Bars Market Segmentation - By Geography
- Figure 3. Global Nutritional Bars Market Overview
- Figure 4. Nutritional Bars Market: By Category
- Figure 5. Nutritional Bars Market: By Region
- Figure 6. Global Nutritional Bars Market, Key Market Players
- Figure 7. North America: PEST Analysis
- Figure 8. Europe: PEST Analysis
- Figure 9. Asia-Pacific: PEST Analysis
- Figure 10. Middle East & Africa: PEST Analysis
- Figure 11. South & Central America: PEST Analysis
- Figure 12. Expert Opinion
- Figure 13. Global Nutritional Bars Market Impact Analysis of Drivers and Restraints
- Figure 14. Geographic Overview of Nutritional Bars Market
- Figure 15. Global: Nutritional Bars Market - Revenue and Forecast to 2028 (US$ Million)
- Figure 16. Key Players: Nutritional Bars Market
- Figure 17. Nutritional bars Market Revenue Share, By Type (2021 and 2028)
- Figure 18. Protein Bars: Nutritional bars Market - Revenue and Forecast To 2028 (US$ Million)
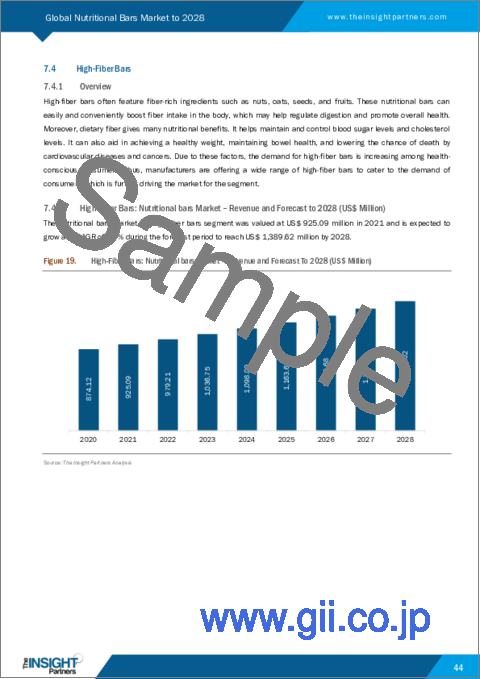
- Figure 19. High-Fiber Bars: Nutritional bars Market - Revenue and Forecast To 2028 (US$ Million)
- Figure 20. Others: Nutritional bars Market - Revenue and Forecast To 2028 (US$ Million)
- Figure 21. Nutritional bars Market Revenue Share, By Category (2021 and 2028)
- Figure 22. Conventional: Nutritional bars Market - Revenue and Forecast To 2028 (US$ Million)
- Figure 23. Gluten-Free: Nutritional bars Market - Revenue and Forecast To 2028 (US$ Million)
- Figure 24. Nutritional bars Market Revenue Share, By Distribution Channel (2021 and 2028)
- Figure 25. Supermarkets and Hypermarkets: Nutritional bars Market - Revenue and Forecast To 2028 (US$ Million)
- Figure 26. Convenience Stores: Nutritional bars Market - Revenue and Forecast To 2028 (US$ Million)
- Figure 27. Online Retail: Nutritional bars Market - Revenue and Forecast To 2028 (US$ Million)
- Figure 28. Others: Nutritional bars Market - Revenue and Forecast To 2028 (US$ Million)
- Figure 29. Global Nutritional Bars Market Revenue Share, By Region (2021 and 2028)
- Figure 30. North America: Nutritional Bars Market - Revenue and Forecast to 2028 (US$ Million)
- Figure 31. North America: Nutritional Bars Market Revenue Share, By Type (2021 and 2028)
- Figure 32. North America: Nutritional Bars Market Revenue Share, by Category (2021 and 2028)
- Figure 33. North America: Nutritional Bars Market Revenue Share, by Distribution Channel (2021 and 2028)
- Figure 34. North America: Nutritional Bars Market Revenue Share, by Key Country (2021 and 2028)
- Figure 35. US: Nutritional Bars Market - Revenue and Forecast to 2028 (US$ Million)
- Figure 36. Canada: Nutritional Bars Market - Revenue and Forecast to 2028 (US$ Million)
- Figure 37. Mexico: Nutritional Bars Market - Revenue and Forecast to 2028 (US$ Million)
- Figure 38. Europe: Nutritional Bars Market - Revenue and Forecast to 2028 (US$ Million)
- Figure 39. Europe: Nutritional Bars Market Revenue Share, By Type (2021 and 2028)
- Figure 40. Europe: Nutritional Bars Market Revenue Share, by Category (2021 and 2028)
- Figure 41. Europe: Nutritional Bars Market Revenue Share, by Distribution Channel (2021 and 2028)
- Figure 42. Europe: Nutritional Bars Market Revenue Share, by Key Country (2021 and 2028)
- Figure 43. Germany: Nutritional Bars Market - Revenue and Forecast to 2028 (US$ Million)
- Figure 44. France: Nutritional Bars Market - Revenue and Forecast to 2028 (US$ Million)
- Figure 45. UK: Nutritional Bars Market - Revenue and Forecast to 2028 (US$ Million)
- Figure 46. Italy: Nutritional Bars Market - Revenue and Forecast to 2028 (US$ Million)
- Figure 47. Russia: Nutritional Bars Market - Revenue and Forecast to 2028 (US$ Million)
- Figure 48. Rest of Europe: Nutritional Bars Market - Revenue and Forecast to 2028 (US$ Million)
- Figure 49. Asia Pacific: Nutritional Bars Market - Revenue and Forecast to 2028 (US$ Million)
- Figure 50. Asia Pacific: Nutritional Bars Market Revenue Share, By Type (2021 and 2028)
- Figure 51. Asia Pacific: Nutritional Bars Market Revenue Share, by Category (2021 and 2028)
- Figure 52. Asia Pacific: Nutritional Bars Market Revenue Share, by Distribution Channel (2021 and 2028)
- Figure 53. Asia Pacific: Nutritional Bars Market Revenue Share, by Key Country (2021 and 2028)
- Figure 54. China: Nutritional Bars Market -Revenue and Forecast to 2028 (US$ Million)
- Figure 55. Japan: Nutritional Bars Market -Revenue and Forecast to 2028 (US$ Million)
- Figure 56. India: Nutritional Bars Market -Revenue and Forecast to 2028 (US$ Million)
- Figure 57. Australia: Nutritional Bars Market -Revenue and Forecast to 2028 (US$ Million)
- Figure 58. South Korea: Nutritional Bars Market -Revenue and Forecast to 2028 (US$ Million)
- Figure 59. Rest of Asia Pacific: Nutritional Bars Market -Revenue and Forecast to 2028 (US$ Million)
- Figure 60. South and Central America: Nutritional Bars Market - Revenue and Forecast to 2028 (US$ Million)
- Figure 61. South and Central America: Nutritional Bars Market Revenue Share, By Type (2021 and 2028)
- Figure 62. South and Central America: Nutritional Bars Market Revenue Share, by Category (2021 and 2028)
- Figure 63. South and Central America: Nutritional Bars Market Revenue Share, by Distribution Channel (2021 and 2028)
- Figure 64. South and Central America: Nutritional Bars Market Revenue Share, by Key Country (2021 and 2028)
- Figure 65. Brazil: Nutritional Bars Market - Revenue and Forecast to 2028 (US$ Million)
- Figure 66. Argentina: Nutritional Bars Market - Revenue and Forecast to 2028 (US$ Million)
- Figure 67. Rest of South and Central America: Nutritional Bars Market - Revenue and Forecast to 2028 (US$ Million)
- Figure 68. Middle East and Africa: Nutritional Bars Market - Revenue and Forecast to 2028 (US$ Million)
- Figure 69. Middle East and Africa: Nutritional Bars Market Revenue Share, By Type (2021 and 2028)
- Figure 70. Middle East and Africa: Nutritional Bars Market Revenue Share, by Category (2021 and 2028)
- Figure 71. Middle East and Africa: Nutritional Bars Market Revenue Share, by Distribution Channel (2021 and 2028)
- Figure 72. Middle East and Africa: Nutritional Bars Market Revenue Share, by Key Country (2021 and 2028)
- Figure 73. Saudi Arabia: Nutritional Bars Market -Revenue and Forecast to 2028 (US$ Million)
- Figure 74. UAE: Nutritional Bars Market -Revenue and Forecast to 2028 (US$ Million)
- Figure 75. South Africa: Nutritional Bars Market -Revenue and Forecast to 2028 (US$ Million)
- Figure 76. Rest of Middle East and Africa: Nutritional Bars Market -Revenue and Forecast to 2028 (US$ Million)
- Figure 77. Impact of COVID-19 Pandemic on North America Nutritional Bars Market
- Figure 78. Impact of COVID-19 Pandemic on Europe Nutritional Bars Market
- Figure 79. Impact of COVID-19 Pandemic on Asia Pacific Nutritional Bars Market
- Figure 80. Impact of COVID-19 Pandemic on the Middle East & Africa Nutritional Bars Market
- Figure 81. Impact of COVID-19 Pandemic on South & Central America Nutritional Bars Market
The nutritional bars market size is expected to grow from US$ 7,100.96 million in 2022 to US$ 9,838.38 million by 2028; it is expected to grow at a CAGR of 5.6% from 2022 to 2028.
Nutritional bars contain a wide range of vital nutrients and vitamins, as well as sufficient protein and carbohydrates to keep body functioning. The demand for nutritional bars has surged owing to increasing awareness about their functional benefits such as immune support and stress relief, growing preference for healthy snacking among millennials, and the rising number of product development and launches by nutritional bar manufacturers. In addition, the growing consumer preference for ready-to-eat (RTE) meals and packed food items is boosting the demand for nutritional bars.
Based on type, the nutritional bars market is segmented into protein bars, high-fiber bars, and others. The protein bars segment held the largest market share in 2021, and the high-fiber bars segment is projected to register the highest CAGR during the forecast period. High-fiber bars often feature fiber-rich ingredients such as nuts, oats, seeds, and fruits. These nutritional bars can easily and conveniently boost fiber intake in the body, which may help regulate digestion and promote overall health. Moreover, dietary fiber gives many nutritional benefits such as support pre & post workout, provides continuous energy supply, and others. It helps maintain and control blood sugar levels and cholesterol levels. It can also aid in achieving a healthy weight, maintaining bowel health, and lowering the adverse effects of cardiovascular diseases and cancers on the human body. Due to these factors, the demand for high-fiber bars is increasing among health-conscious consumers.
In terms of region, the nutritional bars market is segmented into North America, Europe, Asia Pacific (APAC), the Middle East & Africa (MEA), and South & Central America. In 2021, North America held the largest share of the market; however, Asia Pacific is estimated to register the highest CAGR from 2022 to 2028. The North America nutritional bars market growth is attributed to the rising preference for on-the-go snacking, meal replacement, functional food, and indulgence. Consumers demanded healthy food and beverage alternatives with high nutritional value to boost immunity during the COVID-19 pandemic. The rising demand for nutritional bars, including protein bars, high-fiber bars, and meal replacement bars, from young adults and athletes is also driving the market growth in this region. These nutritional bars enhance the performance and stamina of athletes and fitness lifestyle users. Further, the growing number of health and fitness-conscious individuals has increased the demand for functional products such as nutritional bars.
The Simply Good Foods Co, Clif Bar & Co, General Mills Inc, The Kellogg Co, Rise Bar Inc, The Quaker Oats Co, Perfect Bar LLC, Mars Inc, Kind LLC, and Premier Nutrition Co LLC are among the key players operating in the nutritional bars market. These players engage in developing affordable and innovative products to meet the rising customer demands and expand their market share.
The overall nutritional bars market size has been derived using both primary and secondary sources. To begin the research process, exhaustive secondary research has been conducted using internal and external sources to obtain qualitative and quantitative information related to the market. Also, multiple primary interviews have been conducted with industry participants to validate the data and gain more analytical insights into the topic. The participants of this process include VPs, business development managers, market intelligence managers, and national sales managers, along external consultants such as valuation experts, research analysts, and key opinion leaders, specializing in the nutritional bars market.
Reasons to Buy:
Highlights key business priorities in order to assist companies to realign their business strategies.
The key findings and recommendations highlight crucial progressive industry trends in the global nutritional bars market, thereby allowing players to develop effective long-term strategies.
Develop/modify business expansion plans by using substantial growth offering developed and emerging markets.
Scrutinize in-depth the market trends and outlook coupled with the factors driving the market, as well as those hindering it.
Enhance the decision-making process by understanding the strategies that underpin commercial interest with respect to products, segmentation, and industry verticals.
Table Of Contents
1. Introduction
- 1.1 Study Scope
- 1.2 The Insight Partners Research Report Guidance
- 1.3 Market Segmentation
2. Key Takeaways
3. Research Methodology
- 3.1 Scope of the Study
- 3.2 Research Methodology
- 3.2.1 Data Collection:
- 3.2.2 Primary Interviews:
- 3.2.3 Hypothesis Formulation:
- 3.2.4 Macro-economic Factor Analysis:
- 3.2.5 Developing Base Number:
- 3.2.6 Data Triangulation:
- 3.2.7 Country Level Data:
4. Nutritional Bars Market Overview
- 4.1 Market Overview
- 4.2 PEST Analysis
- 4.2.1 North America
- 4.2.2 Europe
- 4.2.3 Asia-Pacific
- 4.2.4 Middle East & Africa
- 4.2.5 South & Central America
- 4.3 Expert Opinion
5. Nutritional Bars Market - Key Market Dynamics
- 5.1 Market Drivers
- 5.1.1 Growing Preference for Healthy Snacking Among Millennials
- 5.1.2 Product Developments and Launches by Nutritional Bars Manufacturers
- 5.2 Market Restraints
- 5.2.1 Availability of Substitutes
- 5.3 Market Opportunities
- 5.3.1 Inclusion of Functional Claims on Labels
- 5.4 Future Trends
- 5.4.1 Rising Fitness Trends
- 5.5 Impact Analysis of Drivers and Restraints
6. Nutritional Bars - Global Market Analysis
- 6.1 Nutritional Bars Market Overview
- 6.2 Nutritional Bars Market -Revenue and Forecast to 2028 (US$ Million)
- 6.3 Competitive Positioning - Key Market Players
7. Nutritional Bars Analysis - By Type
- 7.1 Overview
- 7.2 Nutritional bars Market, By Type (2021 and 2028)
- 7.3 Protein Bars
- 7.3.1 Overview
- 7.3.2 Protein Bars: Nutritional bars Market - Revenue and Forecast to 2028 (US$ Million)
- 7.4 High-Fiber Bars
- 7.4.1 Overview
- 7.4.2 High-Fiber Bars: Nutritional bars Market - Revenue and Forecast to 2028 (US$ Million)
- 7.5 Others
- 7.5.1 Overview
- 7.5.2 Others: Nutritional bars Market - Revenue and Forecast to 2028 (US$ Million)
8. Nutritional bars Market Analysis - By Category
- 8.1 Overview
- 8.2 Nutritional bars Market, By Category (2021 and 2028)
- 8.3 Conventional
- 8.3.1 Overview
- 8.3.2 Conventional: Nutritional bars Market - Revenue and Forecast to 2028 (US$ Million)
- 8.4 Gluten-Free
- 8.4.1 Overview
- 8.4.2 Gluten-Free: Nutritional bars Market - Revenue and Forecast to 2028 (US$ Million)
9. Nutritional Bars Analysis - By Distribution Channel
- 9.1 Overview
- 9.2 Nutritional bars Market, By Distribution Channel (2021 and 2028)
- 9.3 Supermarkets and Hypermarkets
- 9.3.1 Overview
- 9.3.2 Supermarkets and Hypermarkets: Nutritional bars Market - Revenue and Forecast to 2028 (US$ Million)
- 9.4 Convenience Stores
- 9.4.1 Overview
- 9.4.2 Convenience Stores: Nutritional bars Market - Revenue and Forecast to 2028 (US$ Million)
- 9.5 Online Retail
- 9.5.1 Overview
- 9.5.2 Online Retail: Nutritional bars Market - Revenue and Forecast to 2028 (US$ Million)
- 9.6 Others
- 9.6.1 Overview
- 9.6.2 Others: Nutritional bars Market - Revenue and Forecast to 2028 (US$ Million)
10. Nutritional Bars Market - Geographic Analysis
- 10.1 Overview
- 10.2 North America: Nutritional Bars Market
- 10.2.1 North America: Nutritional Bars Market -Revenue and Forecast to 2028 (US$ Million)
- 10.2.2 North America: Nutritional Bars Market, By Type
- 10.2.3 North America: Nutritional Bars Market, by Category
- 10.2.4 North America: Nutritional Bars Market, by Distribution Channel
- 10.2.5 North America: Nutritional Bars Market, by Key Country
- 10.2.5.1 US: Nutritional Bars Market - Revenue and Forecast to 2028 (US$ Million)
- 10.2.5.1.1 US: Nutritional Bars Market, By Type
- 10.2.5.1.2 US: Nutritional Bars Market, by Category
- 10.2.5.1.3 US: Nutritional Bars Market, by Distribution Channel
- 10.2.5.2 Canada: Nutritional Bars Market - Revenue and Forecast to 2028 (US$ Million)
- 10.2.5.2.1 Canada: Nutritional Bars Market, By Type
- 10.2.5.2.2 Canada: Nutritional Bars Market, by Category
- 10.2.5.2.3 Canada: Nutritional Bars Market, by Distribution Channel
- 10.2.5.3 Mexico: Nutritional Bars Market - Revenue and Forecast to 2028 (US$ Million)
- 10.2.5.3.1 Mexico: Nutritional Bars Market, By Type
- 10.2.5.3.2 Mexico: Nutritional Bars Market, by Category
- 10.2.5.3.3 Mexico: Nutritional Bars Market, by Distribution Channel
- 10.2.5.1 US: Nutritional Bars Market - Revenue and Forecast to 2028 (US$ Million)
- 10.3 Europe: Nutritional Bars Market
- 10.3.1 Europe: Nutritional Bars Market -Revenue and Forecast to 2028 (US$ Million)
- 10.3.2 Europe: Nutritional Bars Market, By Type
- 10.3.3 Europe: Nutritional Bars Market, by Category
- 10.3.4 Europe: Nutritional Bars Market, by Distribution Channel
- 10.3.5 Europe: Nutritional Bars Market, by Key Country
- 10.3.5.1 Germany: Nutritional Bars Market - Revenue and Forecast to 2028 (US$ Million)
- 10.3.5.1.1 Germany: Nutritional Bars Market, By Type
- 10.3.5.1.2 Germany: Nutritional Bars Market, by Category
- 10.3.5.1.3 Germany: Nutritional Bars Market, by Distribution Channel
- 10.3.5.2 France: Nutritional Bars Market - Revenue and Forecast to 2028 (US$ Million)
- 10.3.5.2.1 France: Nutritional Bars Market, By Type
- 10.3.5.2.2 France: Nutritional Bars Market, by Category
- 10.3.5.2.3 France: Nutritional Bars Market, by Distribution Channel
- 10.3.5.3 UK: Nutritional Bars Market - Revenue and Forecast to 2028 (US$ Million)
- 10.3.5.3.1 UK: Nutritional Bars Market, By Type
- 10.3.5.3.2 UK: Nutritional Bars Market, by Category
- 10.3.5.3.3 UK: Nutritional Bars Market, by Distribution Channel
- 10.3.5.4 Italy: Nutritional Bars Market - Revenue and Forecast to 2028 (US$ Million)
- 10.3.5.4.1 Italy: Nutritional Bars Market, By Type
- 10.3.5.4.2 Italy: Nutritional Bars Market, by Category
- 10.3.5.4.3 Italy: Nutritional Bars Market, by Distribution Channel
- 10.3.5.5 Russia: Nutritional Bars Market - Revenue and Forecast to 2028 (US$ Million)
- 10.3.5.5.1 Russia: Nutritional Bars Market, By Type
- 10.3.5.5.2 Russia: Nutritional Bars Market, by Category
- 10.3.5.5.3 Russia: Nutritional Bars Market, by Distribution Channel
- 10.3.5.6 Rest of Europe: Nutritional Bars Market - Revenue and Forecast to 2028 (US$ Million)
- 10.3.5.6.1 Rest of Europe: Nutritional Bars Market, By Type
- 10.3.5.6.2 Rest of Europe: Nutritional Bars Market, by Category
- 10.3.5.6.3 Rest of Europe: Nutritional Bars Market, by Distribution Channel
- 10.3.5.1 Germany: Nutritional Bars Market - Revenue and Forecast to 2028 (US$ Million)
- 10.4 Asia Pacific: Nutritional Bars Market
- 10.4.1 Asia Pacific: Nutritional Bars Market -Revenue and Forecast to 2028 (US$ Million)
- 10.4.2 Asia Pacific: Nutritional Bars Market, By Type
- 10.4.3 Asia Pacific: Nutritional Bars Market, by Category
- 10.4.4 Asia Pacific: Nutritional Bars Market, by Distribution Channel
- 10.4.5 Asia Pacific: Nutritional Bars Market, by Key Country
- 10.4.5.1 China: Nutritional Bars Market -Revenue and Forecast to 2028 (US$ Million)
- 10.4.5.1.1 China: Nutritional Bars Market, By Type
- 10.4.5.1.2 China: Nutritional Bars Market, by Category
- 10.4.5.1.3 China: Nutritional Bars Market, by Distribution Channel
- 10.4.5.2 Japan: Nutritional Bars Market -Revenue and Forecast to 2028 (US$ Million)
- 10.4.5.2.1 Japan: Nutritional Bars Market, By Type
- 10.4.5.2.2 Japan: Nutritional Bars Market, by Category
- 10.4.5.2.3 Japan: Nutritional Bars Market, by Distribution Channel
- 10.4.5.3 India: Nutritional Bars Market -Revenue and Forecast to 2028 (US$ Million)
- 10.4.5.3.1 India: Nutritional Bars Market, by Type
- 10.4.5.3.2 India: Nutritional Bars Market, by Category
- 10.4.5.3.3 India: Nutritional Bars Market, by Distribution Channel
- 10.4.5.4 Australia: Nutritional Bars Market -Revenue and Forecast to 2028 (US$ Million)
- 10.4.5.4.1 Australia: Nutritional Bars Market, By Type
- 10.4.5.4.2 Australia: Nutritional Bars Market, by Category
- 10.4.5.4.3 Australia: Nutritional Bars Market, by Distribution Channel
- 10.4.5.5 South Korea: Nutritional Bars Market -Revenue and Forecast to 2028 (US$ Million)
- 10.4.5.5.1 South Korea: Nutritional Bars Market, By Type
- 10.4.5.5.2 South Korea: Nutritional Bars Market, by Category
- 10.4.5.5.3 South Korea: Nutritional Bars Market, by Distribution Channel
- 10.4.5.6 Rest of Asia Pacific: Nutritional Bars Market -Revenue and Forecast to 2028 (US$ Million)
- 10.4.5.6.1 Rest of Asia Pacific: Nutritional Bars Market, By Type
- 10.4.5.6.2 Rest of Asia Pacific: Nutritional Bars Market, by Category
- 10.4.5.6.3 Rest of Asia Pacific: Nutritional Bars Market, by Distribution Channel
- 10.4.5.1 China: Nutritional Bars Market -Revenue and Forecast to 2028 (US$ Million)
- 10.5 South and Central America: Nutritional Bars Market
- 10.5.1 South and Central America: Nutritional Bars Market -Revenue and Forecast to 2028 (US$ Million)
- 10.5.2 South and Central America: Nutritional Bars Market, By Type
- 10.5.3 South and Central America: Nutritional Bars Market, by Category
- 10.5.4 South and Central America: Nutritional Bars Market, by Distribution Channel
- 10.5.5 South and Central America: Nutritional Bars Market, by Key Country
- 10.5.5.1 Brazil: Nutritional Bars Market - Revenue and Forecast to 2028 (US$ Million)
- 10.5.5.1.1 Brazil: Nutritional Bars Market, By Type
- 10.5.5.1.2 Brazil: Nutritional Bars Market, by Category
- 10.5.5.1.3 Brazil: Nutritional Bars Market, by Distribution Channel
- 10.5.5.2 Argentina: Nutritional Bars Market - Revenue and Forecast to 2028 (US$ Million)
- 10.5.5.2.1 Argentina: Nutritional Bars Market, By Type
- 10.5.5.2.2 Argentina: Nutritional Bars Market, by Category
- 10.5.5.2.3 Argentina: Nutritional Bars Market, by Distribution Channel
- 10.5.5.3 Rest of South and Central America: Nutritional Bars Market - Revenue and Forecast to 2028 (US$ Million)
- 10.5.5.3.1 Rest of South and Central America: Nutritional Bars Market, By Type
- 10.5.5.3.2 Rest of South and Central America: Nutritional Bars Market, by Category
- 10.5.5.3.3 Rest of South and Central America: Nutritional Bars Market, by Distribution Channel
- 10.5.5.1 Brazil: Nutritional Bars Market - Revenue and Forecast to 2028 (US$ Million)
- 10.6 Middle East and Africa: Nutritional Bars Market
- 10.6.1 Middle East and Africa: Nutritional Bars Market -Revenue and Forecast to 2028 (US$ Million)
- 10.6.2 Middle East and Africa: Nutritional Bars Market, By Type
- 10.6.3 Middle East and Africa: Nutritional Bars Market, by Category
- 10.6.4 Middle East and Africa: Nutritional Bars Market, by Distribution Channel
- 10.6.5 Middle East and Africa: Nutritional Bars Market, by Key Country
- 10.6.5.1 Saudi Arabia: Nutritional Bars Market -Revenue and Forecast to 2028 (US$ Million)
- 10.6.5.1.1 Saudi Arabia: Nutritional Bars Market, By Type
- 10.6.5.1.2 Saudi Arabia: Nutritional Bars Market, by Category
- 10.6.5.1.3 Saudi Arabia: Nutritional Bars Market, by Distribution Channel
- 10.6.5.2 UAE: Nutritional Bars Market -Revenue and Forecast to 2028 (US$ Million)
- 10.6.5.2.1 UAE: Nutritional Bars Market, By Type
- 10.6.5.2.2 UAE: Nutritional Bars Market, by Category
- 10.6.5.2.3 UAE: Nutritional Bars Market, by Distribution Channel
- 10.6.5.3 South Africa: Nutritional Bars Market -Revenue and Forecast to 2028 (US$ Million)
- 10.6.5.3.1 South Africa: Nutritional Bars Market, By Type
- 10.6.5.3.2 South Africa: Nutritional Bars Market, by Category
- 10.6.5.3.3 South Africa: Nutritional Bars Market, by Distribution Channel
- 10.6.5.4 Rest of Middle East and Africa: Nutritional Bars Market -Revenue and Forecast to 2028 (US$ Million)
- 10.6.5.4.1 Rest of Middle East and Africa: Nutritional Bars Market, by Type
- 10.6.5.4.2 Rest of Middle East and Africa: Nutritional Bars Market, by Category
- 10.6.5.4.3 Rest of Middle East and Africa: Nutritional Bars Market, by Distribution Channel
- 10.6.5.1 Saudi Arabia: Nutritional Bars Market -Revenue and Forecast to 2028 (US$ Million)
11. Impact of COVID-19 Pandemic on Nutritional Bars Market
- 11.1 Impact of COVID-19 on Nutritional Bars Market
- 11.2 North America: Impact Assessment of COVID-19 Pandemic
- 11.3 Europe: Impact Assessment of COVID-19 Pandemic
- 11.4 Asia Pacific: Impact Assessment of COVID-19 Pandemic
- 11.5 Middle East & Africa: Impact Assessment of COVID-19 Pandemic
- 11.6 South & Central America: Impact Assessment of COVID-19 Pandemic
12. Industry Landscape
- 12.1 Overview
- 12.2 Product launch
13. Company Profiles
- 13.1 The Simply Good Foods Co
- 13.1.1 Key Facts
- 13.1.2 Business Description
- 13.1.3 Products and Services
- 13.1.4 Financial Overview
- 13.1.5 SWOT Analysis
- 13.1.6 Key Developments
- 13.2 Clif Bar & Co
- 13.2.1 Key Facts
- 13.2.2 Business Description
- 13.2.3 Products and Services
- 13.2.4 Financial Overview
- 13.2.5 SWOT Analysis
- 13.2.6 Key Developments
- 13.3 General Mills Inc
- 13.3.1 Key Facts
- 13.3.2 Business Description
- 13.3.3 Products and Services
- 13.3.4 Financial Overview
- 13.3.5 SWOT Analysis
- 13.3.6 Key Developments
- 13.4 The Kellogg Co
- 13.4.1 Key Facts
- 13.4.2 Business Description
- 13.4.3 Products and Services
- 13.4.4 Financial Overview
- 13.4.5 SWOT Analysis
- 13.4.6 Key Developments
- 13.5 Rise Bar Inc
- 13.5.1 Key Facts
- 13.5.2 Business Description
- 13.5.3 Products and Services
- 13.5.4 Financial Overview
- 13.5.5 SWOT Analysis
- 13.5.6 Key Developments
- 13.6 The Quaker Oats Co
- 13.6.1 Key Facts
- 13.6.2 Business Description
- 13.6.3 Products and Services
- 13.6.4 Financial Overview
- 13.6.5 SWOT Analysis
- 13.6.6 Key Developments
- 13.7 Perfect Bar LLC
- 13.7.1 Key Facts
- 13.7.2 Business Description
- 13.7.3 Products and Services
- 13.7.4 Financial Overview
- 13.7.5 SWOT Analysis
- 13.7.6 Key Developments
- 13.8 Mars Inc
- 13.8.1 Key Facts
- 13.8.2 Business Description
- 13.8.3 Products and Services
- 13.8.4 Financial Overview
- 13.8.5 SWOT Analysis
- 13.8.6 Key Developments
- 13.9 Kind LLC
- 13.9.1 Key Facts
- 13.9.2 Business Description
- 13.9.3 Products and Services
- 13.9.4 Financial Overview
- 13.9.5 SWOT Analysis
- 13.9.6 Key Developments
- 13.10 Premier Nutrition Co LLC
- 13.10.1 Key Facts
- 13.10.2 Business Description
- 13.10.3 Products and Services
- 13.10.4 Financial Overview
- 13.10.5 SWOT Analysis
- 13.10.6 Key Developments
14. Appendix
- 14.1 About The Insight Partners
- 14.2 Word Index