
栄養バー市場の機会、成長促進要因、産業動向分析、2025年~2034年の予測
Nutritional Bars Market Opportunity, Growth Drivers, Industry Trend Analysis, and Forecast 2025 - 2034
- 発行日
- ページ情報
- 英文 220 Pages
- 納期
- 2~3営業日
- 商品コード
- 1716530
- カスタマイズ可能 お客様のご希望に応じて、既存データの加工や未掲載情報(例:国別セグメント)の追加などの対応が可能です。詳細はお問い合わせください。
- 翻訳ツール提供対象 PDF対応AI翻訳ツールの無料貸し出しサービスのご利用が可能です
概要
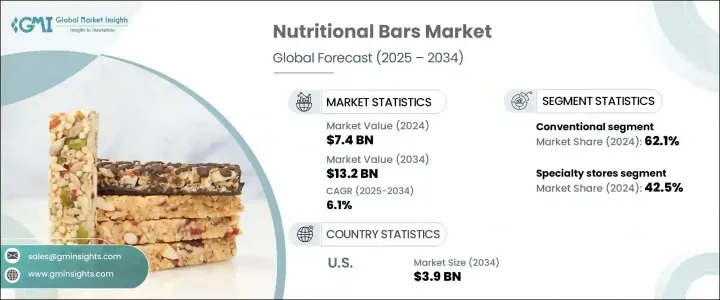
栄養バーの世界市場は2024年に74億米ドルに達し、より健康的で外出先での間食オプションに対する需要の急増を背景に、2025年から2034年にかけてCAGR 6.1%で拡大すると予測されます。
フィットネス、ウェルネス、バランスの取れたライフスタイルへの注目が高まる中、消費者は味に妥協することなく機能的なメリットを提供する便利なスナックを積極的に求めています。世界的に健康意識が高まるにつれ、人々は従来の高カロリー・スナックや加工食品に代わる理想的な選択肢として栄養バーを選ぶようになっています。タンパク質が豊富で低糖質、グルテンフリー、オーガニック製品への嗜好の高まりは、消費者の期待を再定義し、ブランドは進化する食生活のニーズに沿った革新的な製品を提供するよう促しています。
現代の消費者はまた、原材料の透明性、持続可能性、倫理的な調達に細心の注意を払っており、ブランドは認知度の高い天然原材料を使用したクリーンラベル処方を採用するよう促されています。さらに、eコマースの浸透とスーパーマーケット、コンビニエンスストア、フィットネスセンターでの手軽な製品入手が相まって、栄養バーの売上に拍車がかかり続けています。都市部の人口がペースの速い日常生活を採用し、ホリスティックな健康を優先するようになるにつれ、栄養バーは、運動前のエネルギー補給、食事の置き換え、多忙なスケジュール中の手軽な間食など、持ち運び可能な栄養を求める消費者の定番商品として台頭しています。
| 市場範囲 | |
|---|---|
| 開始年 | 2024 |
| 予測年 | 2025-2034 |
| 開始金額 | 74億米ドル |
| 予測金額 | 132億米ドル |
| CAGR | 6.1% |
市場は、シリアル/グラノーラ・バー、プロテイン・バー、エネルギー・バー/ミールリプレイスメント・バー、フルーツ・バー、ナッツ・バーなど、さまざまなタイプの栄養バーに区分されます。このうち、シリアル/グラノーラ・バーは、健康的で食物繊維が豊富で、持続的なエネルギーを提供するスナックとして広くアピールされているため、圧倒的なシェアを占めています。より体に良いものを選ぶ消費者が増えるにつれ、低糖質、高タンパク質、オーガニックのシリアル&グラノーラ・バーの需要が勢いを増しています。各ブランドは、プロバイオティクス、コラーゲン、アダプトゲンなどの機能性成分を強化した製品を発売し、健康増進処方への関心の高まりに応えています。特にプロテインバーは、フィットネス愛好家やアスリート、筋肉の回復や体重管理のサポートを求める個人からの需要が高まっています。消費者が原材料に精通するようになるにつれ、人工的な添加物や保存料を使用せず、クリーンな栄養を提供するバーに対する嗜好が強くなっています。
市場はまた、グルテンフリー・セグメントと従来型セグメントに分類されます。コンベンショナル・バーの市場シェアは現在62.1%と大きく、これは幅広い入手しやすさと手頃な価格によるものです。しかし、セリアック病、グルテン不耐症、穀物代替食品の利点に関する認識が高まるにつれて、グルテンフリーの栄養バーが急速に普及しています。メーカー各社は、キヌア、アマランサス、そばのような栄養価の高い穀物を配合した栄養バーを開発し、グルテンに敏感な消費者と健康志向の一般消費者の両方にアピールしています。しかし、味、食感、費用対効果のバランスが取れたグルテンフリーバーの開発は依然として難題であり、各ブランドは研究開発への投資を余儀なくされています。
米国の栄養バー市場は世界シェアの28%を占め、2024年には21億米ドルを創出します。フィットネス文化が定着していることに加え、オーガニック、非遺伝子組み換え、クリーンラベル製品に対する需要が高まっていることも、米国市場の拡大を後押ししています。さらに、健康的な食生活を推進する政府の取り組みが良好であることに加え、小売やeコマースのプラットフォームが成長していることも、堅調な売上を支えています。とはいえ、熾烈な競合と高い生産コストは、差別化と収益性の維持を目指すブランドにとって依然として重要な課題です。
目次
第1章 調査手法と調査範囲
第2章 エグゼクティブサマリー
第3章 業界洞察
- エコシステム分析
- バリューチェーンに影響を与える要因
- 利益率分析
- ディスラプション
- 将来の展望
- メーカー
- 流通業者
- サプライヤーの状況
- 利益率分析
- 主要ニュースと取り組み
- 規制状況
- 影響要因
- 促進要因
- 業界の潜在的リスク&課題
- 潜在成長力分析
- ポーター分析
- PESTEL分析
第4章 競合情勢
- イントロダクション
- 企業シェア分析
- 競合のポジショニング・マトリックス
- 戦略展望マトリックス
第5章 市場推計・予測:製品別、2021年~2034年
- 主要動向
- シリアル/グラノーラバー
- プロテインバー
- エナジーバー/ミールリプレイスメントバー
- フルーツ&ナッツバー
- その他(ダイエットバー、炭水化物バー、持久力バー)
第6章 市場推計・予測:カテゴリー別、2021年~2034年
- 主要動向
- グルテンフリー
- コンベンショナル
第7章 市場推計・予測:流通チャネル別、2021年~2034年
- 主要動向
- ハイパーマーケット/スーパーマーケット
- 専門店
- オンライン小売
- その他
第8章 市場推計・予測:地域別、2021年~2034年
- 主要動向
- 北米
- 米国
- カナダ
- 欧州
- ドイツ
- 英国
- フランス
- スペイン
- イタリア
- ロシア
- アジア太平洋
- 中国
- インド
- 日本
- オーストラリア
- 韓国
- ラテンアメリカ
- ブラジル
- メキシコ
- 中東・アフリカ
- サウジアラビア
- 南アフリカ
- アラブ首長国連邦
第9章 企業プロファイル
- General Mills Inc
- Ajinomoto Co Inc
- Cargill Incorporated
- Mondelez International
- Glanbia Plc
- HEALTHY BARS
- ADM
- Global Nutrition International
- The Simply Good Foods Company
- The Kellogg Company.
目次
The Global Nutritional Bars Market reached USD 7.4 billion in 2024 and is projected to expand at a CAGR of 6.1% between 2025 and 2034, driven by the surging demand for healthier, on-the-go snacking options. With the rising focus on fitness, wellness, and balanced lifestyles, consumers are actively seeking convenient snacks that offer functional benefits without compromising on taste. As health awareness grows globally, people are turning to nutritional bars as an ideal alternative to traditional high-calorie snacks and processed foods. The increasing preference for protein-rich, low-sugar, gluten-free, and organic products has redefined consumer expectations, encouraging brands to deliver innovative products that align with evolving dietary needs.
Modern consumers are also paying close attention to ingredient transparency, sustainability, and ethical sourcing, prompting brands to adopt clean-label formulations with recognizable, natural ingredients. Moreover, the growing penetration of e-commerce, coupled with easy product availability in supermarkets, convenience stores, and fitness centers, continues to fuel sales of nutritional bars. As urban populations adopt fast-paced routines and prioritize holistic health, nutritional bars have emerged as a staple for consumers seeking portable nutrition, whether for pre-workout energy, meal replacement, or quick snacks during busy schedules.
| Market Scope | |
|---|---|
| Start Year | 2024 |
| Forecast Year | 2025-2034 |
| Start Value | $7.4 Billion |
| Forecast Value | $13.2 Billion |
| CAGR | 6.1% |
The market is segmented into various types of nutritional bars, including cereal/granola bars, protein bars, energy bars/meal replacement bars, fruit and nut bars, and others. Among these, cereal and granola bars dominate due to their widespread appeal as wholesome, fiber-rich snacks that provide sustained energy. As more consumers opt for better-for-you options, demand for low-sugar, high-protein, and organic variants of cereal and granola bars is gaining momentum. Brands are launching products enriched with functional ingredients like probiotics, collagen, and adaptogens to meet the rising interest in health-boosting formulations. Protein bars, in particular, are seeing heightened demand from fitness enthusiasts, athletes, and individuals seeking muscle recovery or weight management support. With consumers becoming increasingly ingredient-savvy, there is a strong preference for bars that offer clean nutrition, free from artificial additives and preservatives.
The market is also categorized into gluten-free and conventional segments. Conventional bars currently command a significant 62.1% market share, driven by broad accessibility and affordability. However, gluten-free nutritional bars are rapidly gaining traction as awareness about celiac disease, gluten intolerance, and the benefits of grain alternatives rises. Manufacturers are responding by formulating bars with nutrient-dense grains such as quinoa, amaranth, and buckwheat, which appeal to both gluten-sensitive and general health-conscious consumers. Yet, the development of gluten-free bars that balance taste, texture, and cost-effectiveness continues to be a challenge, pushing brands to invest in R&D.
U.S. Nutritional Bars Market accounted for 28% of the global share, generating USD 2.1 billion in 2024, propelled by growing consumer interest in protein-enriched and functional foods. A well-established fitness culture, coupled with heightened demand for organic, non-GMO, and clean-label products, reinforces market expansion in the U.S. Moreover, favorable government initiatives promoting healthy eating, combined with the growth of retail and e-commerce platforms, support robust sales. Nevertheless, fierce competition and high production costs remain critical challenges for brands aiming to differentiate and sustain profitability.
Table of Contents
Chapter 1 Methodology & Scope
- 1.1 Market scope & definition
- 1.2 Base estimates & calculations
- 1.3 Forecast calculation
- 1.4 Data sources
- 1.4.1 Primary
- 1.4.2 Secondary
- 1.4.2.1 Paid sources
- 1.4.2.2 Public sources
- 1.5 Primary research and validation
- 1.5.1 Primary sources
- 1.5.2 Data mining sources
Chapter 2 Executive Summary
- 2.1 Industry synopsis, 2021-2034
Chapter 3 Industry Insights
- 3.1 Industry ecosystem analysis
- 3.1.1 Factor affecting the value chain
- 3.1.2 Profit margin analysis
- 3.1.3 Disruptions
- 3.1.4 Future outlook
- 3.1.5 Manufacturers
- 3.1.6 Distributors
- 3.2 Supplier landscape
- 3.3 Profit margin analysis
- 3.4 Key news & initiatives
- 3.5 Regulatory landscape
- 3.6 Impact forces
- 3.6.1 Growth drivers
- 3.6.2 Industry pitfalls & challenges
- 3.7 Growth potential analysis
- 3.8 Porter's analysis
- 3.9 PESTEL analysis
Chapter 4 Competitive Landscape, 2024
- 4.1 Introduction
- 4.2 Company market share analysis
- 4.3 Competitive positioning matrix
- 4.4 Strategic outlook matrix
Chapter 5 Market Estimates and Forecast, By Product, 2021 – 2034 (USD Billion) (Kilo Tons)
- 5.1 Key trends
- 5.2 Cereal/Granola bars
- 5.3 Protein bars
- 5.4 Energy Bars/ Meal replacements bars
- 5.5 Fruits & nuts bars
- 5.6 Others (Diet Bars, Carbohydrate Bars, Endurance bars)
Chapter 6 Market Estimates and Forecast, By Category, 2021 – 2034 (USD Billion) (Kilo Tons)
- 6.1 Key trends
- 6.2 Gluten-free
- 6.3 Conventional
Chapter 7 Market Estimates and Forecast, By Distribution Channel, 2021 – 2034 (USD Billion) (Kilo Tons)
- 7.1 Key trends
- 7.2 Hypermarkets/Supermarkets
- 7.3 Specialty stores
- 7.4 Online retail
- 7.5 Others
Chapter 8 Market Estimates and Forecast, By Region, 2021 – 2034 (USD Billion) (Kilo Tons)
- 8.1 Key trends
- 8.2 North America
- 8.2.1 U.S.
- 8.2.2 Canada
- 8.3 Europe
- 8.3.1 Germany
- 8.3.2 UK
- 8.3.3 France
- 8.3.4 Spain
- 8.3.5 Italy
- 8.3.6 Russia
- 8.4 Asia Pacific
- 8.4.1 China
- 8.4.2 India
- 8.4.3 Japan
- 8.4.4 Australia
- 8.4.5 South Korea
- 8.5 Latin America
- 8.5.1 Brazil
- 8.5.2 Mexico
- 8.6 Middle East and Africa
- 8.6.1 Saudi Arabia
- 8.6.2 South Africa
- 8.6.3 UAE
Chapter 9 Company Profiles
- 9.1 General Mills Inc
- 9.2 Ajinomoto Co Inc
- 9.3 Cargill Incorporated
- 9.4 Mondelez International
- 9.5 Glanbia Plc
- 9.6 HEALTHY BARS
- 9.7 ADM
- 9.8 Global Nutrition International
- 9.9 The Simply Good Foods Company
- 9.10 The Kellogg Company.
- 発行日
- 発行
- Global Market Insights Inc.
- ページ情報
- 英文 220 Pages
- 納期
- 2~3営業日


