|
|
市場調査レポート
商品コード
1284180
エナジーバー市場の2028年までの予測- タイプ別(シリアルバー、プロテインバー、ファイバーバー、栄養バー、エンデュランスバー、アクティビティバー、オーツバー、その他のタイプ)、流通チャネル別、フレーバー別、性質別、地域別の世界分析Energy Bar Market Forecasts to 2028 - Global Analysis By Type (Cereal Bar, Protein Bar, Fiber Bar, Nutrition Bar, Endurance Bars, Activity Bars, Oat Bars and Other Types), Distribution Channel, Flavor, Nature and By Geography |
||||||
|
|
|||||||
カスタマイズ可能
|
|||||||


| エナジーバー市場の2028年までの予測- タイプ別(シリアルバー、プロテインバー、ファイバーバー、栄養バー、エンデュランスバー、アクティビティバー、オーツバー、その他のタイプ)、流通チャネル別、フレーバー別、性質別、地域別の世界分析 |
|
出版日: 2023年06月01日
発行: Stratistics Market Research Consulting
ページ情報: 英文 175+ Pages
納期: 2~3営業日
|

- 全表示
- 概要
- 図表
- 目次
Stratistics MRCによると、世界のエナジーバー市場は、2022年に6億8,226万米ドルを占め、2028年には10億6,949万米ドルに達すると予測され、予測期間中に7.78%のCAGRで成長するとされています。
エナジーバーとして知られる栄養補助食品は、エネルギーだけでなく、栄養的な利点やダイエット効果も提供します。エナジーバーには、タンパク質、脂質、炭水化物が含まれているため、食事の代わりとして使用されることが多く、ユーザーに迅速なエネルギーを与えるのに役立ちます。タンパク質と炭水化物のおかげで、運動やトレーニングに必要なエネルギーを得ることができるかもしれません。さらに、運動後に、運動中に生じた筋肉の小さな損傷を修復し、新しい筋肉組織を成長させるために必要な栄養を体に与えることができます。
国際食品情報協議会の食品・健康調査報告書によると、2021年に食品に健康効果を積極的に求める米国消費者の割合は20%でした。
市場力学
促進要因
パック入り食品への人気上昇
消費者のパック入りスナックやスイーツへの嗜好が高まり、エナジーバーの需要が高まっています。顧客の消費力が向上し、おいしいものへの嗜好が高まったことで、エナジーバーの消費は人気を博しています。さらに、スナック製品の成分バリエーションが消費者の関心を引き、ニーズに応じた製品の購入を促すことで、エナジーバーの市場が拡大しています。
抑制要因
スナックバーに対する先入観は急速に変化している
スナック食品に対する消費者の好みや嗜好が頻繁に変化する結果、主要プレイヤーの調査、生産、流通インフラのコストが上昇し、エナジーバーの市場シェアの拡大が制限されます。さらに、エナジードリンク、クッキー、パウダーなどの代替品の普及がエナジーバー市場を抑制すると予想されます。
機会
ダイエット食品への需要の高まり
ダイエット食品に対する需要の高まりが、低炭水化物や低脂肪のエナジーバーの消費量増加の原因となっています。また、化学物質を含まない自然食品の健康へのメリットを認識する人が増えているため、グルテンフリーや非アレルギーの栄養食品の開発がより実用的になってきています。さらに、糖尿病患者の増加に伴い、低糖質食品を摂取する人が増えており、新たな市場機会が生まれています。
脅威
エナジーバーの高コスト
エナジーバーは、ピーカン、カシューナッツ、アーモンドなど、素早くエネルギーを供給する高級食材を使用しているため、価格が高く、多くの個人にとって高価なものとなっています。さらに、エナジーバーのプレミアムパッケージには、包装や箱が含まれ、エナジーバー全体のコストを引き上げています。これらは、専門家がエナジーバーの市場価値を低下させると予測する要素の一部です。
COVID-19の影響:
新型コロナウイルスのパンデミックにより、数多くの産業が大きな被害を受けました。この間、世界のエネルギー市場は緩やかに拡大しました。パンデミックの発生は、エナジーバー市場に、需要、製造、サプライチェーン、市場の混乱という3つの主要な影響を及ぼしました。しかし、栄養やエネルギーの必要量を簡単に補給できること、スピーディーな用途、保存の利便性などの動向の高まりから、コンビニエンスストアは創作スナックの需要を膨らませました。その結果、優れた健康に対する価値観が飛躍的に高まり、市場の拡大に適度な弾みをつけています。
予測期間中、プロテインバー分野が最も大きくなると予想される
プロテインバー分野は、有利な成長を遂げると推定されます。高タンパク、高炭水化物のスナックにはプロテインバーがあり、携帯に便利です。タンパク質やその他のビタミン、ミネラルの供給源として最適です。健康意識の高まり、社会経済状況の変化、栄養価の高い食品を準備する時間の不足などから、パッケージ食品やコンビニエンスフーズの需要は急速に高まっています。
予測期間中、オーガニックセグメントが最も高いCAGRを示すと予想される
オーガニックセグメントは、予測期間中に最も高いCAGR成長を遂げると予測されています。オーガニック・エナジーバーは、高栄養で栄養密度の高いスナックであり、さまざまなビタミンやミネラルを摂取して身体的エネルギーを高めることができます。オーガニック・エナジーバーの原材料は、合成農薬や肥料を使用しない農場で生産されたものです。オーガニックカテゴリーの拡大は、健康的でオーガニックな高栄養価のスナックに対する需要の増加とスポーツ栄養に対するニーズの高まりによってもたらされると予測されます。
最もシェアの高い地域
北米は、予測期間中、最大の市場シェアを占めると予測されます。これは、アメリカ人の生活様式が、活動的でペースが速いことで知られているためです。そのペースの速いライフスタイルのため、最も発展した国の一つである米国では、非常に簡単な料理が期待されています。米国農務省(USDA)は、米国人の食費の半分以上をスナックバーなどの手軽な食事に費やしていると主張しており、このことがこれらの商品の消費量を増加させています。
CAGRの最も高い地域:
予測期間中、CAGRが最も高いのは欧州と予測されています。この市場は、栄養学的な利点を持つより健康的な食材に対する顧客の知識が深まったことによって刺激されました。顧客は、製品の栄養価を高めるエナジーバー中の機能性果物や穀物、例えばベリー類、ヘンプ、チア、亜麻仁などを好みます。この市場は、美味しく食べることよりも、衝動買いによって牽引されてきました。しかし、高繊維、低カロリー、高タンパク、天然素材を使用した食品が人気を集めています。
主な発展:
2022年8月、エナジーバーを展開するClif Bar &Companyが、Mondelez International, Inc.に買収されました。CLIF、CLIF Kid、LUNAなどの主要ブランドが、米国での冷蔵スナッキング事業や英国での人気パフォーマンス栄養事業Grenadeを補完することで、この買収によりMondelez Internationalの世界のスナックバー事業は10億米ドル以上に拡大すると予想されます。
2021年8月、ゼネラル・ミルズ社は、シナモン・トースト・クランチとゴールデン・グラハム・ブランドからパフォーマンス・プロテイン・バーを発売しました。これらのバーは砂糖が少なく、約63gのバー重量で最大20gのタンパク質を摂取できます。
2021年4月、Kellogg Indiaは「In-between meal」セグメントをターゲットにしました。このため、このカテゴリーに参入するため、Kエナジーバーを発売しました。
本レポートが提供するもの
- 地域レベルおよび国レベルセグメントの市場シェア評価
- 新規参入企業への戦略的提言
- 2020年、2021年、2022年、2025年、2028年の市場データを収録しています。
- 市場動向(促進要因、抑制要因、機会、脅威、課題、投資機会、推奨事項)
- 市場推定に基づく、主要ビジネスセグメントにおける戦略的提言
- 主要な共通トレンドをマッピングした競合情勢。
- 詳細な戦略、財務、最近の開発状況を含む企業プロファイル
- 最新の技術的進歩をマッピングしたサプライチェーン動向
無料のカスタマイズ提供:
本レポートをご購入いただいたお客様には、以下の無料カスタマイズオプションのいずれかを提供させていただきます:
- 企業プロファイル
- 追加市場プレイヤーの包括的なプロファイリング(最大3社まで)
- 主要プレーヤーのSWOT分析(3社まで)
- 地域別セグメンテーション
- お客様のご希望に応じて、主要国の市場推計・予測・CAGR(注:フィージビリティチェックによる。)
- 競合ベンチマーキング
- 製品ポートフォリオ、地域的プレゼンス、戦略的提携に基づく主要プレイヤーのベンチマーキング
目次
第1章 エグゼクティブサマリー
第2章 序文
- 概要
- ステークホルダー
- 調査範囲
- 調査手法
- データマイニング
- データ分析
- データ検証
- 調査アプローチ
- 調査ソース
- 1次調査ソース
- 2次調査ソース
- 仮定
第3章 市場動向分析
- 促進要因
- 抑制要因
- 機会
- 脅威
- 新興市場
- 新型コロナウイルス感染症(COVID-19)の影響
第4章 ポーターのファイブフォース分析
- 供給企業の交渉力
- 買い手の交渉力
- 代替品の脅威
- 新規参入業者の脅威
- 競争企業間の敵対関係
第5章 世界のエナジーバー市場:タイプ別
- シリアルバー
- プロテインバー
- ファイバーバー
- 栄養バー
- エンデュランスバー
- アクティビティバー
- オーツバー
- その他のタイプ
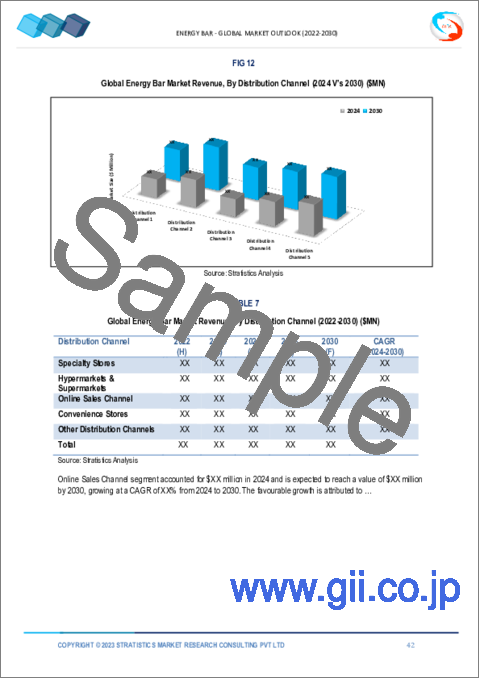
第6章 世界のエナジーバー市場:流通チャネル別
- 専門店
- ハイパーマーケットとスーパーマーケット
- オンライン販売チャネル
- コンビニエンスストア
- その他の流通チャネル
第7章 世界のエナジーバー市場:フレーバー別
- ピーナッツバター
- カラメル
- ハニー
- チョコレート
- その他のフレーバー
第8章 世界のエナジーバー市場:性質別
- 従来型
- オーガニック
第9章 世界のエナジーバー市場:地域別
- 北米
- 米国
- カナダ
- メキシコ
- 欧州
- ドイツ
- 英国
- イタリア
- フランス
- スペイン
- その他欧州
- アジア太平洋地域
- 日本
- 中国
- インド
- オーストラリア
- ニュージーランド
- 韓国
- その他アジア太平洋地域
- 南米
- アルゼンチン
- ブラジル
- チリ
- その他南米
- 中東とアフリカ
- サウジアラビア
- アラブ首長国連邦
- カタール
- 南アフリカ
- その他中東とアフリカ
第10章 主な発展
- 契約、パートナーシップ、コラボレーション、合弁事業
- 買収と合併
- 新製品の発売
- 事業拡大
- その他の主要戦略
第11章 会社概要
- Kellogg Company
- ProBar LLC
- Nature Essential Foods Pvt. Ltd
- EAT Anytime
- PepsiCo Inc.
- Lotus Bakeries
- General Mills Inc.
- Kind LLC
- Post Holdings Inc.
- Clif Bar & Company
- OTE Sports Ltd
- Bumble Bar Inc.
- Science in Sports PLC
- TORQ Limited
- Premier Nutrition Inc.
- Brighter Foods Ltd.
List of Tables
- Table 1 Global Energy Bar Market Outlook, By Region (2020-2028) ($MN)
- Table 2 Global Energy Bar Market Outlook, By Type (2020-2028) ($MN)
- Table 3 Global Energy Bar Market Outlook, By Cereal Bar (2020-2028) ($MN)
- Table 4 Global Energy Bar Market Outlook, By Protein Bar (2020-2028) ($MN)
- Table 5 Global Energy Bar Market Outlook, By Fiber Bar (2020-2028) ($MN)
- Table 6 Global Energy Bar Market Outlook, By Nutrition Bar (2020-2028) ($MN)
- Table 7 Global Energy Bar Market Outlook, By Endurance Bars (2020-2028) ($MN)
- Table 8 Global Energy Bar Market Outlook, By Activity Bars (2020-2028) ($MN)
- Table 9 Global Energy Bar Market Outlook, By Oat Bars (2020-2028) ($MN)
- Table 10 Global Energy Bar Market Outlook, By Other Types (2020-2028) ($MN)
- Table 11 Global Energy Bar Market Outlook, By Distribution Channel (2020-2028) ($MN)
- Table 12 Global Energy Bar Market Outlook, By Specialty Stores (2020-2028) ($MN)
- Table 13 Global Energy Bar Market Outlook, By Hypermarkets & Supermarkets (2020-2028) ($MN)
- Table 14 Global Energy Bar Market Outlook, By Online Sales Channel (2020-2028) ($MN)
- Table 15 Global Energy Bar Market Outlook, By Convenience Stores (2020-2028) ($MN)
- Table 16 Global Energy Bar Market Outlook, By Other Distribution Channels (2020-2028) ($MN)
- Table 17 Global Energy Bar Market Outlook, By Flavor (2020-2028) ($MN)
- Table 18 Global Energy Bar Market Outlook, By Peanut Butter (2020-2028) ($MN)
- Table 19 Global Energy Bar Market Outlook, By Caramel (2020-2028) ($MN)
- Table 20 Global Energy Bar Market Outlook, By Honey (2020-2028) ($MN)
- Table 21 Global Energy Bar Market Outlook, By Chocolate (2020-2028) ($MN)
- Table 22 Global Energy Bar Market Outlook, By Other Flavors (2020-2028) ($MN)
- Table 23 Global Energy Bar Market Outlook, By Nature (2020-2028) ($MN)
- Table 24 Global Energy Bar Market Outlook, By Conventional (2020-2028) ($MN)
- Table 25 Global Energy Bar Market Outlook, By Organic (2020-2028) ($MN)
- Table 26 North America Energy Bar Market Outlook, By Country (2020-2028) ($MN)
- Table 27 North America Energy Bar Market Outlook, By Type (2020-2028) ($MN)
- Table 28 North America Energy Bar Market Outlook, By Cereal Bar (2020-2028) ($MN)
- Table 29 North America Energy Bar Market Outlook, By Protein Bar (2020-2028) ($MN)
- Table 30 North America Energy Bar Market Outlook, By Fiber Bar (2020-2028) ($MN)
- Table 31 North America Energy Bar Market Outlook, By Nutrition Bar (2020-2028) ($MN)
- Table 32 North America Energy Bar Market Outlook, By Endurance Bars (2020-2028) ($MN)
- Table 33 North America Energy Bar Market Outlook, By Activity Bars (2020-2028) ($MN)
- Table 34 North America Energy Bar Market Outlook, By Oat Bars (2020-2028) ($MN)
- Table 35 North America Energy Bar Market Outlook, By Other Types (2020-2028) ($MN)
- Table 36 North America Energy Bar Market Outlook, By Distribution Channel (2020-2028) ($MN)
- Table 37 North America Energy Bar Market Outlook, By Specialty Stores (2020-2028) ($MN)
- Table 38 North America Energy Bar Market Outlook, By Hypermarkets & Supermarkets (2020-2028) ($MN)
- Table 39 North America Energy Bar Market Outlook, By Online Sales Channel (2020-2028) ($MN)
- Table 40 North America Energy Bar Market Outlook, By Convenience Stores (2020-2028) ($MN)
- Table 41 North America Energy Bar Market Outlook, By Other Distribution Channels (2020-2028) ($MN)
- Table 42 North America Energy Bar Market Outlook, By Flavor (2020-2028) ($MN)
- Table 43 North America Energy Bar Market Outlook, By Peanut Butter (2020-2028) ($MN)
- Table 44 North America Energy Bar Market Outlook, By Caramel (2020-2028) ($MN)
- Table 45 North America Energy Bar Market Outlook, By Honey (2020-2028) ($MN)
- Table 46 North America Energy Bar Market Outlook, By Chocolate (2020-2028) ($MN)
- Table 47 North America Energy Bar Market Outlook, By Other Flavors (2020-2028) ($MN)
- Table 48 North America Energy Bar Market Outlook, By Nature (2020-2028) ($MN)
- Table 49 North America Energy Bar Market Outlook, By Conventional (2020-2028) ($MN)
- Table 50 North America Energy Bar Market Outlook, By Organic (2020-2028) ($MN)
- Table 51 Europe Energy Bar Market Outlook, By Country (2020-2028) ($MN)
- Table 52 Europe Energy Bar Market Outlook, By Type (2020-2028) ($MN)
- Table 53 Europe Energy Bar Market Outlook, By Cereal Bar (2020-2028) ($MN)
- Table 54 Europe Energy Bar Market Outlook, By Protein Bar (2020-2028) ($MN)
- Table 55 Europe Energy Bar Market Outlook, By Fiber Bar (2020-2028) ($MN)
- Table 56 Europe Energy Bar Market Outlook, By Nutrition Bar (2020-2028) ($MN)
- Table 57 Europe Energy Bar Market Outlook, By Endurance Bars (2020-2028) ($MN)
- Table 58 Europe Energy Bar Market Outlook, By Activity Bars (2020-2028) ($MN)
- Table 59 Europe Energy Bar Market Outlook, By Oat Bars (2020-2028) ($MN)
- Table 60 Europe Energy Bar Market Outlook, By Other Types (2020-2028) ($MN)
- Table 61 Europe Energy Bar Market Outlook, By Distribution Channel (2020-2028) ($MN)
- Table 62 Europe Energy Bar Market Outlook, By Specialty Stores (2020-2028) ($MN)
- Table 63 Europe Energy Bar Market Outlook, By Hypermarkets & Supermarkets (2020-2028) ($MN)
- Table 64 Europe Energy Bar Market Outlook, By Online Sales Channel (2020-2028) ($MN)
- Table 65 Europe Energy Bar Market Outlook, By Convenience Stores (2020-2028) ($MN)
- Table 66 Europe Energy Bar Market Outlook, By Other Distribution Channels (2020-2028) ($MN)
- Table 67 Europe Energy Bar Market Outlook, By Flavor (2020-2028) ($MN)
- Table 68 Europe Energy Bar Market Outlook, By Peanut Butter (2020-2028) ($MN)
- Table 69 Europe Energy Bar Market Outlook, By Caramel (2020-2028) ($MN)
- Table 70 Europe Energy Bar Market Outlook, By Honey (2020-2028) ($MN)
- Table 71 Europe Energy Bar Market Outlook, By Chocolate (2020-2028) ($MN)
- Table 72 Europe Energy Bar Market Outlook, By Other Flavors (2020-2028) ($MN)
- Table 73 Europe Energy Bar Market Outlook, By Nature (2020-2028) ($MN)
- Table 74 Europe Energy Bar Market Outlook, By Conventional (2020-2028) ($MN)
- Table 75 Europe Energy Bar Market Outlook, By Organic (2020-2028) ($MN)
- Table 76 Asia Pacific Energy Bar Market Outlook, By Country (2020-2028) ($MN)
- Table 77 Asia Pacific Energy Bar Market Outlook, By Type (2020-2028) ($MN)
- Table 78 Asia Pacific Energy Bar Market Outlook, By Cereal Bar (2020-2028) ($MN)
- Table 79 Asia Pacific Energy Bar Market Outlook, By Protein Bar (2020-2028) ($MN)
- Table 80 Asia Pacific Energy Bar Market Outlook, By Fiber Bar (2020-2028) ($MN)
- Table 81 Asia Pacific Energy Bar Market Outlook, By Nutrition Bar (2020-2028) ($MN)
- Table 82 Asia Pacific Energy Bar Market Outlook, By Endurance Bars (2020-2028) ($MN)
- Table 83 Asia Pacific Energy Bar Market Outlook, By Activity Bars (2020-2028) ($MN)
- Table 84 Asia Pacific Energy Bar Market Outlook, By Oat Bars (2020-2028) ($MN)
- Table 85 Asia Pacific Energy Bar Market Outlook, By Other Types (2020-2028) ($MN)
- Table 86 Asia Pacific Energy Bar Market Outlook, By Distribution Channel (2020-2028) ($MN)
- Table 87 Asia Pacific Energy Bar Market Outlook, By Specialty Stores (2020-2028) ($MN)
- Table 88 Asia Pacific Energy Bar Market Outlook, By Hypermarkets & Supermarkets (2020-2028) ($MN)
- Table 89 Asia Pacific Energy Bar Market Outlook, By Online Sales Channel (2020-2028) ($MN)
- Table 90 Asia Pacific Energy Bar Market Outlook, By Convenience Stores (2020-2028) ($MN)
- Table 91 Asia Pacific Energy Bar Market Outlook, By Other Distribution Channels (2020-2028) ($MN)
- Table 92 Asia Pacific Energy Bar Market Outlook, By Flavor (2020-2028) ($MN)
- Table 93 Asia Pacific Energy Bar Market Outlook, By Peanut Butter (2020-2028) ($MN)
- Table 94 Asia Pacific Energy Bar Market Outlook, By Caramel (2020-2028) ($MN)
- Table 95 Asia Pacific Energy Bar Market Outlook, By Honey (2020-2028) ($MN)
- Table 96 Asia Pacific Energy Bar Market Outlook, By Chocolate (2020-2028) ($MN)
- Table 97 Asia Pacific Energy Bar Market Outlook, By Other Flavors (2020-2028) ($MN)
- Table 98 Asia Pacific Energy Bar Market Outlook, By Nature (2020-2028) ($MN)
- Table 99 Asia Pacific Energy Bar Market Outlook, By Conventional (2020-2028) ($MN)
- Table 100 Asia Pacific Energy Bar Market Outlook, By Organic (2020-2028) ($MN)
- Table 101 South America Energy Bar Market Outlook, By Country (2020-2028) ($MN)
- Table 102 South America Energy Bar Market Outlook, By Type (2020-2028) ($MN)
- Table 103 South America Energy Bar Market Outlook, By Cereal Bar (2020-2028) ($MN)
- Table 104 South America Energy Bar Market Outlook, By Protein Bar (2020-2028) ($MN)
- Table 105 South America Energy Bar Market Outlook, By Fiber Bar (2020-2028) ($MN)
- Table 106 South America Energy Bar Market Outlook, By Nutrition Bar (2020-2028) ($MN)
- Table 107 South America Energy Bar Market Outlook, By Endurance Bars (2020-2028) ($MN)
- Table 108 South America Energy Bar Market Outlook, By Activity Bars (2020-2028) ($MN)
- Table 109 South America Energy Bar Market Outlook, By Oat Bars (2020-2028) ($MN)
- Table 110 South America Energy Bar Market Outlook, By Other Types (2020-2028) ($MN)
- Table 111 South America Energy Bar Market Outlook, By Distribution Channel (2020-2028) ($MN)
- Table 112 South America Energy Bar Market Outlook, By Specialty Stores (2020-2028) ($MN)
- Table 113 South America Energy Bar Market Outlook, By Hypermarkets & Supermarkets (2020-2028) ($MN)
- Table 114 South America Energy Bar Market Outlook, By Online Sales Channel (2020-2028) ($MN)
- Table 115 South America Energy Bar Market Outlook, By Convenience Stores (2020-2028) ($MN)
- Table 116 South America Energy Bar Market Outlook, By Other Distribution Channels (2020-2028) ($MN)
- Table 117 South America Energy Bar Market Outlook, By Flavor (2020-2028) ($MN)
- Table 118 South America Energy Bar Market Outlook, By Peanut Butter (2020-2028) ($MN)
- Table 119 South America Energy Bar Market Outlook, By Caramel (2020-2028) ($MN)
- Table 120 South America Energy Bar Market Outlook, By Honey (2020-2028) ($MN)
- Table 121 South America Energy Bar Market Outlook, By Chocolate (2020-2028) ($MN)
- Table 122 South America Energy Bar Market Outlook, By Other Flavors (2020-2028) ($MN)
- Table 123 South America Energy Bar Market Outlook, By Nature (2020-2028) ($MN)
- Table 124 South America Energy Bar Market Outlook, By Conventional (2020-2028) ($MN)
- Table 125 South America Energy Bar Market Outlook, By Organic (2020-2028) ($MN)
- Table 126 Middle East & Africa Energy Bar Market Outlook, By Country (2020-2028) ($MN)
- Table 127 Middle East & Africa Energy Bar Market Outlook, By Type (2020-2028) ($MN)
- Table 128 Middle East & Africa Energy Bar Market Outlook, By Cereal Bar (2020-2028) ($MN)
- Table 129 Middle East & Africa Energy Bar Market Outlook, By Protein Bar (2020-2028) ($MN)
- Table 130 Middle East & Africa Energy Bar Market Outlook, By Fiber Bar (2020-2028) ($MN)
- Table 131 Middle East & Africa Energy Bar Market Outlook, By Nutrition Bar (2020-2028) ($MN)
- Table 132 Middle East & Africa Energy Bar Market Outlook, By Endurance Bars (2020-2028) ($MN)
- Table 133 Middle East & Africa Energy Bar Market Outlook, By Activity Bars (2020-2028) ($MN)
- Table 134 Middle East & Africa Energy Bar Market Outlook, By Oat Bars (2020-2028) ($MN)
- Table 135 Middle East & Africa Energy Bar Market Outlook, By Other Types (2020-2028) ($MN)
- Table 136 Middle East & Africa Energy Bar Market Outlook, By Distribution Channel (2020-2028) ($MN)
- Table 137 Middle East & Africa Energy Bar Market Outlook, By Specialty Stores (2020-2028) ($MN)
- Table 138 Middle East & Africa Energy Bar Market Outlook, By Hypermarkets & Supermarkets (2020-2028) ($MN)
- Table 139 Middle East & Africa Energy Bar Market Outlook, By Online Sales Channel (2020-2028) ($MN)
- Table 140 Middle East & Africa Energy Bar Market Outlook, By Convenience Stores (2020-2028) ($MN)
- Table 141 Middle East & Africa Energy Bar Market Outlook, By Other Distribution Channels (2020-2028) ($MN)
- Table 142 Middle East & Africa Energy Bar Market Outlook, By Flavor (2020-2028) ($MN)
- Table 143 Middle East & Africa Energy Bar Market Outlook, By Peanut Butter (2020-2028) ($MN)
- Table 144 Middle East & Africa Energy Bar Market Outlook, By Caramel (2020-2028) ($MN)
- Table 145 Middle East & Africa Energy Bar Market Outlook, By Honey (2020-2028) ($MN)
- Table 146 Middle East & Africa Energy Bar Market Outlook, By Chocolate (2020-2028) ($MN)
- Table 147 Middle East & Africa Energy Bar Market Outlook, By Other Flavors (2020-2028) ($MN)
- Table 148 Middle East & Africa Energy Bar Market Outlook, By Nature (2020-2028) ($MN)
- Table 149 Middle East & Africa Energy Bar Market Outlook, By Conventional (2020-2028) ($MN)
- Table 150 Middle East & Africa Energy Bar Market Outlook, By Organic (2020-2028) ($MN)
According to Stratistics MRC, the Global Energy Bar Market is accounted for $682.26 million in 2022 and is expected to reach $1069.49 million by 2028 growing at a CAGR of 7.78% during the forecast period. Supplemental bars known as energy bars offer energy as well as nutritional advantages and dietary benefits. They often serve as a meal replacement because of the proteins, lipids, and carbohydrates they contain, which help to give users rapid energy. The bar might give someone the energy they need to get through a workout or training session thanks to the protein and additional carbohydrates. Additionally, it gives the body the post-workout nutrition it needs to repair any minor muscle tears that may have occurred during the workout and to grow new muscle tissue.
According to the International Food Information Council report on food & health survey, the proportion of American consumers who actively looked for health benefits in their food in 2021 was 20%.
Market Dynamics:
Driver:
Rising popularity for packed food items
Demand for energy bars has increased as consumers' tastes for packaged snacks and sweets have grown. The consumption of energy bars has grown in popularity as customers' spending power has improved and their taste for delicious food has increased. Additionally, the market for energy bars is growing as a result of ingredient variations in snack products that draw consumers' attention and encourage them to buy the products based on their needs.
Restraint:
Preconceptions for snack bars are rapidly changing
The cost of research, production, and distribution infrastructure for the key players rises as a result of frequently changing consumer preferences and tastes for snack food products, which restricts the growth of the energy bar market share. Additionally, it is anticipated that the proliferation of alternatives such as energy drinks, cookies, and powder will restrain the market for energy bars.
Opportunity:
Increased demand for dietary food products
The rising demand for diet foods is the cause of the increased consumption of low-carb and low-fat energy bars. The development of gluten-free and non-allergic nutrition foods has also become more practical as more people are becoming aware of the benefits of natural, chemical-free foods on their health. Additionally, as the prevalence of diabetes rises, more people are consuming low-sugar foods, opening up new market opportunities.
Threat:
High cost of energy bar
The price of the energy bars is higher since they are made with premium components that provide quick energy, like pecans, cashews, and almonds, making them expensive for many individuals. Additionally, premium packaging for energy bars includes wrapping and boxes, raising the overall cost of the energy bars. These are a few of the elements that experts predict will reduce the market value of energy bars.
COVID-19 Impact:
Numerous industries suffered significantly as a result of the novel coronavirus pandemic. During this time, the world energy market expanded moderately. The pandemic outbreak had three main effects on the market for energy bars: demand, manufacturing, supply chain, and market disruption. However, due to growing trends of simple provision for nutrition and energy requirements, speedy applications, and convenience of storing, COVID-19 has inflated the demand for creative snacks. As a result, the value of excellent health has increased dramatically, moderately fueling market expansion.
The protein bar segment is expected to be the largest during the forecast period
The protein bar segment is estimated to have a lucrative growth. High-protein, high-carbohydrate snacks include protein bars, which are portable. It is a great source of protein and other vitamins and minerals. Demand for packaged and convenience foods is rising quickly due to increased health awareness, changing socioeconomic circumstances, and a lack of time to prepare nutritious food.
The organic segment is expected to have the highest CAGR during the forecast period
The organic segment is anticipated to witness the highest CAGR growth during the forecast period. Organic energy bars are high-nutrient, nutrient-dense snacks that provide a range of vitamins and minerals to boost physical energy. Ingredients for organic energy bars come from farms that don't use synthetic pesticides or fertilisers. It is projected that the expansion of the organic category will be driven by the increased demand for healthy, organic, high-nutritional-value snacks and the rising need for sports nutrition.
Region with highest share:
North America is projected to hold the largest market share during the forecast period owing to the American way of life is known for being active and fast-paced. Due to its fast-paced lifestyle, the United States, one of the most developed countries, expects extremely easy cuisine. The United States Department of Agriculture (USDA) claims that Americans spend more than half of their food expenditure on quick meals, such as snack bars, which increases the nation's consumption of these goods.
Region with highest CAGR:
Europe is projected to have the highest CAGR over the forecast period. The market was stimulated by greater customer knowledge of a healthier ingredient with nutritional advantages. Customers like functional fruits and grains in energy bars that increase the product's nutritional value, such as berries, hemp, chia, and flaxseed, among others. The market has been driven more by impulse buys than by good eating. However, foods those are high in fibre, low in calories, high in protein, and made with natural ingredients are becoming more and more popular.
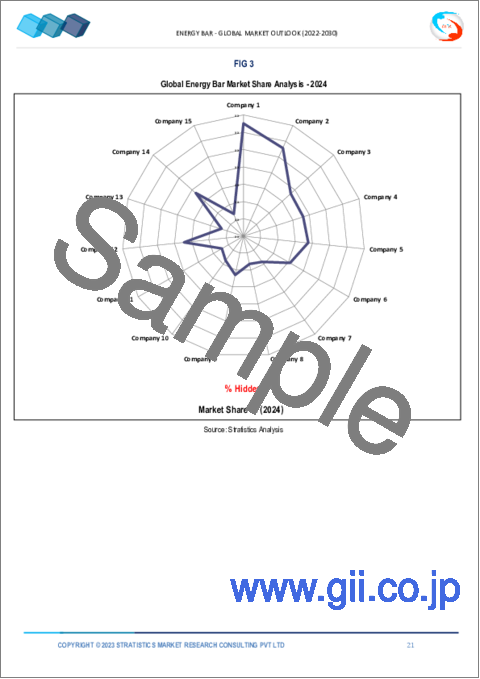
Key players in the market:
Some of the key players profiled in the Energy Bar Market include Kellogg Company, ProBar LLC, Nature Essential Foods Pvt. Ltd, EAT Anytime, PepsiCo Inc., Lotus Bakeries, General Mills Inc., Kind LLC, Post Holdings Inc., Clif Bar & Company, OTE Sports Ltd, Bumble Bar Inc., Science in Sports PLC, TORQ Limited, Premier Nutrition Inc and Brighter Foods Ltd.
Key Developments:
In August 2022, Clif Bar & Company, which offers a range of energy bars, was acquired by Mondelez International, Inc. With leading brands like CLIF, CLIF Kid, and LUNA complementing the company's refrigerated snacking business in the United States and popular performance nutrition business Grenade in the United Kingdom, the acquisition is anticipated to increase Mondelez International's global snack bar business to more than USD 1 billion.
In August 2021, General Mills, Inc launched Performance Protein bars from Cinnamon Toast Crunch and Golden Grahams brands. These bars contain less sugar and provide up to 20 g of protein in around 63 g of bar weight.
In April 2021, Kellogg India targeted the 'In-between meal' segment. Therefore owing to this factor, they launched the K Energy bars to enter this category.
Types Covered:
- Cereal Bar
- Protein Bar
- Fiber Bar
- Nutrition Bar
- Endurance Bars
- Activity Bars
- Oat Bars
- Other Types
Distribution Channels Covered:
- Specialty Stores
- Hypermarkets & Supermarkets
- Online Sales Channel
- Convenience Stores
- Other Distribution Channels
Flavors Covered:
- Peanut Butter
- Caramel
- Honey
- Chocolate
- Other Flavors
Natures Covered:
- Conventional
- Organic
Regions Covered:
- North America
- US
- Canada
- Mexico
- Europe
- Germany
- UK
- Italy
- France
- Spain
- Rest of Europe
- Asia Pacific
- Japan
- China
- India
- Australia
- New Zealand
- South Korea
- Rest of Asia Pacific
- South America
- Argentina
- Brazil
- Chile
- Rest of South America
- Middle East & Africa
- Saudi Arabia
- UAE
- Qatar
- South Africa
- Rest of Middle East & Africa
What our report offers:
- Market share assessments for the regional and country-level segments
- Strategic recommendations for the new entrants
- Covers Market data for the years 2020, 2021, 2022, 2025, and 2028
- Market Trends (Drivers, Constraints, Opportunities, Threats, Challenges, Investment Opportunities, and recommendations)
- Strategic recommendations in key business segments based on the market estimations
- Competitive landscaping mapping the key common trends
- Company profiling with detailed strategies, financials, and recent developments
- Supply chain trends mapping the latest technological advancements
Free Customization Offerings:
All the customers of this report will be entitled to receive one of the following free customization options:
- Company Profiling
- Comprehensive profiling of additional market players (up to 3)
- SWOT Analysis of key players (up to 3)
- Regional Segmentation
- Market estimations, Forecasts and CAGR of any prominent country as per the client's interest (Note: Depends on feasibility check)
- Competitive Benchmarking
- Benchmarking of key players based on product portfolio, geographical presence, and strategic alliances
Table of Contents
1 Executive Summary
2 Preface
- 2.1 Abstract
- 2.2 Stake Holders
- 2.3 Research Scope
- 2.4 Research Methodology
- 2.4.1 Data Mining
- 2.4.2 Data Analysis
- 2.4.3 Data Validation
- 2.4.4 Research Approach
- 2.5 Research Sources
- 2.5.1 Primary Research Sources
- 2.5.2 Secondary Research Sources
- 2.5.3 Assumptions
3 Market Trend Analysis
- 3.1 Introduction
- 3.2 Drivers
- 3.3 Restraints
- 3.4 Opportunities
- 3.5 Threats
- 3.6 Emerging Markets
- 3.7 Impact of Covid-19
4 Porters Five Force Analysis
- 4.1 Bargaining power of suppliers
- 4.2 Bargaining power of buyers
- 4.3 Threat of substitutes
- 4.4 Threat of new entrants
- 4.5 Competitive rivalry
5 Global Energy Bar Market, By Type
- 5.1 Introduction
- 5.2 Cereal Bar
- 5.3 Protein Bar
- 5.4 Fiber Bar
- 5.5 Nutrition Bar
- 5.6 Endurance Bars
- 5.7 Activity Bars
- 5.8 Oat Bars
- 5.9 Other Types
6 Global Energy Bar Market, By Distribution Channel
- 6.1 Introduction
- 6.2 Specialty Stores
- 6.3 Hypermarkets & Supermarkets
- 6.4 Online Sales Channel
- 6.5 Convenience Stores
- 6.6 Other Distribution Channels
7 Global Energy Bar Market, By Flavor
- 7.1 Introduction
- 7.2 Peanut Butter
- 7.3 Caramel
- 7.4 Honey
- 7.5 Chocolate
- 7.6 Other Flavors
8 Global Energy Bar Market, By Nature
- 8.1 Introduction
- 8.2 Conventional
- 8.3 Organic
9 Global Energy Bar Market, By Geography
- 9.1 Introduction
- 9.2 North America
- 9.2.1 US
- 9.2.2 Canada
- 9.2.3 Mexico
- 9.3 Europe
- 9.3.1 Germany
- 9.3.2 UK
- 9.3.3 Italy
- 9.3.4 France
- 9.3.5 Spain
- 9.3.6 Rest of Europe
- 9.4 Asia Pacific
- 9.4.1 Japan
- 9.4.2 China
- 9.4.3 India
- 9.4.4 Australia
- 9.4.5 New Zealand
- 9.4.6 South Korea
- 9.4.7 Rest of Asia Pacific
- 9.5 South America
- 9.5.1 Argentina
- 9.5.2 Brazil
- 9.5.3 Chile
- 9.5.4 Rest of South America
- 9.6 Middle East & Africa
- 9.6.1 Saudi Arabia
- 9.6.2 UAE
- 9.6.3 Qatar
- 9.6.4 South Africa
- 9.6.5 Rest of Middle East & Africa
10 Key Developments
- 10.1 Agreements, Partnerships, Collaborations and Joint Ventures
- 10.2 Acquisitions & Mergers
- 10.3 New Product Launch
- 10.4 Expansions
- 10.5 Other Key Strategies
11 Company Profiling
- 11.1 Kellogg Company
- 11.2 ProBar LLC
- 11.3 Nature Essential Foods Pvt. Ltd
- 11.4 EAT Anytime
- 11.5 PepsiCo Inc.
- 11.6 Lotus Bakeries
- 11.7 General Mills Inc.
- 11.8 Kind LLC
- 11.9 Post Holdings Inc.
- 11.10 Clif Bar & Company
- 11.11 OTE Sports Ltd
- 11.12 Bumble Bar Inc.
- 11.13 Science in Sports PLC
- 11.14 TORQ Limited
- 11.15 Premier Nutrition Inc.
- 11.16 Brighter Foods Ltd.