|
|
市場調査レポート
商品コード
1437350
バイオベースSAF(持続可能な航空燃料)の世界市場 - 市場シェアとランキング、全体の売上、需要予測(2024年~2030年)Bio-based Sustainable Aviation Fuel (SAF) - Global Market Share and Ranking, Overall Sales and Demand Forecast 2024-2030 |
||||||
|
|||||||
カスタマイズ可能
適宜更新あり
|
|||||||

| バイオベースSAF(持続可能な航空燃料)の世界市場 - 市場シェアとランキング、全体の売上、需要予測(2024年~2030年) |
|
出版日: 2024年02月28日
発行: QYResearch
ページ情報: 英文 145 Pages
納期: 2~3営業日
|

全表示
- 概要
- 図表
- 目次
世界のバイオベースSAF(持続可能な航空燃料)の市場規模は、2023年に12億6,200万米ドル、2030年までに138億4,120万米ドルに達し、2024年~2030年の予測期間にCAGRで25.69%の成長が見込まれています。
北米市場は、2023年に3億8,020万米ドル、2030年までに30億70万米ドルに達する見込みで、予測期間のCAGRは23.47%です。
アジア太平洋市場は、2023年に9,000万米ドル、2030年までに7億2,280万米ドルに達する見込みで、予測期間のCAGRは24.82%です。
欧州市場は、2023年に7億4,560万米ドル、2030年までに97億9,990万米ドルに達する見込みで、予測期間のCAGRは26.57%です。
世界のバイオベースSAF(持続可能な航空燃料)の主要企業は、Neste、World Energy、TotalEnergies、Honeywell、SkyNRG、LanzaJet、Swedish Biofuels AB、Eni、Virentなどです。2023年、世界の主要5社が収益で約67.30%のシェアを占めました。
当レポートでは、世界のバイオベースSAF(持続可能な航空燃料)市場について調査分析し、各地域の市場規模と予測、価格、主要企業の市場シェアなどの情報を提供しています。
目次
第1章 市場の概要
- バイオベースSAF(持続可能な航空燃料)製品のイントロダクション
- 世界のバイオベースSAF(持続可能な航空燃料)の市場規模の予測
- 世界のバイオベースSAF(持続可能な航空燃料)の売上金額(2019年~2030年)
- 世界のバイオベースSAF(持続可能な航空燃料)の売上数量(2019年~2030年)
- 世界のバイオベースSAF(持続可能な航空燃料)の販売価格(2019年~2030年)
- バイオベースSAF(持続可能な航空燃料)市場の動向と促進要因
- バイオベースSAF(持続可能な航空燃料)産業の動向
- バイオベースSAF(持続可能な航空燃料)市場の促進要因と機会
- バイオベースSAF(持続可能な航空燃料)市場の課題
- バイオベースSAF(持続可能な航空燃料)市場の抑制要因
- 前提条件と制限
- 調査目的
- 調査年
第2章 競合分析:企業別
- 世界のバイオベースSAF(持続可能な航空燃料)企業の収益ランキング(2023年)
- 世界のバイオベースSAF(持続可能な航空燃料)の収益:企業別(2020年~2023年)
- 世界のバイオベースSAF(持続可能な航空燃料)企業の売上数量ランキング(2023年)
- 世界の企業バイオベースSAF(持続可能な航空燃料)の売上数量:企業別(2020年~2023年)
- 世界のバイオベースSAF(持続可能な航空燃料)平均価格:企業別(2020年~2023年)
- 主要メーカーのバイオベースSAF(持続可能な航空燃料)製造拠点、本社
- 主要メーカーが提供するバイオベースSAF(持続可能な航空燃料)製品
- 主要メーカーのバイオベースSAF(持続可能な航空燃料)の量産開始時期
- バイオベースSAF(持続可能な航空燃料)市場の競合分析
- バイオベースSAF(持続可能な航空燃料)の市場集中度(2020年~2023年)
- 世界のバイオベースSAF(持続可能な航空燃料)の収益の5大メーカー(2023年)
- 世界の主要メーカー:企業タイプ別(Tier 1・Tier 2・Tier 3)(2023年のバイオベースSAF(持続可能な航空燃料)の収益に基づく)
- 合併と買収、拡大
第3章 セグメント:タイプ別
- イントロダクション:タイプ別
- HEFA
- G+FT
- AtJ
- その他
- 世界のバイオベースSAF(持続可能な航空燃料)の売上金額:タイプ別
- 世界のバイオベースSAF(持続可能な航空燃料)の売上金額:タイプ別(2019年・2023年・2030年)
- 世界のバイオベースSAF(持続可能な航空燃料)の売上金額:タイプ別(2019年~2030年)
- 世界のバイオベースSAF(持続可能な航空燃料)の売上金額:タイプ別(2019年~2030年)
- 世界のバイオベースSAF(持続可能な航空燃料)の売上数量:タイプ別
- 世界のバイオベースSAF(持続可能な航空燃料)の売上数量:タイプ別(2019年・2023年・2030年)
- 世界のバイオベースSAF(持続可能な航空燃料)の売上数量:タイプ別(2019年~2030年)
- 世界のバイオベースSAF(持続可能な航空燃料)の売上数量:タイプ別(2019年~2030年)
- 世界のバイオベースSAF(持続可能な航空燃料)の平均価格:タイプ別(2019年~2030年)
第4章 セグメント:用途別
- イントロダクション:用途別
- 民間航空機
- 軍用航空機
- その他
- 世界のバイオベースSAF(持続可能な航空燃料)の売上金額:用途別
- 世界のバイオベースSAF(持続可能な航空燃料)の売上金額:用途別(2019年・2023年・2030年)
- 世界のバイオベースSAF(持続可能な航空燃料)の売上金額:用途別(2019年~2030年)
- 世界のバイオベースSAF(持続可能な航空燃料)の売上金額:用途別(2019年~2030年)
- 世界のバイオベースSAF(持続可能な航空燃料)の売上数量:用途別
- 世界のバイオベースSAF(持続可能な航空燃料)の売上数量:用途別(2023年・2030年)
- 世界のバイオベースSAF(持続可能な航空燃料)の売上数量:用途別(2019年~2030年)
- 世界のバイオベースSAF(持続可能な航空燃料)の売上数量:用途別(2019年~2030年)
- 世界のバイオベースSAF(持続可能な航空燃料)の平均価格:用途別(2019年~2030年)
第5章 セグメント:地域別
- 世界のバイオベースSAF(持続可能な航空燃料)の売上金額:地域別
- 世界のバイオベースSAF(持続可能な航空燃料)の売上金額:地域別(2019年・2023年・2030年)
- 世界のバイオベースSAF(持続可能な航空燃料)の売上金額:地域別(2019年~2024年)
- 世界のバイオベースSAF(持続可能な航空燃料)の売上金額:地域別(2025年~2030年)
- 世界のバイオベースSAF(持続可能な航空燃料)の売上金額:地域別(2019年~2030年)
- 世界のバイオベースSAF(持続可能な航空燃料)の売上数量:地域別
- 世界のバイオベースSAF(持続可能な航空燃料)の売上数量:地域別(2019年・2023年・2030年)
- 世界のバイオベースSAF(持続可能な航空燃料)の売上数量:地域別(2019年~2024年)
- 世界のバイオベースSAF(持続可能な航空燃料)の売上数量:地域別(2025年~2030年)
- 世界のバイオベースSAF(持続可能な航空燃料)の売上数量:地域別(2019年~2030年)
- 世界のバイオベースSAF(持続可能な航空燃料)の平均価格:地域別(2019年~2030年)
- 北米
- 北米のバイオベースSAF(持続可能な航空燃料)の売上金額(2019年~2030年)
- 北米のバイオベースSAF(持続可能な航空燃料)の売上金額:国別(2019年~2024年)
- 欧州
- 欧州のバイオベースSAF(持続可能な航空燃料)の売上金額(2019年~2030年)
- 欧州のバイオベースSAF(持続可能な航空燃料)の売上金額:国別(2019年~2024年)
- アジア太平洋
- アジア太平洋のバイオベースSAF(持続可能な航空燃料)の売上金額(2019年~2030年)
- アジア太平洋のバイオベースSAF(持続可能な航空燃料)の売上金額:地域別(2019年~2024年)
- 南米
- 南米のバイオベースSAF(持続可能な航空燃料)の売上金額(2019年~2030年)
- 南米のバイオベースSAF(持続可能な航空燃料)の売上金額:国別(2019年~2024年)
- 中東・アフリカ
第6章 セグメント:主要国/地域別
- 主要国/地域のバイオベースSAF(持続可能な航空燃料)の売上金額の成長動向(2019年・2023年・2030年)
- 主要国/地域のバイオベースSAF(持続可能な航空燃料)の売上金額
- 主要国/地域のバイオベースSAF(持続可能な航空燃料)の売上金額(2019年~2030年)
- 主要国/地域のバイオベースSAF(持続可能な航空燃料)の売上数量(2019年~2030年)
- 米国
- 米国のバイオベースSAF(持続可能な航空燃料)の売上金額(2019年~2030年)
- 米国のバイオベースSAF(持続可能な航空燃料)の売上金額:タイプ別(2019年~2024年)
- 米国のバイオベースSAF(持続可能な航空燃料)の売上金額:用途別(2019年~2024年)
- 欧州
- 欧州のバイオベースSAF(持続可能な航空燃料)の売上金額(2019年~2030年)
- 欧州のバイオベースSAF(持続可能な航空燃料)の売上金額:タイプ別(2019年~2024年)
- 欧州のバイオベースSAF(持続可能な航空燃料)の売上金額:用途別(2019年~2024年)
- 中国
- 中国のバイオベースSAF(持続可能な航空燃料)の売上金額(2019年~2030年)
- 中国のバイオベースSAF(持続可能な航空燃料)の売上金額:タイプ別(2019年~2024年)
- 中国のバイオベースSAF(持続可能な航空燃料)の売上金額:用途別(2019年~2024年)
- 日本
- 日本のバイオベースSAF(持続可能な航空燃料)の売上金額(2019年~2030年)
- 日本のバイオベースSAF(持続可能な航空燃料)の売上金額:タイプ別(2019年~2024年)
- 日本のバイオベースSAF(持続可能な航空燃料)の売上金額:用途別(2019年~2024年)
- インド
- インドのバイオベースSAF(持続可能な航空燃料)の売上金額(2019年~2030年)
- インドのバイオベースSAF(持続可能な航空燃料)の売上金額:タイプ別(2019年~2024年)
- インドのバイオベースSAF(持続可能な航空燃料)の売上金額:用途別(2019年~2024年)
- 韓国
- 韓国のバイオベースSAF(持続可能な航空燃料)の売上金額(2019年~2030年)
- 韓国のバイオベースSAF(持続可能な航空燃料)の売上金額:タイプ別(2019年~2024年)
- 韓国のバイオベースSAF(持続可能な航空燃料)の売上金額:用途別(2019年~2024年)
第7章 企業プロファイル
- Neste
- World Energy
- TotalEnergies
- Honeywell
- SkyNRG
- LanzaJet
- Swedish Biofuels AB
- Eni
- Virent
第8章 産業チェーン分析
- バイオベースSAF(持続可能な航空燃料)の産業チェーン
- バイオベースSAF(持続可能な航空燃料)の上流分析
- 主な原材料
- 原材料の主要サプライヤー
- 製造コスト構造
- 下流分析(顧客分析)
- 販売モデル、販売チャネル
- バイオベースSAF(持続可能な航空燃料)の販売モデル
- バイオベースSAF(持続可能な航空燃料)の販売業者
第9章 調査結果と結論
第10章 付録
List of Tables
- Table 1. Bio-based Sustainable Aviation Fuel (SAF) Market Trends
- Table 2. Bio-based Sustainable Aviation Fuel (SAF) Market Drivers & Opportunity
- Table 3. Bio-based Sustainable Aviation Fuel (SAF) Market Challenges
- Table 4. Bio-based Sustainable Aviation Fuel (SAF) Market Restraints
- Table 5. Global Bio-based Sustainable Aviation Fuel (SAF) Revenue by Company (2020-2023) & (US$ Million)
- Table 6. Global Bio-based Sustainable Aviation Fuel (SAF) Revenue Market Share by Company (2020-2023)
- Table 7. Global Bio-based Sustainable Aviation Fuel (SAF) Sales Volume by Company (2020-2023) & (K MT)
- Table 8. Global Bio-based Sustainable Aviation Fuel (SAF) Sales Volume Market Share by Company (2020-2023)
- Table 9. Global Market Bio-based Sustainable Aviation Fuel (SAF) Price by Company (2020-2023) & (US$/MT)
- Table 10. Key Manufacturers Bio-based Sustainable Aviation Fuel (SAF) Manufacturing Base and Headquarters
- Table 11. Key Manufacturers Bio-based Sustainable Aviation Fuel (SAF) Product Type
- Table 12. Key Manufacturers Time to Begin Mass Production of Bio-based Sustainable Aviation Fuel (SAF)
- Table 13. Global Bio-based Sustainable Aviation Fuel (SAF) Manufacturers Market Concentration Ratio (CR5)
- Table 14. Global Top Manufacturers Market Share by Company Type (Tier 1, Tier 2, and Tier 3) & (based on the Revenue in Bio-based Sustainable Aviation Fuel (SAF) as of 2023)
- Table 15. Mergers & Acquisitions, Expansion Plans
- Table 16. Global Bio-based Sustainable Aviation Fuel (SAF) Sales Value by Type: 2019 VS 2023 VS 2030 (US$ Million)
- Table 17. Global Bio-based Sustainable Aviation Fuel (SAF) Sales Value by Type (2019-2024) & (US$ Million)
- Table 18. Global Bio-based Sustainable Aviation Fuel (SAF) Sales Value by Type (2025-2030) & (US$ Million)
- Table 19. Global Bio-based Sustainable Aviation Fuel (SAF) Sales Market Share in Value by Type (2019-2024)
- Table 20. Global Bio-based Sustainable Aviation Fuel (SAF) Sales Market Share in Value by Type (2025-2030)
- Table 21. Global Bio-based Sustainable Aviation Fuel (SAF) Sales Volume by Type: 2019 VS 2023 VS 2030 (K MT)
- Table 22. Global Bio-based Sustainable Aviation Fuel (SAF) Sales Volume by Type (2019-2024) & (K MT)
- Table 23. Global Bio-based Sustainable Aviation Fuel (SAF) Sales Volume by Type (2025-2030) & (K MT)
- Table 24. Global Bio-based Sustainable Aviation Fuel (SAF) Sales Market Share in Value by Type (2019-2024)
- Table 25. Global Bio-based Sustainable Aviation Fuel (SAF) Sales Market Share in Value by Type (2025-2030)
- Table 26. Global Bio-based Sustainable Aviation Fuel (SAF) Price by Type (2019-2024) & (US$/MT)
- Table 27. Global Bio-based Sustainable Aviation Fuel (SAF) Price by Type (2025-2030) & (US$/MT)
- Table 28. Global Bio-based Sustainable Aviation Fuel (SAF) Sales Value by Application: 2019 VS 2023 VS 2030 (US$ Million)
- Table 29. Global Bio-based Sustainable Aviation Fuel (SAF) Sales Value by Application (2019-2024) & (US$ Million)
- Table 30. Global Bio-based Sustainable Aviation Fuel (SAF) Sales Value by Application (2025-2030) & (US$ Million)
- Table 31. Global Bio-based Sustainable Aviation Fuel (SAF) Sales Market Share in Value by Application (2019-2024)
- Table 32. Global Bio-based Sustainable Aviation Fuel (SAF) Sales Market Share in Value by Application (2025-2030)
- Table 33. Global Bio-based Sustainable Aviation Fuel (SAF) Sales Volume by Application: 2019 VS 2023 VS 2030 (K MT)
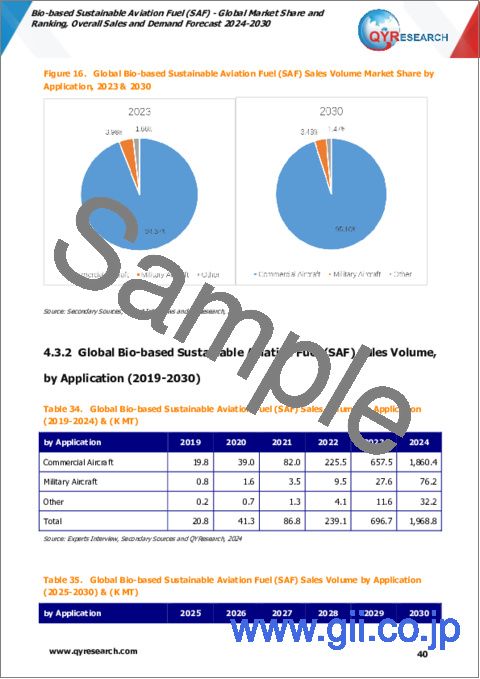
- Table 34. Global Bio-based Sustainable Aviation Fuel (SAF) Sales Volume by Application (2019-2024) & (K MT)
- Table 35. Global Bio-based Sustainable Aviation Fuel (SAF) Sales Volume by Application (2025-2030) & (K MT)
- Table 36. Global Bio-based Sustainable Aviation Fuel (SAF) Sales Market Share in Value by Application (2019-2024)
- Table 37. Global Bio-based Sustainable Aviation Fuel (SAF) Sales Market Share in Value by Application (2025-2030)
- Table 38. Global Bio-based Sustainable Aviation Fuel (SAF) Price by Application (2019-2024) & (US$/MT)
- Table 39. Global Bio-based Sustainable Aviation Fuel (SAF) Price by Application (2025-2030) & (US$/MT)
- Table 40. Global Bio-based Sustainable Aviation Fuel (SAF) Sales Value by Region, (2019 VS 2023 VS 2030) & (US$ Million)
- Table 41. Global Bio-based Sustainable Aviation Fuel (SAF) Sales Value by Region (2019-2024) & (US$ Million)
- Table 42. Global Bio-based Sustainable Aviation Fuel (SAF) Sales Value by Region (2025-2030) & (US$ Million)
- Table 43. Global Bio-based Sustainable Aviation Fuel (SAF) Sales Value by Region (2019-2024) & (%)
- Table 44. Global Bio-based Sustainable Aviation Fuel (SAF) Sales Value by Region (2025-2030) & (%)
- Table 45. Global Bio-based Sustainable Aviation Fuel (SAF) Sales Volume by Region (K MT): 2019 VS 2023 VS 2030
- Table 46. Global Bio-based Sustainable Aviation Fuel (SAF) Sales Volume by Region (2019-2024) & (K MT)
- Table 47. Global Bio-based Sustainable Aviation Fuel (SAF) Sales Volume by Region (2025-2030) & (K MT)
- Table 48. Global Bio-based Sustainable Aviation Fuel (SAF) Sales Volume by Region (2019-2024) & (%)
- Table 49. Global Bio-based Sustainable Aviation Fuel (SAF) Sales Volume by Region (2025-2030) & (%)
- Table 50. Global Bio-based Sustainable Aviation Fuel (SAF) Average Price by Region (2019-2024) & (US$/MT)
- Table 51. Global Bio-based Sustainable Aviation Fuel (SAF) Average Price by Region (2025-2030) & (US$/MT)
- Table 52. Key Countries/Regions Bio-based Sustainable Aviation Fuel (SAF) Sales Value Growth Trends, (US$ Million): 2019 VS 2023 VS 2030
- Table 53. Key Countries/Regions Bio-based Sustainable Aviation Fuel (SAF) Sales Value, (2019-2024) & (US$ Million)
- Table 54. Key Countries/Regions Bio-based Sustainable Aviation Fuel (SAF) Sales Value, (2025-2030) & (US$ Million)
- Table 55. Key Countries/Regions Bio-based Sustainable Aviation Fuel (SAF) Sales Volume, (2019-2024) & (K MT)
- Table 56. Key Countries/Regions Bio-based Sustainable Aviation Fuel (SAF) Sales Volume, (2025-2030) & (K MT)
- Table 57. Neste Company Information
- Table 58. Neste Introduction and Business Overview
- Table 59. Neste Bio-based Sustainable Aviation Fuel (SAF) Sales (K MT), Revenue (US$ Million), Price (US$/MT) and Gross Margin (2020-2023)
- Table 60. Neste Bio-based Sustainable Aviation Fuel (SAF) Product Offerings
- Table 61. Neste Recent Development
- Table 62. World Energy Company Information
- Table 63. World Energy Introduction and Business Overview
- Table 64. World Energy Bio-based Sustainable Aviation Fuel (SAF) Sales (K MT), Revenue (US$ Million), Price (US$/MT) and Gross Margin (2020-2023)
- Table 65. World Energy Bio-based Sustainable Aviation Fuel (SAF) Product Offerings
- Table 66. World Energy Recent Development
- Table 67. TotalEnergies Company Information
- Table 68. TotalEnergies Introduction and Business Overview
- Table 69. TotalEnergies Bio-based Sustainable Aviation Fuel (SAF) Sales (K MT), Revenue (US$ Million), Price (US$/MT) and Gross Margin (2020-2023)
- Table 70. TotalEnergies Bio-based Sustainable Aviation Fuel (SAF) Product Offerings
- Table 71. TotalEnergies Recent Development
- Table 72. Honeywell Company Information
- Table 73. Honeywell Introduction and Business Overview
- Table 74. Honeywell Bio-based Sustainable Aviation Fuel (SAF) Sales (K MT), Revenue (US$ Million), Price (US$/MT) and Gross Margin (2020-2023)
- Table 75. Honeywell Bio-based Sustainable Aviation Fuel (SAF) Product Offerings
- Table 76. Honeywell Recent Development
- Table 77. SkyNRG Company Information
- Table 78. SkyNRG Introduction and Business Overview
- Table 79. SkyNRG Bio-based Sustainable Aviation Fuel (SAF) Sales (K MT), Revenue (US$ Million), Price (US$/MT) and Gross Margin (2020-2023)
- Table 80. SkyNRG Bio-based Sustainable Aviation Fuel (SAF) Product Offerings
- Table 81. SkyNRG Recent Development
- Table 82. LanzaJet Company Information
- Table 83. LanzaJet Introduction and Business Overview
- Table 84. LanzaJet Bio-based Sustainable Aviation Fuel (SAF) Sales (K MT), Revenue (US$ Million), Price (US$/MT) and Gross Margin (2020-2023)
- Table 85. LanzaJet Bio-based Sustainable Aviation Fuel (SAF) Product Offerings
- Table 86. LanzaJet Recent Development
- Table 87. Swedish Biofuels AB Company Information
- Table 88. Swedish Biofuels AB Introduction and Business Overview
- Table 89. Swedish Biofuels AB Bio-based Sustainable Aviation Fuel (SAF) Sales (K MT), Revenue (US$ Million), Price (US$/MT) and Gross Margin (2020-2023)
- Table 90. Swedish Biofuels AB Bio-based Sustainable Aviation Fuel (SAF) Product Offerings
- Table 91. Swedish Biofuels AB Recent Development
- Table 92. Eni Company Information
- Table 93. Eni Introduction and Business Overview
- Table 94. Eni Bio-based Sustainable Aviation Fuel (SAF) Sales (K MT), Revenue (US$ Million), Price (US$/MT) and Gross Margin (2020-2023)
- Table 95. Eni Bio-based Sustainable Aviation Fuel (SAF) Product Offerings
- Table 96. Eni Recent Development
- Table 97. Virent Company Information
- Table 98. Virent Introduction and Business Overview
- Table 99. Virent Bio-based Sustainable Aviation Fuel (SAF) Sales (K MT), Revenue (US$ Million), Price (US$/MT) and Gross Margin (2020-2023)
- Table 100. Virent Bio-based Sustainable Aviation Fuel (SAF) Product Offerings
- Table 101. Virent Recent Development
- Table 102. Bio-based Sustainable Aviation Fuel (SAF) Industrial Chain Analysis
- Table 103. Key Raw Materials Lists
- Table 104. Raw Materials Key Suppliers Lists
- Table 105. Bio-based Sustainable Aviation Fuel (SAF) Downstream Customers
- Table 106. Bio-based Sustainable Aviation Fuel (SAF) Distributors List
- Table 107. Research Programs/Design for This Report
- Table 108. Key Data Information from Secondary Sources
- Table 109. Key Data Information from Primary Sources
List of Figures
- Figure 1. Bio-based Sustainable Aviation Fuel (SAF) Product Picture
- Figure 2. Global Bio-based Sustainable Aviation Fuel (SAF) Sales Value, 2019 VS 2024 VS 2030 (US$ Million)
- Figure 3. Global Bio-based Sustainable Aviation Fuel (SAF) Sales Value (2019-2030) & (US$ Million)
- Figure 4. Global Bio-based Sustainable Aviation Fuel (SAF) Sales Volume (2019-2030) & (K MT)
- Figure 5. Global Bio-based Sustainable Aviation Fuel (SAF) Sales Price (2019-2030) & (US$/MT)
- Figure 6. Bio-based Sustainable Aviation Fuel (SAF) Report Years Considered
- Figure 7. Global Bio-based Sustainable Aviation Fuel (SAF) Players Revenue Ranking (2023) & (US$ Million)
- Figure 8. Global Bio-based Sustainable Aviation Fuel (SAF) Players Sales Volume Ranking (2023) & (K MT)
- Figure 9. The 5 Largest Manufacturers in the World: Market Share by Bio-based Sustainable Aviation Fuel (SAF) Revenue in 2023
- Figure 10. Global Bio-based Sustainable Aviation Fuel (SAF) Sales Value Market Share by Type, 2023 & 2030
- Figure 11. Global Bio-based Sustainable Aviation Fuel (SAF) Sales Volume Market Share by Type, 2023 & 2030
- Figure 12. Global Bio-based Sustainable Aviation Fuel (SAF) Price by Type (2019-2030) & (US$/MT)
- Figure 13. Product Picture of Commercial Aircraft
- Figure 14. Product Picture of Military Aircraft
- Figure 15. Global Bio-based Sustainable Aviation Fuel (SAF) Sales Value Market Share by Application, 2023 & 2030
- Figure 16. Global Bio-based Sustainable Aviation Fuel (SAF) Sales Volume Market Share by Application, 2023 & 2030
- Figure 17. Global Bio-based Sustainable Aviation Fuel (SAF) Price by Application (2019-2030) & (US$/MT)
- Figure 18. North America Bio-based Sustainable Aviation Fuel (SAF) Sales Value (2019-2030) & (US$ Million)
- Figure 19. North America Bio-based Sustainable Aviation Fuel (SAF) Sales Value by Country (%), 2019-2024
- Figure 20. Europe Bio-based Sustainable Aviation Fuel (SAF) Sales Value, (2019-2030) & (US$ Million)
- Figure 21. Europe Bio-based Sustainable Aviation Fuel (SAF) Sales Value by Country (%), 2019-2024
- Figure 22. Asia Pacific Bio-based Sustainable Aviation Fuel (SAF) Sales Value, (2019-2030) & (US$ Million)
- Figure 23. Asia Pacific Bio-based Sustainable Aviation Fuel (SAF) Sales Value by Region (%), 2019-2024
- Figure 24. South America Bio-based Sustainable Aviation Fuel (SAF) Sales Value, (2019-2030) & (US$ Million)
- Figure 25. South America Bio-based Sustainable Aviation Fuel (SAF) Sales Value by Country (%), 2019-2024
- Figure 26. Middle East & Africa Bio-based Sustainable Aviation Fuel (SAF) Sales Value, (2019-2030) & (US$ Million)
- Figure 27. Middle East & Africa Bio-based Sustainable Aviation Fuel (SAF) Sales Value by Country (%), 2019-2024
- Figure 28. United States Bio-based Sustainable Aviation Fuel (SAF) Sales Value, (2019-2030) & (US$ Million)
- Figure 29. United States Bio-based Sustainable Aviation Fuel (SAF) Sales Value by Type (%), 2019-2024
- Figure 30. United States Bio-based Sustainable Aviation Fuel (SAF) Sales Value by Application (%), 2019-2024
- Figure 31. Europe Bio-based Sustainable Aviation Fuel (SAF) Sales Value, (2019-2030) & (US$ Million)
- Figure 32. Europe Bio-based Sustainable Aviation Fuel (SAF) Sales Value by Type (%), 2019-2024
- Figure 33. Europe Bio-based Sustainable Aviation Fuel (SAF) Sales Value by Application (%), 2019-2024
- Figure 34. China Bio-based Sustainable Aviation Fuel (SAF) Sales Value, (2019-2030) & (US$ Million)
- Figure 35. China Bio-based Sustainable Aviation Fuel (SAF) Sales Value by Type (%), 2019-2024
- Figure 36. China Bio-based Sustainable Aviation Fuel (SAF) Sales Value by Application (%), 2019-2024
- Figure 37. Japan Bio-based Sustainable Aviation Fuel (SAF) Sales Value, (2019-2030) & (US$ Million)
- Figure 38. Japan Bio-based Sustainable Aviation Fuel (SAF) Sales Value by Type (%), 2019-2024
- Figure 39. Japan Bio-based Sustainable Aviation Fuel (SAF) Sales Value by Application (%), 2019-2024
- Figure 40. India Bio-based Sustainable Aviation Fuel (SAF) Sales Value, (2019-2030) & (US$ Million)
- Figure 41. India Bio-based Sustainable Aviation Fuel (SAF) Sales Value by Type (%), 2019-2024
- Figure 42. India Bio-based Sustainable Aviation Fuel (SAF) Sales Value by Application (%), 2019-2024
- Figure 43. South Korea Bio-based Sustainable Aviation Fuel (SAF) Sales Value, (2019-2030) & (US$ Million)
- Figure 44. South Korea Bio-based Sustainable Aviation Fuel (SAF) Sales Value by Type (%), 2019-2024
- Figure 45. South Korea Bio-based Sustainable Aviation Fuel (SAF) Sales Value by Application (%), 2019-2024
- Figure 46. Bio-based Sustainable Aviation Fuel (SAF) Manufacturing Cost Structure
- Figure 47. Bottom-up and Top-down Approaches for This Report
- Figure 48. Data Triangulation
- Figure 49. Key Executives Interviewed
The global market for Bio-based Sustainable Aviation Fuel (SAF) was estimated to be worth US$ 1,262.0 million in 2023 and is forecast to a readjusted size of US$ 13,841.2 million by 2030 with a CAGR of 25.69% during the forecast period 2024-2030.
North American market for Bio-based Sustainable Aviation Fuel (SAF) was valued at $ 380.2 million in 2023 and will reach $ 3,000.7 million by 2030, at a CAGR of 23.47% during the forecast period of 2024 through 2030.
Asia-Pacific market for Bio-based Sustainable Aviation Fuel (SAF) was valued at $ 90.0 million in 2023 and will reach $ 722.8 million by 2030, at a CAGR of 24.82% during the forecast period of 2024 through 2030.
Europe market for Bio-based Sustainable Aviation Fuel (SAF) was valued at $ 745.6 million in 2023 and will reach $ 9,799.9 million by 2030, at a CAGR of 26.57% during the forecast period of 2024 through 2030.
The global key companies of Bio-based Sustainable Aviation Fuel (SAF) include Neste, World Energy, TotalEnergies, Honeywell, SkyNRG, LanzaJet, Swedish Biofuels AB, Eni, and Virent, etc. In 2023, the global five largest players hold a share approximately 67.30% in terms of revenue.
This report aims to provide a comprehensive presentation of the global market for Bio-based Sustainable Aviation Fuel (SAF), focusing on the total sales volume, sales revenue, price, key companies market share and ranking, together with an analysis of Bio-based Sustainable Aviation Fuel (SAF) by region & country, by Type, and by Application.
The Bio-based Sustainable Aviation Fuel (SAF) market size, estimations, and forecasts are provided in terms of sales volume (K MT) and sales revenue ($ millions), considering 2023 as the base year, with history and forecast data for the period from 2019 to 2030. With both quantitative and qualitative analysis, to help readers develop business/growth strategies, assess the market competitive situation, analyze their position in the current marketplace, and make informed business decisions regarding Bio-based Sustainable Aviation Fuel (SAF).
Market Segmentation
By Company
- Neste
- World Energy
- TotalEnergies
- Honeywell
- SkyNRG
- LanzaJet
- Swedish Biofuels AB
- Eni
- Virent
Segment by Type
- HEFA
- G+FT
- AtJ
- Other
Segment by Application
- Commercial Aircraft
- Military Aircraft
- Other
By Region
- North America
- United States
- Canada
- Mexico
- Asia-Pacific
- China
- Japan
- Korea
- India
- Southeast Asia
- Rest of Asia-Pacific
- Europe
- Germany
- UK
- France
- Russia
- Italy
Table of Contents
1 Market Overview
- 1.1 Bio-based Sustainable Aviation Fuel (SAF) Product Introduction
- 1.2 Global Bio-based Sustainable Aviation Fuel (SAF) Market Size Forecast
- 1.2.1 Global Bio-based Sustainable Aviation Fuel (SAF) Sales Value (2019-2030)
- 1.2.2 Global Bio-based Sustainable Aviation Fuel (SAF) Sales Volume (2019-2030)
- 1.2.3 Global Bio-based Sustainable Aviation Fuel (SAF) Sales Price (2019-2030)
- 1.3 Bio-based Sustainable Aviation Fuel (SAF) Market Trends & Drivers
- 1.3.1 Bio-based Sustainable Aviation Fuel (SAF) Industry Trends
- 1.3.2 Bio-based Sustainable Aviation Fuel (SAF) Market Drivers & Opportunity
- 1.3.3 Bio-based Sustainable Aviation Fuel (SAF) Market Challenges
- 1.3.4 Bio-based Sustainable Aviation Fuel (SAF) Market Restraints
- 1.4 Assumptions and Limitations
- 1.5 Study Objectives
- 1.6 Years Considered
2 Competitive Analysis by Company
- 2.1 Global Bio-based Sustainable Aviation Fuel (SAF) Players Revenue Ranking (2023)
- 2.2 Global Bio-based Sustainable Aviation Fuel (SAF) Revenue by Company (2020-2023)
- 2.3 Global Bio-based Sustainable Aviation Fuel (SAF) Players Sales Volume Ranking (2023)
- 2.4 Global Bio-based Sustainable Aviation Fuel (SAF) Sales Volume by Company Players (2020-2023)
- 2.5 Global Bio-based Sustainable Aviation Fuel (SAF) Average Price by Company (2020-2023)
- 2.6 Key Manufacturers Bio-based Sustainable Aviation Fuel (SAF) Manufacturing Base and Headquarters
- 2.7 Key Manufacturers Bio-based Sustainable Aviation Fuel (SAF) Product Offered
- 2.8 Key Manufacturers Time to Begin Mass Production of Bio-based Sustainable Aviation Fuel (SAF)
- 2.9 Bio-based Sustainable Aviation Fuel (SAF) Market Competitive Analysis
- 2.9.1 Bio-based Sustainable Aviation Fuel (SAF) Market Concentration Rate (2020-2023)
- 2.9.2 Global 5 Largest Manufacturers by Bio-based Sustainable Aviation Fuel (SAF) Revenue in 2023
- 2.9.3 Global Top Manufacturers by Company Type (Tier 1, Tier 2, and Tier 3) & (based on the Revenue in Bio-based Sustainable Aviation Fuel (SAF) as of 2023)
- 2.10 Mergers & Acquisitions, Expansion
3 Segmentation by Type
- 3.1 Introduction by Type
- 3.1.1 HEFA
- 3.1.2 G+FT
- 3.1.3 AtJ
- 3.1.4 Other
- 3.2 Global Bio-based Sustainable Aviation Fuel (SAF) Sales Value by Type
- 3.2.1 Global Bio-based Sustainable Aviation Fuel (SAF) Sales Value by Type (2019 VS 2023 VS 2030)
- 3.2.2 Global Bio-based Sustainable Aviation Fuel (SAF) Sales Value, by Type (2019-2030)
- 3.2.3 Global Bio-based Sustainable Aviation Fuel (SAF) Sales Value, by Type (%) (2019-2030)
- 3.3 Global Bio-based Sustainable Aviation Fuel (SAF) Sales Volume by Type
- 3.3.1 Global Bio-based Sustainable Aviation Fuel (SAF) Sales Volume by Type (2019 VS 2023 VS 2030)
- 3.3.2 Global Bio-based Sustainable Aviation Fuel (SAF) Sales Volume, by Type (2019-2030)
- 3.3.3 Global Bio-based Sustainable Aviation Fuel (SAF) Sales Volume, by Type (%) (2019-2030)
- 3.4 Global Bio-based Sustainable Aviation Fuel (SAF) Average Price by Type (2019-2030)
4 Segmentation by Application
- 4.1 Introduction by Application
- 4.1.1 Commercial Aircraft
- 4.1.2 Military Aircraft
- 4.1.3 Other
- 4.2 Global Bio-based Sustainable Aviation Fuel (SAF) Sales Value by Application
- 4.2.1 Global Bio-based Sustainable Aviation Fuel (SAF) Sales Value by Application (2019 VS 2023 VS 2030)
- 4.2.2 Global Bio-based Sustainable Aviation Fuel (SAF) Sales Value, by Application (2019-2030)
- 4.2.3 Global Bio-based Sustainable Aviation Fuel (SAF) Sales Value, by Application (%) (2019-2030)
- 4.3 Global Bio-based Sustainable Aviation Fuel (SAF) Sales Volume by Application
- 4.3.1 Global Bio-based Sustainable Aviation Fuel (SAF) Sales Volume by Application (2023 VS 2030)
- 4.3.2 Global Bio-based Sustainable Aviation Fuel (SAF) Sales Volume, by Application (2019-2030)
- 4.3.3 Global Bio-based Sustainable Aviation Fuel (SAF) Sales Volume, by Application (%) (2019-2030)
- 4.4 Global Bio-based Sustainable Aviation Fuel (SAF) Average Price by Application (2019-2030)
5 Segmentation by Region
- 5.1 Global Bio-based Sustainable Aviation Fuel (SAF) Sales Value by Region
- 5.1.1 Global Bio-based Sustainable Aviation Fuel (SAF) Sales Value by Region: 2019 VS 2023 VS 2030
- 5.1.2 Global Bio-based Sustainable Aviation Fuel (SAF) Sales Value by Region (2019-2024)
- 5.1.3 Global Bio-based Sustainable Aviation Fuel (SAF) Sales Value by Region (2025-2030)
- 5.1.4 Global Bio-based Sustainable Aviation Fuel (SAF) Sales Value by Region (%), (2019-2030)
- 5.2 Global Bio-based Sustainable Aviation Fuel (SAF) Sales Volume by Region
- 5.2.1 Global Bio-based Sustainable Aviation Fuel (SAF) Sales Volume by Region: 2019 VS 2023 VS 2030
- 5.2.2 Global Bio-based Sustainable Aviation Fuel (SAF) Sales Volume by Region (2019-2024)
- 5.2.3 Global Bio-based Sustainable Aviation Fuel (SAF) Sales Volume by Region (2025-2030)
- 5.2.4 Global Bio-based Sustainable Aviation Fuel (SAF) Sales Volume by Region (%), (2019-2030)
- 5.3 Global Bio-based Sustainable Aviation Fuel (SAF) Average Price by Region (2019-2030)
- 5.4 North America
- 5.4.1 North America Bio-based Sustainable Aviation Fuel (SAF) Sales Value, 2019-2030
- 5.4.2 North America Bio-based Sustainable Aviation Fuel (SAF) Sales Value by Country (%), 2019-2024
- 5.5 Europe
- 5.5.1 Europe Bio-based Sustainable Aviation Fuel (SAF) Sales Value, 2019-2030
- 5.5.2 Europe Bio-based Sustainable Aviation Fuel (SAF) Sales Value by Country (%), 2019-2024
- 5.6 Asia Pacific
- 5.6.1 Asia Pacific Bio-based Sustainable Aviation Fuel (SAF) Sales Value, 2019-2030
- 5.6.2 Asia Pacific Bio-based Sustainable Aviation Fuel (SAF) Sales Value by Region (%), 2019-2024
- 5.7 South America
- 5.7.1 South America Bio-based Sustainable Aviation Fuel (SAF) Sales Value, 2019-2030
- 5.7.2 South America Bio-based Sustainable Aviation Fuel (SAF) Sales Value by Country (%), 2019-2024
- 5.8 Middle East & Africa
- 5.8.1 Middle East & Africa Bio-based Sustainable Aviation Fuel (SAF) Sales Value, 2019-2030
- 5.8.2 Middle East & Africa Bio-based Sustainable Aviation Fuel (SAF) Sales Value by Country (%), 2019-2024
6 Segmentation by Key Countries/Regions
- 6.1 Key Countries/Regions Bio-based Sustainable Aviation Fuel (SAF) Sales Value Growth Trends, 2019 VS 2023 VS 2030
- 6.2 Key Countries/Regions Bio-based Sustainable Aviation Fuel (SAF) Sales Value
- 6.2.1 Key Countries/Regions Bio-based Sustainable Aviation Fuel (SAF) Sales Value, 2019-2030
- 6.2.2 Key Countries/Regions Bio-based Sustainable Aviation Fuel (SAF) Sales Volume, 2019-2030
- 6.3 United States
- 6.3.1 United States Bio-based Sustainable Aviation Fuel (SAF) Sales Value, 2019-2030
- 6.3.2 United States Bio-based Sustainable Aviation Fuel (SAF) Sales Value by Type (%), 2019-2024
- 6.3.3 United States Bio-based Sustainable Aviation Fuel (SAF) Sales Value by Application, 2019-2024
- 6.4 Europe
- 6.4.1 Europe Bio-based Sustainable Aviation Fuel (SAF) Sales Value, 2019-2030
- 6.4.2 Europe Bio-based Sustainable Aviation Fuel (SAF) Sales Value by Type (%), 2019-2024
- 6.4.3 Europe Bio-based Sustainable Aviation Fuel (SAF) Sales Value by Application, 2019-2024
- 6.5 China
- 6.5.1 China Bio-based Sustainable Aviation Fuel (SAF) Sales Value, 2019-2030
- 6.5.2 China Bio-based Sustainable Aviation Fuel (SAF) Sales Value by Type (%), 2019-2024
- 6.5.3 China Bio-based Sustainable Aviation Fuel (SAF) Sales Value by Application, 2019-2024
- 6.6 Japan
- 6.6.1 Japan Bio-based Sustainable Aviation Fuel (SAF) Sales Value, 2019-2030
- 6.6.2 Japan Bio-based Sustainable Aviation Fuel (SAF) Sales Value by Type (%), 2019-2024
- 6.6.3 Japan Bio-based Sustainable Aviation Fuel (SAF) Sales Value by Application, 2019-2024
- 6.7 India
- 6.7.1 India Bio-based Sustainable Aviation Fuel (SAF) Sales Value, 2019-2030
- 6.7.2 India Bio-based Sustainable Aviation Fuel (SAF) Sales Value by Type (%), 2019-2024
- 6.7.3 India Bio-based Sustainable Aviation Fuel (SAF) Sales Value by Application, 2019-2024
- 6.8 South Korea
- 6.8.1 South Korea Bio-based Sustainable Aviation Fuel (SAF) Sales Value, 2019-2030
- 6.8.2 South Korea Bio-based Sustainable Aviation Fuel (SAF) Sales Value by Type (%), 2019-2024
- 6.8.3 South Korea Bio-based Sustainable Aviation Fuel (SAF) Sales Value by Application, 2019-2024
7 Company Profiles
- 7.1 Neste
- 7.1.1 Neste Company Information
- 7.1.2 Neste Introduction and Business Overview
- 7.1.3 Neste Bio-based Sustainable Aviation Fuel (SAF) Sales, Revenue, Price and Gross Margin (2020-2023)
- 7.1.4 Neste Bio-based Sustainable Aviation Fuel (SAF) Product Offerings
- 7.1.5 Neste Recent Development
- 7.2 World Energy
- 7.2.1 World Energy Company Information
- 7.2.2 World Energy Introduction and Business Overview
- 7.2.3 World Energy Bio-based Sustainable Aviation Fuel (SAF) Sales, Revenue, Price and Gross Margin (2020-2023)
- 7.2.4 World Energy Bio-based Sustainable Aviation Fuel (SAF) Product Offerings
- 7.2.5 World Energy Recent Development
- 7.3 TotalEnergies
- 7.3.1 TotalEnergies Company Information
- 7.3.2 TotalEnergies Introduction and Business Overview
- 7.3.3 TotalEnergies Bio-based Sustainable Aviation Fuel (SAF) Sales, Revenue, Price and Gross Margin (2020-2023)
- 7.3.4 TotalEnergies Bio-based Sustainable Aviation Fuel (SAF) Product Offerings
- 7.3.5 TotalEnergies Recent Development
- 7.4 Honeywell
- 7.4.1 Honeywell Company Information
- 7.4.2 Honeywell Introduction and Business Overview
- 7.4.3 Honeywell Bio-based Sustainable Aviation Fuel (SAF) Sales, Revenue, Price and Gross Margin (2020-2023)
- 7.4.4 Honeywell Bio-based Sustainable Aviation Fuel (SAF) Product Offerings
- 7.4.5 Honeywell Recent Development
- 7.5 SkyNRG
- 7.5.1 SkyNRG Company Information
- 7.5.2 SkyNRG Introduction and Business Overview
- 7.5.3 SkyNRG Bio-based Sustainable Aviation Fuel (SAF) Sales, Revenue, Price and Gross Margin (2020-2023)
- 7.5.4 SkyNRG Bio-based Sustainable Aviation Fuel (SAF) Product Offerings
- 7.5.5 SkyNRG Recent Development
- 7.6 LanzaJet
- 7.6.1 LanzaJet Company Information
- 7.6.2 LanzaJet Introduction and Business Overview
- 7.6.3 LanzaJet Bio-based Sustainable Aviation Fuel (SAF) Sales, Revenue, Price and Gross Margin (2020-2023)
- 7.6.4 LanzaJet Bio-based Sustainable Aviation Fuel (SAF) Product Offerings
- 7.6.5 LanzaJet Recent Development
- 7.7 Swedish Biofuels AB
- 7.7.1 Swedish Biofuels AB Company Information
- 7.7.2 Swedish Biofuels AB Introduction and Business Overview
- 7.7.3 Swedish Biofuels AB Bio-based Sustainable Aviation Fuel (SAF) Sales, Revenue, Price and Gross Margin (2020-2023)
- 7.7.4 Swedish Biofuels AB Bio-based Sustainable Aviation Fuel (SAF) Product Offerings
- 7.7.5 Swedish Biofuels AB Recent Development
- 7.8 Eni
- 7.8.1 Eni Company Information
- 7.8.2 Eni Introduction and Business Overview
- 7.8.3 Eni Bio-based Sustainable Aviation Fuel (SAF) Sales, Revenue, Price and Gross Margin (2020-2023)
- 7.8.4 Eni Bio-based Sustainable Aviation Fuel (SAF) Product Offerings
- 7.8.5 Eni Recent Development
- 7.9 Virent
- 7.9.1 Virent Company Information
- 7.9.2 Virent Introduction and Business Overview
- 7.9.3 Virent Bio-based Sustainable Aviation Fuel (SAF) Sales, Revenue, Price and Gross Margin (2020-2023)
- 7.9.4 Virent Bio-based Sustainable Aviation Fuel (SAF) Product Offerings
- 7.9.5 Virent Recent Development
8 Industry Chain Analysis
- 8.1 Bio-based Sustainable Aviation Fuel (SAF) Industrial Chain
- 8.2 Bio-based Sustainable Aviation Fuel (SAF) Upstream Analysis
- 8.2.1 Key Raw Materials
- 8.2.2 Raw Materials Key Suppliers
- 8.2.3 Manufacturing Cost Structure
- 8.3 Downstream Analysis (Customers Analysis)
- 8.4 Sales Model and Sales Channels
- 8.4.1 Bio-based Sustainable Aviation Fuel (SAF) Sales Model
- 8.4.2 Bio-based Sustainable Aviation Fuel (SAF) Distributors
9 Research Findings and Conclusion
10 Appendix
- 10.1 Research Methodology
- 10.1.1 Methodology/Research Approach
- 10.1.2 Data Source
- 10.2 Author Details
- 10.3 Disclaimer

