|
|
市場調査レポート
商品コード
1150007
メタバースの世界市場 - 市場シェア・規模・動向・業界分析:コンポーネント別、技術別、用途別、業界別、地域別、セグメント予測(2022年~2030年)Metaverse Market Share, Size, Trends, Industry Analysis Report, By Component (Hardware, Software, Service); By Technology; By Application; By Industry Vertical; By Region; Segment Forecast, 2022 - 2030 |
||||||
|
|
|||||||
|
● お客様のご希望に応じて、既存データの加工や未掲載情報(例:国別セグメント)の追加などの対応が可能です。 詳細はお問い合わせください。 |
|||||||


| メタバースの世界市場 - 市場シェア・規模・動向・業界分析:コンポーネント別、技術別、用途別、業界別、地域別、セグメント予測(2022年~2030年) |
|
出版日: 2022年10月01日
発行: Polaris Market Research
ページ情報: 英文 115 Pages
納期: 即日から翌営業日
|
- 全表示
- 概要
- 図表
- 目次
世界のメタバースの市場規模は、2030年までに6,808億米ドルに達すると予測されています。
当レポートでは、世界のメタバース市場を調査しており、市場の概要、市場規模や予測、動向、促進要因・抑制要因、コンポーネント別・技術別・用途別・業界別・地域別などの分析、さらに企業プロファイルなどを提供しています。
目次
第1章 イントロダクション
- レポートの説明
- 調査の目的
- 市場範囲
- 前提条件
- 利害関係者
第2章 エグゼクティブサマリー
- 市場のハイライト
第3章 調査手法
- 概要
- データマイニング
- 情報源
- 一次情報
- 二次情報
第4章 世界のメタバース市場の洞察
- メタバース - 業界のスナップショット
- メタバース市場力学
- 促進要因と機会
- 抑制要因と課題
- ポーターのファイブフォース分析
- 供給企業の交渉力
- 新規参入者の脅威
- 買い手の交渉力
- 代替品の脅威
- 既存企業間の競争力
- PESTLE分析
- メタバース業界の動向
- バリューチェーン分析
- COVID-19影響分析
第5章 世界のメタバース市場:用途別
- 主な調査結果
- イントロダクション
- 世界のメタバース市場、用途別(2018年~2030年)
- デジタルマーケティング
- 世界のメタバース市場、デジタルマーケティング別、地域別(2018年~2030年)
- コンテンツ作成・ソーシャルメディア
- 世界のメタバース市場、コンテンツ作成・ソーシャルメディア別、地域別(2018年~2030年)
- ゲーム
- 世界のメタバース市場、ゲーム別、地域別(2018年~2030年)
- イベント・会議
- 世界のメタバース市場、イベント・会議別、地域別(2018年~2030年)
- オンラインショッピング
- 世界のメタバース市場、オンラインショッピング別、地域別(2018年~2030年)
- 試験・検査
- 世界のメタバース市場、試験・検査別、地域別(2018年~2030年)
- その他
- 世界のメタバース市場、その他別、地域別(2018年~2030年)
第6章 世界のメタバース市場:コンポーネント別
- 主な調査結果
- イントロダクション
- 世界のメタバース市場、コンポーネント別(2018年~2030年)
- ハードウェア
- 世界のメタバース市場、ハードウェア別、地域別(2018年~2030年)
- ソフトウェア
- 世界のメタバース市場、ソフトウェア別、地域別(2018年~2030年)
- サービス
- 世界のメタバース市場、サービス別、地域別(2018年~2030年)
第7章 世界のメタバース市場:技術別
- 主な調査結果
- イントロダクション
- 世界のメタバース市場、技術別(2018年~2030年)
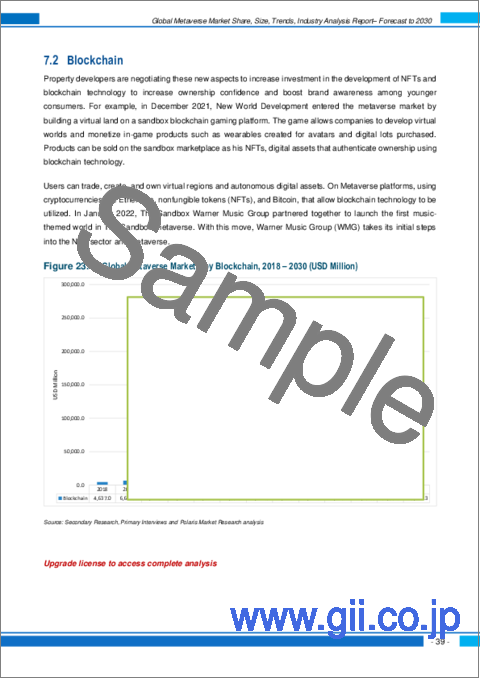
- ブロックチェーン
- 世界のメタバース市場、ブロックチェーン別、地域別(2018年~2030年)
- 仮想現実・拡張現実
- 世界のメタバース市場、仮想現実・拡張現実別、地域別(2018年~2030年)
- 複合現実
- 世界のメタバース市場、複合現実別、地域別(2018年~2030年)
- その他
- 世界のメタバース市場、その他別、地域別(2018年~2030年)
第8章 世界のメタバース市場:業界別
- 主な調査結果
- イントロダクション
- 世界のメタバース市場、業界別(2018年~2030年)
- 小売
- 世界のメタバース市場、小売別、地域別(2018年~2030年)
- メディア・エンターテイメント
- 世界のメタバース市場、メディア・エンターテイメント別、地域別(2018年~2030年)
- BFSI
- 世界のメタバース市場、BFSI別、地域別(2018年~2030年)
- その他
- 世界のメタバース市場、その他別、地域別(2018年~2030年)
第9章 世界のメタバース市場:地域別
- 主な調査結果
- イントロダクション
- メタバース市場評価、地域別(2018年~2030年)
- メタバース市場 - 北米
- 北米:メタバース市場、用途別(2018年~2030年)
- 北米:メタバース市場、業界別(2018年~2030年)
- 北米:メタバース市場、コンポーネント別(2018年~2030年)
- 北米:メタバース市場、技術別(2018年~2030年)
- メタバース市場 - 米国
- メタバース市場 - カナダ
- メタバース市場 - 欧州
- 欧州:メタバース市場、用途別(2018年~2030年)
- 欧州:メタバース市場、業界別(2018年~2030年)
- 欧州:メタバース市場、コンポーネント別(2018年~2030年)
- 欧州:メタバース市場、技術別(2018年~2030年)
- メタバース市場 - 英国
- メタバース市場 - フランス
- メタバース市場 - ドイツ
- メタバース市場 - イタリア
- メタバース市場 - スペイン
- メタバース市場 - オランダ
- メタバース市場 - ロシア
- メタバース市場 - アジア太平洋
- アジア太平洋:メタバース市場、用途別(2018年~2030年)
- アジア太平洋:メタバース市場、業界別(2018年~2030年)
- アジア太平洋:メタバース市場、コンポーネント別(2018年~2030年)
- アジア太平洋:メタバース市場、技術別(2018年~2030年)
- メタバース市場 - 中国
- メタバース市場 - インド
- メタバース市場 - 日本
- メタバース市場 - マレーシア
- メタバース市場 - インドネシア
- メタバース市場 - 韓国
- メタバース市場 - 中東・アフリカ
- 中東・アフリカ:メタバース市場、用途別(2018年~2030年)
- 中東・アフリカ:メタバース市場、業界別(2018年~2030年)
- 中東・アフリカ:メタバース市場、コンポーネント別(2018年~2030年)
- 中東・アフリカ:メタバース市場、技術別(2018年~2030年)
- メタバース市場 - サウジアラビア
- メタバース市場 - 南アフリカ
- メタバース市場 - イスラエル
- メタバース市場 - アラブ首長国連邦
- メタバース市場 - ラテンアメリカ
- ラテンアメリカ:メタバース市場、用途別(2018年~2030年)
- ラテンアメリカ:メタバース市場、業界別(2018年~2030年)
- ラテンアメリカ:メタバース市場、コンポーネント別(2018年~2030年)
- ラテンアメリカ:メタバース市場、技術別(2018年~2030年)
- メタバース市場 - メキシコ
- メタバース市場 - ブラジル
- メタバース市場 - アルゼンチン
第10章 競合情勢
- 拡大・買収の分析
- 拡大
- 買収
- パートナーシップ/コラボレーション/協定/公開
第11章 企業プロファイル
- Alibaba Group Holding Limited
- ByteDance Ltd
- Facebook, Inc
- Huawei Technologies Co. Ltd.
- Meta
- Microsoft Corporation
- Nextech AR Solutions Inc
- NVIDIA Corporation
- Roblox Corporation
- Sandbox VR
- Shenzhen Zqgame Co., Ltd
- Tencent
- Unity Technologies
- VR Chat
- ZQGame
List of Tables
- Table 1 Global Metaverse Market, by Application, by Region, 2018 - 2030 (USD Billion)
- Table 2 Global Metaverse Market, by Component, by Region, 2018 - 2030 (USD Billion)
- Table 3 Global Metaverse Market, by Technology, by Region, 2018 - 2030 (USD Billion)
- Table 4 Global Metaverse Market, by Industry Vertical, by Region, 2018 - 2030 (USD Billion)
- Table 5 Metaverse Market Assessment, By Geography, 2018 - 2030 (USD Billion)
- Table 6 North America: Metaverse Market, by Application, 2018 - 2030 (USD Billion)
- Table 7 North America: Metaverse Market, by Component, 2018 - 2030 (USD Billion)
- Table 8 North America: Metaverse Market, by Technology, 2018 - 2030 (USD Billion)
- Table 9 North America: Metaverse Market, by Industry Vertical, 2018 - 2030 (USD Billion)
- Table 10 U.S.: Metaverse Market, by Application, 2018 - 2030 (USD Billion)
- Table 11 U.S.: Metaverse Market, by Component, 2018 - 2030 (USD Billion)
- Table 12 U.S.: Metaverse Market, by Technology, 2018 - 2030 (USD Billion)
- Table 13 U.S.: Metaverse Market, by Industry Vertical, 2018 - 2030 (USD Billion)
- Table 14 Canada: Metaverse Market, by Application, 2018 - 2030 (USD Billion)
- Table 15 Canada: Metaverse Market, by Component, 2018 - 2030 (USD Billion)
- Table 16 Canada: Metaverse Market, by Technology, 2018 - 2030 (USD Billion)
- Table 17 Canada: Metaverse Market, by Industry Vertical, 2018 - 2030 (USD Billion)
- Table 18 Europe: Metaverse Market, by Application, 2018 - 2030 (USD Billion)
- Table 19 Europe: Metaverse Market, by Component, 2018 - 2030 (USD Billion)
- Table 20 Europe: Metaverse Market, by Technology, 2018 - 2030 (USD Billion)
- Table 21 Europe: Metaverse Market, by Industry Vertical, 2018 - 2030 (USD Billion)
- Table 22 Germany: Metaverse Market, by Application, 2018 - 2030 (USD Billion)
- Table 23 Germany: Metaverse Market, by Component, 2018 - 2030 (USD Billion)
- Table 24 Germany: Metaverse Market, by Technology, 2018 - 2030 (USD Billion)
- Table 25 Germany: Metaverse Market, by Industry Vertical, 2018 - 2030 (USD Billion)
- Table 26 France: Metaverse Market, by Application, 2018 - 2030 (USD Billion)
- Table 27 France: Metaverse Market, by Component, 2018 - 2030 (USD Billion)
- Table 28 France: Metaverse Market, by Technology, 2018 - 2030 (USD Billion)
- Table 29 France: Metaverse Market, by Industry Vertical, 2018 - 2030 (USD Billion)
- Table 30 UK: Metaverse Market, by Application, 2018 - 2030 (USD Billion)
- Table 31 UK: Metaverse Market, by Component, 2018 - 2030 (USD Billion)
- Table 32 UK: Metaverse Market, by Technology, 2018 - 2030 (USD Billion)
- Table 33 UK: Metaverse Market, by Industry Vertical, 2018 - 2030 (USD Billion)
- Table 34 Italy: Metaverse Market, by Application, 2018 - 2030 (USD Billion)
- Table 35 Italy: Metaverse Market, by Component, 2018 - 2030 (USD Billion)
- Table 36 Italy: Metaverse Market, by Technology, 2018 - 2030 (USD Billion)
- Table 37 Italy: Metaverse Market, by Industry Vertical, 2018 - 2030 (USD Billion)
- Table 38 Netherlands: Metaverse Market, by Application, 2018 - 2030 (USD Billion)
- Table 39 Netherlands: Metaverse Market, by Component, 2018 - 2030 (USD Billion)
- Table 40 Netherlands: Metaverse Market, by Technology, 2018 - 2030 (USD Billion)
- Table 41 Netherlands: Metaverse Market, by Industry Vertical, 2018 - 2030 (USD Billion)
- Table 42 Spain: Metaverse Market, by Application, 2018 - 2030 (USD Billion)
- Table 43 Spain: Metaverse Market, by Component, 2018 - 2030 (USD Billion)
- Table 44 Spain: Metaverse Market, by Technology, 2018 - 2030 (USD Billion)
- Table 45 Spain: Metaverse Market, by Industry Vertical, 2018 - 2030 (USD Billion)
- Table 46 Russia: Metaverse Market, by Application, 2018 - 2030 (USD Billion)
- Table 47 Russia: Metaverse Market, by Component, 2018 - 2030 (USD Billion)
- Table 48 Russia: Metaverse Market, by Technology, 2018 - 2030 (USD Billion)
- Table 49 Russia: Metaverse Market, by Industry Vertical, 2018 - 2030 (USD Billion)
- Table 50 Asia Pacific: Metaverse Market, by Application, 2018 - 2030 (USD Billion)
- Table 51 Asia Pacific: Metaverse Market, by Component, 2018 - 2030 (USD Billion)
- Table 52 Asia Pacific: Metaverse Market, by Technology, 2018 - 2030 (USD Billion)
- Table 53 Asia Pacific: Metaverse Market, by Industry Vertical, 2018 - 2030 (USD Billion)
- Table 54 China: Metaverse Market, by Application, 2018 - 2030 (USD Billion)
- Table 55 China: Metaverse Market, by Component, 2018 - 2030 (USD Billion)
- Table 56 China: Metaverse Market, by Technology, 2018 - 2030 (USD Billion)
- Table 57 China: Metaverse Market, by Industry Vertical, 2018 - 2030 (USD Billion)
- Table 58 Japan: Metaverse Market, by Application, 2018 - 2030 (USD Billion)
- Table 59 Japan: Metaverse Market, by Component, 2018 - 2030 (USD Billion)
- Table 60 Japan: Metaverse Market, by Technology, 2018 - 2030 (USD Billion)
- Table 61 Japan: Metaverse Market, by Industry Vertical, 2018 - 2030 (USD Billion)
- Table 62 India: Metaverse Market, by Application, 2018 - 2030 (USD Billion)
- Table 63 India: Metaverse Market, by Component, 2018 - 2030 (USD Billion)
- Table 64 India: Metaverse Market, by Technology, 2018 - 2030 (USD Billion)
- Table 65 India: Metaverse Market, by Industry Vertical, 2018 - 2030 (USD Billion)
- Table 66 Indonesia: Metaverse Market, by Application, 2018 - 2030 (USD Billion)
- Table 67 Indonesia: Metaverse Market, by Component, 2018 - 2030 (USD Billion)
- Table 68 Indonesia: Metaverse Market, by Technology, 2018 - 2030 (USD Billion)
- Table 69 Indonesia: Metaverse Market, by Industry Vertical, 2018 - 2030 (USD Billion)
- Table 70 Malaysia: Metaverse Market, by Application, 2018 - 2030 (USD Billion)
- Table 71 Malaysia: Metaverse Market, by Component, 2018 - 2030 (USD Billion)
- Table 72 Malaysia: Metaverse Market, by Technology, 2018 - 2030 (USD Billion)
- Table 73 Malaysia: Metaverse Market, by Industry Vertical, 2018 - 2030 (USD Billion)
- Table 74 South Korea: Metaverse Market, by Application, 2018 - 2030 (USD Billion)
- Table 75 South Korea: Metaverse Market, by Component, 2018 - 2030 (USD Billion)
- Table 76 South Korea: Metaverse Market, by Technology, 2018 - 2030 (USD Billion)
- Table 77 South Korea: Metaverse Market, by Industry Vertical, 2018 - 2030 (USD Billion)
- Table 78 Latin America: Metaverse Market, by Application, 2018 - 2030 (USD Billion)
- Table 79 Latin America: Metaverse Market, by Component, 2018 - 2030 (USD Billion)
- Table 80 Latin America: Metaverse Market, by Technology, 2018 - 2030 (USD Billion)
- Table 81 Latin America: Metaverse Market, by Industry Vertical, 2018 - 2030 (USD Billion)
- Table 82 Brazil: Metaverse Market, by Application, 2018 - 2030 (USD Billion)
- Table 83 Brazil: Metaverse Market, by Component, 2018 - 2030 (USD Billion)
- Table 84 Brazil: Metaverse Market, by Technology, 2018 - 2030 (USD Billion)
- Table 85 Brazil: Metaverse Market, by Industry Vertical, 2018 - 2030 (USD Billion)
- Table 86 Mexico: Metaverse Market, by Application, 2018 - 2030 (USD Billion)
- Table 87 Mexico: Metaverse Market, by Component, 2018 - 2030 (USD Billion)
- Table 88 Mexico: Metaverse Market, by Technology, 2018 - 2030 (USD Billion)
- Table 89 Mexico: Metaverse Market, by Industry Vertical, 2018 - 2030 (USD Billion)
- Table 90 Argentina: Metaverse Market, by Application, 2018 - 2030 (USD Billion)
- Table 91 Argentina: Metaverse Market, by Component, 2018 - 2030 (USD Billion)
- Table 92 Argentina: Metaverse Market, by Technology, 2018 - 2030 (USD Billion)
- Table 93 Argentina: Metaverse Market, by Industry Vertical, 2018 - 2030 (USD Billion)
- Table 94 Middle East & Africa: Metaverse Market, by Application, 2018 - 2030 (USD Billion)
- Table 95 Middle East & Africa: Metaverse Market, by Component, 2018 - 2030 (USD Billion)
- Table 96 Middle East & Africa: Metaverse Market, by Technology, 2018 - 2030 (USD Billion)
- Table 97 Middle East & Africa: Metaverse Market, by Industry Vertical, 2018 - 2030 (USD Billion)
- Table 98 UAE: Metaverse Market, by Application, 2018 - 2030 (USD Billion)
- Table 99 UAE: Metaverse Market, by Component, 2018 - 2030 (USD Billion)
- Table 100 UAE: Metaverse Market, by Technology, 2018 - 2030 (USD Billion)
- Table 101 UAE: Metaverse Market, by Industry Vertical, 2018 - 2030 (USD Billion)
- Table 102 Saudi Arabia: Metaverse Market, by Application, 2018 - 2030 (USD Billion)
- Table 103 Saudi Arabia: Metaverse Market, by Component, 2018 - 2030 (USD Billion)
- Table 104 Saudi Arabia: Metaverse Market, by Technology, 2018 - 2030 (USD Billion)
- Table 105 Saudi Arabia: Metaverse Market, by Industry Vertical, 2018 - 2030 (USD Billion)
- Table 106 South Africa: Metaverse Market, by Application, 2018 - 2030 (USD Billion)
- Table 107 South Africa: Metaverse Market, by Component, 2018 - 2030 (USD Billion)
- Table 108 South Africa: Metaverse Market, by Technology, 2018 - 2030 (USD Billion)
- Table 109 South Africa: Metaverse Market, by Industry Vertical, 2018 - 2030 (USD Billion)
- Table 110 Israel: Metaverse Market, by Application, 2018 - 2030 (USD Billion)
- Table 111 Israel: Metaverse Market, by Component, 2018 - 2030 (USD Billion)
- Table 112 Israel: Metaverse Market, by Technology, 2018 - 2030 (USD Billion)
- Table 113 Israel: Metaverse Market, by Industry Vertical, 2018 - 2030 (USD Billion)
List of Figures
Figure 1. Global Metaverse Market, 2018 - 2030 (USD Billion)
Figure 2. Integrated Ecosystem
Figure 3. Research Methodology: Top-Down & Bottom-Up Industry Vertical
Figure 4. Market by Geography
Figure 5. Porter's Five Forces
Figure 6. Market by Application
Figure 7. Global Metaverse Market, by Application, 2021 & 2030 (USD Billion)
Figure 8. Market by Industry Vertical
Figure 9. Global Metaverse Market, by Industry Vertical, 2021 & 2030 (USD Billion)
Figure 10. Market by Component
Figure 11. Global Metaverse Market, by Component, 2021 & 2030 (USD Billion)
Figure 12. Market by Technology
Figure 13. Global Metaverse Market, by Technology, 2021 & 2030 (USD Billion)
Figure 14. Metaverse Market Assessment, By Geography, 2018 - 2030 (USD Billion)
Figure 15. Strategic Analysis - Metaverse Market
The global metaverse market size is expected to reach USD 680.80 billion by 2030, according to a new study by Polaris Market Research. The report "Metaverse Market Share, Size, Trends, Industry Analysis Report, By Component (Hardware, Software, Service); By Technology; By Application; By Industry Vehicle; By Region; Segment Forecast, 2022 - 2030" gives a detailed insight into current market dynamics and provides analysis on future market growth.
The metaverse is an online reality that is an amalgamation of online gaming, social media, augmented reality (AR), virtual reality (VR), and cryptocurrencies, wherein users can interact with each other virtually. Augmented reality showcases visual features, noise, and other sensory input in real-life situations to augment the user experience.
Moreover, during COVID-19, when governments across the world announced lockdown and people were working from home, the key vendors introduced such platforms as a replacement for outdoor social interaction in the comfort of a user's home, hosting highly public events such as music concerts and meetups to offer virtual tour opportunities to famous global landmarks. Such use cases of these platforms drove its growth during the period.
Based on a study, in April 2022, the average time spent on social media increased from just 1 hour in 2012 to over 2 hours and 24 minutes in 2020. Moreover, time spent on social media platforms was heavily inflated during the pandemic, as people stuck in their homes relied on social media platforms for interactions with their peers, friends, and family. Such factors further supported the growth of metaverse platforms during the period.
Furthermore, these platforms provided businesses with easily interact with their audiences and customers, which led to their engagement and hence overall customer satisfaction. This led to a rise in the growth of the industry during the period.
Metaverse Market Report Highlights
Software segment is expected to hold a significant share in 2021, due to the appealing interface and intuitiveness of the software
Content creation and social media is expected to be the most lucrative segment, owing to the growing content creators across the globe and surge in need for metaverse platform by various content creators
North America region will lead the global market by 2030 on account of presence of leading players in the region, greater technological adoption, and rise in investment in development of new technologies
The global market is highly competitive owing to the existence of large market players with global presence including include Alibaba Group Holding Limited, ByteDance Ltd, Facebook, Inc., Huawei Technologies Co. Ltd., Meta, Microsoft Corporation, Nextech AR Solutions Inc., NVIDIA Corporation, Roblox Corporation, and Sandbox VR among others
Polaris Market Research has segmented the metaverse market report based on component, technology, application, industry vertical and region:
Metaverse, Component Outlook (Revenue - USD Billion, 2018 - 2030)
Hardware
Software
Service
Metaverse, Technology Outlook (Revenue - USD Billion, 2018 - 2030)
Blockchain
Virtual Reality and Augmented Reality
Mixed Reality
Others
Metaverse, Application Outlook (Revenue - USD Billion, 2018 - 2030)
Digital Marketing
Content Creation and Social Media
Gaming
Events and Conference
Online Shopping
Testing and Inspection
Others
Metaverse, Industry Vertical Outlook (Revenue - USD Billion, 2018 - 2030)
Retail
Media & Entertainment
BFSI
Others
Metaverse, Regional Outlook (Revenue - USD Billion, 2018 - 2030)
North America
U.S
Canada
Europe
Germany
UK
France
Italy
Spain
Russia
Netherlands
Asia Pacific
China
India
Japan
South Korea
Indonesia
Malaysia
Latin America
Argentina
Brazil
Mexico
Middle East & Africa
UAE
Saudi Arabia
Israel
South Africa
Table of Contents
1. Introduction
- 1.1. Report Description
- 1.1.1. Objectives of the Study
- 1.1.2. Market Scope
- 1.1.3. Assumptions
- 1.2. Stakeholders
2. Executive Summary
- 2.1. Market Highlights
3. Research Methodology
- 3.1. Overview
- 3.1.1. Data Mining
- 3.2. Data Sources
- 3.2.1. Primary Sources
- 3.2.2. Secondary Sources
4. Global Metaverse Market Insights
- 4.1. Metaverse - Industry Snapshot
- 4.2. Metaverse Market Dynamics
- 4.2.1. Drivers and Opportunities
- 4.2.1.1. Increasing demand in the entertainment and gaming industry
- 4.2.1.2. Continuous development in 5G technology
- 4.2.2. Restraints and Challenges
- 4.2.2.1. Health and mental issues from excessive use
- 4.2.1. Drivers and Opportunities
- 4.3. Porter's Five Forces Analysis
- 4.3.1. Bargaining Power of Suppliers (Moderate)
- 4.3.2. Threats of New Entrants: (Low)
- 4.3.3. Bargaining Power of Buyers (Moderate)
- 4.3.4. Threat of Substitute (Moderate)
- 4.3.5. Rivalry among existing firms (High)
- 4.4. PESTLE Analysis
- 4.5. Metaverse Industry Trends
- 4.6. Value Chain Analysis
- 4.7. COVID-19 Impact Analysis
5. Global Metaverse Market, by Application
- 5.1. Key Findings
- 5.2. Introduction
- 5.2.1. Global Metaverse Market, by Application, 2018 - 2030 (USD Billion)
- 5.3. Digital Marketing
- 5.3.1. Global Metaverse Market, by Digital Marketing, by Region, 2018 - 2030 (USD Billion)
- 5.4. Content Creation and Social Media
- 5.4.1. Global Metaverse Market, by Content Creation and Social Media, by Region, 2018 - 2030 (USD Billion)
- 5.5. Gaming
- 5.5.1. Global Metaverse Market, by Gaming, by Region, 2018 - 2030 (USD Billion)
- 5.6. Events and Conference
- 5.6.1. Global Metaverse Market, by Events and Conference, by Region, 2018 - 2030 (USD Billion)
- 5.7. Online Shopping
- 5.7.1. Global Metaverse Market, by Online Shopping, by Region, 2018 - 2030 (USD Billion)
- 5.8. Testing and Inspection
- 5.8.1. Global Metaverse Market, by Testing and Inspection, by Region, 2018 - 2030 (USD Billion)
- 5.9. Others
- 5.9.1. Global Metaverse Market, by Others, by Region, 2018 - 2030 (USD Billion)
6. Global Metaverse Market, by Component
- 6.1. Key Findings
- 6.2. Introduction
- 6.2.1. Global Metaverse Market, by Component, 2018 - 2030 (USD Billion)
- 6.3. Hardware
- 6.3.1. Global Metaverse Market, by Hardware, by Region, 2018 - 2030 (USD Billion)
- 6.4. Software
- 6.4.1. Global Metaverse Market, by Software, by Region, 2018 - 2030 (USD Billion)
- 6.5. Service
- 6.5.1. Global Metaverse Market, by Service, by Region, 2018 - 2030 (USD Billion)
7. Global Metaverse Market, by Technology
- 7.1. Key Findings
- 7.2. Introduction
- 7.2.1. Global Metaverse Market, by Technology, 2018 - 2030 (USD Billion)
- 7.3. Blockchain
- 7.3.1. Global Metaverse Market, by Blockchain, by Region, 2018 - 2030 (USD Billion)
- 7.4. Virtual Reality and Augmented Reality
- 7.4.1. Global Metaverse Market, by Virtual Reality and Augmented Reality, by Region, 2018 - 2030 (USD Billion)
- 7.5. Mixed Reality
- 7.5.1. Global Metaverse Market, by Mixed Reality, by Region, 2018 - 2030 (USD Billion)
- 7.6. Others
- 7.6.1. Global Metaverse Market, by Others, by Region, 2018 - 2030 (USD Billion)
8. Global Metaverse Market, by Industry Vertical
- 8.1. Key Findings
- 8.2. Introduction
- 8.2.1. Global Metaverse Market, by Industry Vertical, 2018 - 2030 (USD Billion)
- 8.3. Retail
- 8.3.1. Global Metaverse Market, by Retail, by Region, 2018 - 2030 (USD Billion)
- 8.4. Media & Entertainment
- 8.4.1. Global Metaverse Market, by Media & Entertainment, by Region, 2018 - 2030 (USD Billion)
- 8.5. BFSI
- 8.5.1. Global Metaverse Market, by BFSI, by Region, 2018 - 2030 (USD Billion)
- 8.6. Others
- 8.6.1. Global Other Metaverse Market, by Region, 2018 - 2030 (USD Billion)
9. Global Metaverse Market, by Geography
- 9.1. Key findings
- 9.2. Introduction
- 9.2.1. Metaverse Market Assessment, By Geography, 2018 - 2030 (USD Billion)
- 9.3. Metaverse Market - North America
- 9.3.1. North America: Metaverse Market, by Application, 2018 - 2030 (USD Billion)
- 9.3.2. North America: Metaverse Market, by Industry Vertical, 2018 - 2030 (USD Billion)
- 9.3.3. North America: Metaverse Market, by Component, 2018 - 2030 (USD Billion)
- 9.3.4. North America: Metaverse Market, by Technology, 2018 - 2030 (USD Billion)
- 9.3.5. Metaverse Market - U.S.
- 9.3.5.1. U.S.: Metaverse Market, by Application, 2018 - 2030 (USD Billion)
- 9.3.5.2. U.S.: Metaverse Market, by Industry Vertical, 2018 - 2030 (USD Billion)
- 9.3.5.3. U.S.: Metaverse Market, by Component, 2018 - 2030 (USD Billion)
- 9.3.5.4. U.S.: Metaverse Market, by Technology, 2018 - 2030 (USD Billion)
- 9.3.6. Metaverse Market - Canada
- 9.3.6.1. Canada: Metaverse Market, by Application, 2018 - 2030 (USD Billion)
- 9.3.6.2. Canada: Metaverse Market, by Industry Vertical, 2018 - 2030 (USD Billion)
- 9.3.6.3. Canada: Metaverse Market, by Component, 2018 - 2030 (USD Billion)
- 9.3.6.4. Canada: Metaverse Market, by Technology, 2018 - 2030 (USD Billion)
- 9.4. Metaverse Market - Europe
- 9.4.1. Europe: Metaverse Market, by Application, 2018 - 2030 (USD Billion)
- 9.4.2. Europe: Metaverse Market, by Industry Vertical, 2018 - 2030 (USD Billion)
- 9.4.3. Europe: Metaverse Market, by Component, 2018 - 2030 (USD Billion)
- 9.4.4. Europe: Metaverse Market, by Technology, 2018 - 2030 (USD Billion)
- 9.4.5. Metaverse Market - UK
- 9.4.5.1. UK: Metaverse Market, by Application, 2018 - 2030 (USD Billion)
- 9.4.5.2. UK: Metaverse Market, by Industry Vertical, 2018 - 2030 (USD Billion)
- 9.4.5.3. UK: Metaverse Market, by Component, 2018 - 2030 (USD Billion)
- 9.4.5.4. UK: Metaverse Market, by Technology, 2018 - 2030 (USD Billion)
- 9.4.6. Metaverse Market - France
- 9.4.6.1. France: Metaverse Market, by Application, 2018 - 2030 (USD Billion)
- 9.4.6.2. France: Metaverse Market, by Industry Vertical, 2018 - 2030 (USD Billion)
- 9.4.6.3. France: Metaverse Market, by Component, 2018 - 2030 (USD Billion)
- 9.4.6.4. France: Metaverse Market, by Technology, 2018 - 2030 (USD Billion)
- 9.4.7. Metaverse Market - Germany
- 9.4.7.1. Germany: Metaverse Market, by Application, 2018 - 2030 (USD Billion)
- 9.4.7.2. Germany: Metaverse Market, by Industry Vertical, 2018 - 2030 (USD Billion)
- 9.4.7.3. Germany: Metaverse Market, by Component, 2018 - 2030 (USD Billion)
- 9.4.7.4. Germany: Metaverse Market, by Technology, 2018 - 2030 (USD Billion)
- 9.4.8. Metaverse Market - Italy
- 9.4.8.1. Italy: Metaverse Market, by Application, 2018 - 2030 (USD Billion)
- 9.4.8.2. Italy: Metaverse Market, by Industry Vertical, 2018 - 2030 (USD Billion)
- 9.4.8.3. Italy: Metaverse Market, by Component, 2018 - 2030 (USD Billion)
- 9.4.8.4. Italy: Metaverse Market, by Technology, 2018 - 2030 (USD Billion)
- 9.4.9. Metaverse Market - Spain
- 9.4.9.1. Spain: Metaverse Market, by Application, 2018 - 2030 (USD Billion)
- 9.4.9.2. Spain: Metaverse Market, by Industry Vertical, 2018 - 2030 (USD Billion)
- 9.4.9.3. Spain: Metaverse Market, by Component, 2018 - 2030 (USD Billion)
- 9.4.9.4. Spain: Metaverse Market, by Technology, 2018 - 2030 (USD Billion)
- 9.4.10. Metaverse Market - Netherlands
- 9.4.10.1. Netherlands: Metaverse Market, by Application, 2018 - 2030 (USD Billion)
- 9.4.10.2. Netherlands: Metaverse Market, by Industry Vertical, 2018 - 2030 (USD Billion)
- 9.4.10.3. Netherlands: Metaverse Market, by Component, 2018 - 2030 (USD Billion)
- 9.4.10.4. Netherlands: Metaverse Market, by Technology, 2018 - 2030 (USD Billion)
- 9.4.11. Metaverse Market - Russia
- 9.4.11.1. Russia: Metaverse Market, by Application, 2018 - 2030 (USD Billion)
- 9.4.11.2. Russia.: Metaverse Market, by Industry Vertical, 2018 - 2030 (USD Billion)
- 9.4.11.3. Russia: Metaverse Market, by Component, 2018 - 2030 (USD Billion)
- 9.4.11.4. Russia: Metaverse Market, by Technology, 2018 - 2030 (USD Billion)
- 9.5. Metaverse Market - Asia Pacific
- 9.5.1. Asia Pacific: Metaverse Market, by Application, 2018 - 2030 (USD Billion)
- 9.5.2. Asia Pacific: Metaverse Market, by Industry Vertical, 2018 - 2030 (USD Billion)
- 9.5.3. Asia Pacific: Metaverse Market, by Component, 2018 - 2030 (USD Billion)
- 9.5.4. Asia Pacific: Metaverse Market, by Technology, 2018 - 2030 (USD Billion)
- 9.5.5. Metaverse Market - China
- 9.5.5.1. China: Metaverse Market, by Application, 2018 - 2030 (USD Billion)
- 9.5.5.2. China.: Metaverse Market, by Industry Vertical, 2018 - 2030 (USD Billion)
- 9.5.5.3. China: Metaverse Market, by Component, 2018 - 2030 (USD Billion)
- 9.5.5.4. China: Metaverse Market, by Technology, 2018 - 2030 (USD Billion)
- 9.5.6. Metaverse Market - India
- 9.5.6.1. India: Metaverse Market, by Application, 2018 - 2030 (USD Billion)
- 9.5.6.2. India.: Metaverse Market, by Industry Vertical, 2018 - 2030 (USD Billion)
- 9.5.6.3. India: Metaverse Market, by Component, 2018 - 2030 (USD Billion)
- 9.5.6.4. India: Metaverse Market, by Technology, 2018 - 2030 (USD Billion)
- 9.5.7. Metaverse Market - Japan
- 9.5.7.1. Japan: Metaverse Market, by Application, 2018 - 2030 (USD Billion)
- 9.5.7.2. Japan.: Metaverse Market, by Industry Vertical, 2018 - 2030 (USD Billion)
- 9.5.7.3. Japan: Metaverse Market, by Component, 2018 - 2030 (USD Billion)
- 9.5.7.4. Japan: Metaverse Market, by Technology, 2018 - 2030 (USD Billion)
- 9.5.8. Metaverse Market - Malaysia
- 9.5.8.1. Malaysia: Metaverse Market, by Application, 2018 - 2030 (USD Billion)
- 9.5.8.2. Malaysia.: Metaverse Market, by Industry Vertical, 2018 - 2030 (USD Billion)
- 9.5.8.3. Malaysia: Metaverse Market, by Component, 2018 - 2030 (USD Billion)
- 9.5.8.4. Malaysia: Metaverse Market, by Technology, 2018 - 2030 (USD Billion)
- 9.5.9. Metaverse Market - Indonesia
- 9.5.9.1. Indonesia: Metaverse Market, by Application, 2018 - 2030 (USD Billion)
- 9.5.9.2. Indonesia.: Metaverse Market, by Industry Vertical, 2018 - 2030 (USD Billion)
- 9.5.9.3. Indonesia: Metaverse Market, by Component, 2018 - 2030 (USD Billion)
- 9.5.9.4. Indonesia: Metaverse Market, by Technology, 2018 - 2030 (USD Billion)
- 9.5.10. Metaverse Market - South Korea
- 9.5.10.1. South Korea: Metaverse Market, by Application, 2018 - 2030 (USD Billion)
- 9.5.10.2. South Korea.: Metaverse Market, by Industry Vertical, 2018 - 2030 (USD Billion)
- 9.5.10.3. South Korea: Metaverse Market, by Component, 2018 - 2030 (USD Billion)
- 9.5.10.4. South Korea: Metaverse Market, by Technology, 2018 - 2030 (USD Billion)
- 9.6. Metaverse Market - Middle East & Africa
- 9.6.1. Middle East & Africa: Metaverse Market, by Application, 2018 - 2030 (USD Billion)
- 9.6.2. Middle East & Africa: Metaverse Market, by Industry Vertical, 2018 - 2030 (USD Billion)
- 9.6.3. Middle East & Africa: Metaverse Market, by Component, 2018 - 2030 (USD Billion)
- 9.6.4. Middle East & Africa: Metaverse Market, by Technology, 2018 - 2030 (USD Billion)
- 9.6.5. Metaverse Market - Saudi Arabia
- 9.6.5.1. Saudi Arabia: Metaverse Market, by Application, 2018 - 2030 (USD Billion)
- 9.6.5.2. Saudi Arabia: Metaverse Market, by Industry Vertical, 2018 - 2030 (USD Billion)
- 9.6.5.3. Saudi Arabia: Metaverse Market, by Component, 2018 - 2030 (USD Billion)
- 9.6.5.4. Saudi Arabia: Metaverse Market, by Technology, 2018 - 2030 (USD Billion)
- 9.6.6. Metaverse Market - South Africa
- 9.6.6.1. South Africa: Metaverse Market, by Application, 2018 - 2030 (USD Billion)
- 9.6.6.2. South Africa: Metaverse Market, by Industry Vertical, 2018 - 2030 (USD Billion)
- 9.6.6.3. South Africa: Metaverse Market, by Component, 2018 - 2030 (USD Billion)
- 9.6.6.4. South Africa: Metaverse Market, by Technology, 2018 - 2030 (USD Billion)
- 9.6.7. Metaverse Market - Israel
- 9.6.7.1. Israel: Metaverse Market, by Application, 2018 - 2030 (USD Billion)
- 9.6.7.2. Israel: Metaverse Market, by Industry Vertical, 2018 - 2030 (USD Billion)
- 9.6.7.3. Israel: Metaverse Market, by Component, 2018 - 2030 (USD Billion)
- 9.6.7.4. Israel: Metaverse Market, by Technology, 2018 - 2030 (USD Billion)
- 9.6.8. Metaverse Market - UAE
- 9.6.8.1. UAE: Metaverse Market, by Application, 2018 - 2030 (USD Billion)
- 9.6.8.2. UAE: Metaverse Market, by Industry Vertical, 2018 - 2030 (USD Billion)
- 9.6.8.3. UAE: Metaverse Market, by Component, 2018 - 2030 (USD Billion)
- 9.6.8.4. UAE: Metaverse Market, by Technology, 2018 - 2030 (USD Billion)
- 9.7. Metaverse Market - Latin America
- 9.7.1. Latin America: Metaverse Market, by Application, 2018 - 2030 (USD Billion)
- 9.7.2. Latin America: Metaverse Market, by Industry Vertical, 2018 - 2030 (USD Billion)
- 9.7.3. Latin America: Metaverse Market, by Component, 2018 - 2030 (USD Billion)
- 9.7.4. Latin America: Metaverse Market, by Technology, 2018 - 2030 (USD Billion)
- 9.7.5. Metaverse Market - Mexico
- 9.7.5.1. Mexico: Metaverse Market, by Application, 2018 - 2030 (USD Billion)
- 9.7.5.2. Mexico: Metaverse Market, by Industry Vertical, 2018 - 2030 (USD Billion)
- 9.7.5.3. Mexico: Metaverse Market, by Component, 2018 - 2030 (USD Billion)
- 9.7.5.4. Mexico: Metaverse Market, by Technology, 2018 - 2030 (USD Billion)
- 9.7.6. Metaverse Market - Brazil
- 9.7.6.1. Brazil: Metaverse Market, by Application, 2018 - 2030 (USD Billion)
- 9.7.6.2. Brazil: Metaverse Market, by Industry Vertical, 2018 - 2030 (USD Billion)
- 9.7.6.3. Brazil: Metaverse Market, by Component, 2018 - 2030 (USD Billion)
- 9.7.6.4. Brazil: Metaverse Market, by Technology, 2018 - 2030 (USD Billion)
- 9.7.7. Metaverse Market - Argentina
- 9.7.7.1. Argentina: Metaverse Market, by Application, 2018 - 2030 (USD Billion)
- 9.7.7.2. Argentina: Metaverse Market, by Industry Vertical, 2018 - 2030 (USD Billion)
- 9.7.7.3. Argentina: Metaverse Market, by Component, 2018 - 2030 (USD Billion)
- 9.7.7.4. Argentina: Metaverse Market, by Technology, 2018 - 2030 (USD Billion)
10. Competitive Landscape
- 10.1. Expansion and Acquisition Analysis
- 10.1.1. Expansion
- 10.1.2. Acquisitions
- 10.2. Partnerships/Collaborations/Agreements/Exhibitions
11. Company Profiles
- 11.1. Alibaba Group Holding Limited
- 11.1.1. Company Overview
- 11.1.2. Financial Performance
- 11.1.3. Product Benchmarking
- 11.1.4. Recent Development
- 11.2. ByteDance Ltd
- 11.2.1. Company Overview
- 11.2.2. Financial Performance
- 11.2.3. Product Benchmarking
- 11.2.4. Recent Development
- 11.3. Facebook, Inc
- 11.3.1. Company Overview
- 11.3.2. Financial Performance
- 11.3.3. Product Benchmarking
- 11.3.4. Recent Development
- 11.4. Huawei Technologies Co. Ltd.
- 11.4.1. Company Overview
- 11.4.2. Financial Performance
- 11.4.3. Product Benchmarking
- 11.4.4. Recent Development
- 11.5. Meta
- 11.5.1. Company Overview
- 11.5.2. Financial Performance
- 11.5.3. Product Benchmarking
- 11.5.4. Recent Development
- 11.6. Microsoft Corporation
- 11.6.1. Company Overview
- 11.6.2. Financial Performance
- 11.6.3. Product Benchmarking
- 11.6.4. Recent Development
- 11.7. Nextech AR Solutions Inc
- 11.7.1. Company Overview
- 11.7.2. Financial Performance
- 11.7.3. Product Benchmarking
- 11.7.4. Recent Development
- 11.8. NVIDIA Corporation
- 11.8.1. Company Overview
- 11.8.2. Financial Performance
- 11.8.3. Product Benchmarking
- 11.8.4. Recent Development
- 11.9. Roblox Corporation
- 11.9.1. Company Overview
- 11.9.2. Financial Performance
- 11.9.3. Product Benchmarking
- 11.9.4. Recent Development
- 11.10. Sandbox VR
- 11.10.1. Company Overview
- 11.10.2. Financial Performance
- 11.10.3. Product Benchmarking
- 11.10.4. Recent Development
- 11.11. Shenzhen Zqgame Co., Ltd
- 11.11.1. Company Overview
- 11.11.2. Financial Performance
- 11.11.3. Product Benchmarking
- 11.11.4. Recent Development
- 11.12. Tencent
- 11.12.1. Company Overview
- 11.12.2. Financial Performance
- 11.12.3. Product Benchmarking
- 11.12.4. Recent Development
- 11.13. Unity Technologies
- 11.13.1. Company Overview
- 11.13.2. Financial Performance
- 11.13.3. Product Benchmarking
- 11.13.4. Recent Development
- 11.14. VR Chat
- 11.14.1. Company Overview
- 11.14.2. Financial Performance
- 11.14.3. Product Benchmarking
- 11.14.4. Recent Development
- 11.15. ZQGame
- 11.15.1. Company Overview
- 11.15.2. Financial Performance
- 11.15.3. Product Benchmarking
- 11.15.4. Recent Development