|
|
市場調査レポート
商品コード
1508641
スポーツ栄養成分市場:世界の産業分析、規模、シェア、成長、動向、予測、2024年~2033年Sports Nutrition Ingredients Market: Global Industry Analysis, Size, Share, Growth, Trends, and Forecast, 2024-2033 |
||||||
|
|||||||
カスタマイズ可能
|
|||||||

| スポーツ栄養成分市場:世界の産業分析、規模、シェア、成長、動向、予測、2024年~2033年 |
|
出版日: 2024年06月28日
発行: Persistence Market Research
ページ情報: 英文 272 Pages
納期: 2~5営業日
|

全表示
- 概要
- 目次
Persistence Market Researchはこのほど、世界のスポーツ栄養成分市場に関する包括的なレポートを発表しました。本レポートでは、促進要因・動向・機会・課題を含む重要な市場ダイナミクスを徹底的に評価し、市場構造に関する詳細な洞察を提供しています。
主要な洞察
- スポーツ栄養成分の市場規模(2024年):66億6,720万米ドル
- 予測市場金額(2033年):103億3,590万米ドル
- 世界市場成長率(CAGR 2024年~2033年):5.0%
スポーツ栄養成分市場:調査範囲
スポーツ栄養成分は、アスリートやフィットネス愛好家の間で、運動能力の向上、回復のサポート、全体的な健康の促進に重要な役割を果たしています。タンパク質、アミノ酸、ビタミン、ミネラル、ハーブエキスを含むこれらの成分は、スポーツサプリメント、エナジードリンク、機能性食品の配合に不可欠です。スポーツ栄養成分市場は、プロのアスリートからレクリエーションのフィットネス愛好家まで幅広い消費者に対応し、筋肉の成長、持久力、回復をサポートする製品を提供しています。
市場成長の促進要因:
世界のスポーツ栄養成分市場は、フィットネス目標の達成や運動能力の向上における栄養の重要性に対する意識の高まりなど、いくつかの主要な要因によって推進されています。フィットネスや健康志向のライフスタイルの普及率の上昇と、スポーツや身体活動への参加者の増加が相まって、スポーツ栄養製品の需要を促進しています。成分配合の技術的進歩や革新的な高性能サプリメントの市場開拓は、さらに市場の成長に貢献しています。さらに、スポーツ栄養製品による健康とウェルネスのメリットを求める非スポーツ選手を含む消費者層の拡大が、市場の拡大を後押ししています。
市場の抑制要因:
有望な成長が見込まれるものの、スポーツ栄養成分市場は、規制遵守、成分の安全性、製品の有効性に関する消費者の懐疑心に関連する課題に直面しています。特定の成分の使用や表示に関する厳しい規制は、メーカーにコンプライアンス上の負担を強います。特に新規ユーザーの間では、特定のスポーツ・サプリメントの安全性や潜在的な副作用に対する懸念が、市場浸透の妨げになる可能性があります。さらに、高級スポーツ栄養製品の価格が高いため、特に新興市場では、価格に敏感な消費者の利用が制限される可能性があります。
市場機会:
スポーツ栄養成分市場は、技術革新、人口動向、消費者の選好の進化によって大きな成長機会がもたらされます。天然成分や植物由来成分の統合は、クリーンラベル製剤とともに、健康志向で環境にやさしい製品に対する需要の高まりに合致しています。ニュートリゲノミクスとウェアラブル技術の進歩に支えられた個別化栄養への注目の高まりは、個々のニーズと選好に対応したスポーツ栄養ソリューションを提供します。戦略的パートナーシップ、研究開発への投資、手頃な価格での高品質なスポーツ栄養製品の導入は、新たな機会を活用し、ダイナミックなスポーツ栄養の展望における市場のリーダーシップを維持するために不可欠です。
レポートが回答する主要な質問
- 世界のスポーツ栄養成分市場の成長を促進する主要な要因は何か?
- さまざまな消費者層でスポーツ栄養の採用を促進している成分と用途は何か?
- 技術の進歩はスポーツ栄養成分市場の競合情勢をどのように変えているのか?
- スポーツ栄養成分市場に貢献している主要企業はどこか、また市場の関連性を維持するためにどのような戦略を採用しているか?
- 世界のスポーツ栄養成分市場における新たな動向と将来性は?
目次
第1章 エグゼクティブサマリー
第2章 市場概要
- 市場範囲 / 分類
- 市場の定義 / 範囲 / 制限
第3章 主要な市場動向
- 市場に影響を与える主要な動向
- 製品イノベーション / 開発動向
第4章 主要な成功要因
- 製品の採用 / 使用状況分析
- 製品のUSP / 特徴
- 戦略的プロモーション戦略
第5章 世界のスポーツ栄養成分市場 - 価格分析
- 地域別価格動向分析、2019年~2023年
- 世界平均価格分析ベンチマーク
第6章 世界のスポーツ栄養成分市場の需要(金額、百万米ドル)分析
- 過去の市場金額(百万米ドル)分析、2019年~2023年
- 現在および将来の市場金額(百万米ドル)予測、2024年~2033年
- 前年比成長動向分析
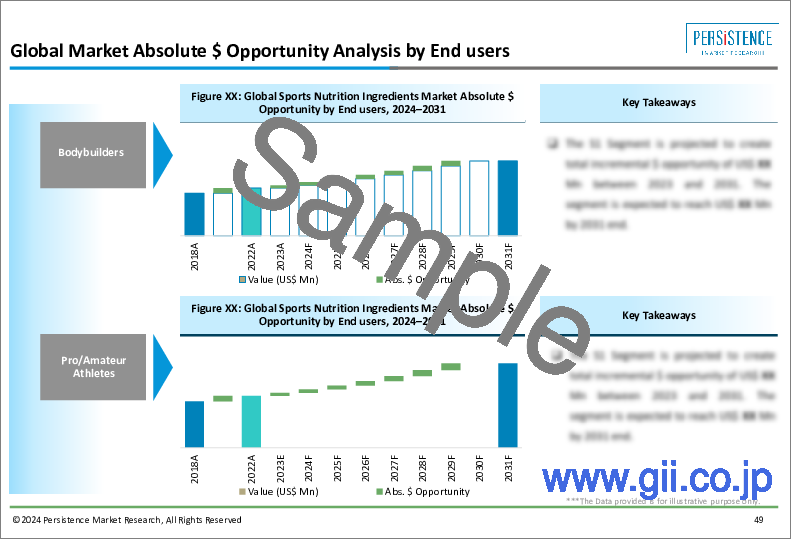
- 絶対額の機会分析
第7章 市場背景
- マクロ経済要因
- 予測要因 - 関連性と影響
- 世界の食品・飲料業界の概要
- 世界の乳製品産業の概要
- サプライチェーンとバリューチェーン分析
- 政策の展開と規制のシナリオ
- 市場力学
- 世界の需給分析
第8章 世界のスポーツ栄養成分市場分析:成分別
- イントロダクション / 主要な調査結果
- 過去の市場規模(百万米ドル):成分別、2019年~2023年
- 現在および将来の市場規模(百万米ドル)の分析と予測:成分別、2024年~2033年
- ミルクベース
- 大豆ベース
- オーガニック
- プロバイオティクス / プレバイオティクス
- 市場の魅力分析:成分別
第9章 世界のスポーツ栄養成分市場分析:最終用途別
- イントロダクション / 主要な調査結果
- 過去の市場規模(百万米ドル)分析:最終用途別、2019年~2023年
- 現在および将来の市場規模(百万米ドル)の分析と予測:最終用途別、2024年~2033年
- 経口投与
- 経腸投与
- 静脈内投与
- 市場の魅力分析:最終用途別
第10章 世界のスポーツ栄養成分市場分析:地域別
- イントロダクション
- 過去の市場規模(百万米ドル)の分析:地域別、2019年~2023年
- 現在の市場規模(百万米ドル)の分析と予測:地域別、2024年~2033年
- 北米
- ラテンアメリカ
- 欧州
- 南アジア・太平洋
- 東アジア
- 中東・アフリカ(MEA)
- 市場の魅力分析:地域別
第11章 北米のスポーツ栄養成分市場分析
第12章 ラテンアメリカのスポーツ栄養成分市場分析
第13章 欧州のスポーツ栄養成分市場分析
第14章 南アジア・太平洋のスポーツ栄養成分市場分析
第15章 東アジアのスポーツ栄養成分市場分析
第16章 中東・アフリカのスポーツ栄養成分市場分析
第17章 国別のスポーツ栄養成分市場分析、2023年
- イントロダクション
- 米国
- カナダ
- メキシコ
- ブラジル
- アルゼンチン
- ドイツ
- イタリア
- フランス
- 英国
- スペイン
- ポーランド
- ロシア
- 中国
- 日本
- 韓国
- インド
- オセアニア(オーストラリア、ニュージーランド)
- トルコ
- 南アフリカ
第18章 市場構造分析
- 市場分析:企業階層別(スポーツ栄養成分)
- 主要企業の市場シェア分析
- 市場プレゼンス分析
第19章 競合分析
- 競合ダッシュボード
- 競合ベンチマーク
- 競合の詳細情報
- Nestle SA
- Red Bull GmbH
- Ajinomoto Co., Inc.
- Keurig Dr. Pepper, Inc.
- Nutrabolt
- GlaxoSmithKline plc.
- Optimum Nutrition, Inc.
- Vitaco Health
- Uelzena Group
- Premier Nutrition Corporation
- INC Sports Nutrition
- Now Foods
- Biothrive SciencesOthers(追加リクエストに応じて)
第20章 使用される前提条件と頭字語
第21章 調査手法
Persistence Market Research has recently released a comprehensive report on the worldwide market for sports nutrition ingredients. The report offers a thorough assessment of crucial market dynamics, including drivers, trends, opportunities, and challenges, providing detailed insights into the market structure.
Key Insights:
- Sports Nutrition Ingredients Market Size (2024E): USD 6667.2 million
- Projected Market Value (2033F): USD 10335.9 million
- Global Market Growth Rate (CAGR 2024 to 2033): 5.0%
Sports Nutrition Ingredients Market - Report Scope:
Sports nutrition ingredients play a crucial role in enhancing athletic performance, supporting recovery, and promoting overall health among athletes and fitness enthusiasts. These ingredients, including proteins, amino acids, vitamins, minerals, and herbal extracts, are integral to the formulation of sports supplements, energy drinks, and functional foods. The sports nutrition ingredients market caters to a wide range of consumers, from professional athletes to recreational fitness enthusiasts, offering products that support muscle growth, endurance, and recovery.
Market Growth Drivers:
The global sports nutrition ingredients market is propelled by several key factors, including the increasing awareness of the importance of nutrition in achieving fitness goals and improving athletic performance. The rising prevalence of fitness and health-conscious lifestyles, coupled with the growing participation in sports and physical activities, drives demand for sports nutrition products. Technological advancements in ingredient formulation and the development of innovative, high-performance supplements further contribute to market growth. Moreover, the expanding consumer base, including non-athlete demographics seeking health and wellness benefits from sports nutrition products, fuels market expansion.
Market Restraints:
Despite promising growth prospects, the sports nutrition ingredients market faces challenges related to regulatory compliance, ingredient safety, and consumer skepticism regarding product efficacy. Stringent regulations governing the use of certain ingredients and labeling requirements impose compliance burdens on manufacturers. Concerns about the safety and potential side effects of certain sports supplements, particularly among new users, can hinder market penetration. Additionally, the high cost of premium sports nutrition products may limit accessibility for price-sensitive consumers, particularly in emerging markets.
Market Opportunities:
The sports nutrition ingredients market presents significant growth opportunities driven by technological innovations, demographic trends, and evolving consumer preferences. The integration of natural and plant-based ingredients, along with clean label formulations, aligns with the growing demand for health-conscious and environmentally friendly products. The increasing focus on personalized nutrition, supported by advancements in nutrigenomics and wearable technology, offers tailored sports nutrition solutions catering to individual needs and preferences. Strategic partnerships, investment in research and development, and the introduction of affordable, high-quality sports nutrition products are essential to capitalize on emerging opportunities and sustain market leadership in the dynamic sports nutrition landscape.
Key Questions Answered in the Report:
- What are the primary factors driving the growth of the sports nutrition ingredients market globally?
- Which ingredients and applications are driving sports nutrition adoption across different consumer segments?
- How are technological advancements reshaping the competitive landscape of the sports nutrition ingredients market?
- Who are the key players contributing to the sports nutrition ingredients market, and what strategies are they employing to maintain market relevance?
- What are the emerging trends and future prospects in the global sports nutrition ingredients market?
Competitive Intelligence and Business Strategy:
Leading players in the global sports nutrition ingredients market, including Glanbia Nutritionals, DSM, Kerry Group, and Ingredion Incorporated, focus on innovation, product differentiation, and strategic partnerships to gain a competitive edge. These companies invest in R&D to develop advanced sports nutrition solutions, including plant-based proteins, bioactive peptides, and functional carbohydrates, catering to diverse consumer needs and preferences. Collaborations with sports organizations, fitness influencers, and regulatory bodies facilitate market access and promote product acceptance. Moreover, emphasis on clinical research, evidence-based practice, and consumer education fosters market growth and enhances consumer trust in the rapidly evolving sports nutrition landscape.
Key Companies Profiled:
- Nestle S.A.
- Red Bull GmbH
- Ajinomoto Co., Inc.
- Keurig Dr. Pepper, Inc.
- Nutrabolt
- GlaxoSmithKline plc.
- Optimum Nutrition, Inc.
- Vitaco Health
- Uelzena Group
- Premier Nutrition Corporation
- INC Sports Nutrition
- Now Foods
- Biothrive Sciences
Sports Nutrition Ingredients Industry Research by Category
By Ingredient:
- Proteins
- Carbohydrates
- Vitamins and Minerals
By End Use:
- Sports and Energy Beverages
- Protein Powders
- Energy and Nutrition Bars
By Region:
- North America
- Latin America
- Europe
- South Asia & Pacific
- East Asia
- Middle East & Africa
Table of Contents
1. Executive Summary
- 1.1. Global Market Outlook
- 1.2. Demand Side Trends
- 1.3. Supply Side Trends
- 1.4. Technology Roadmap
- 1.5. Analysis and Recommendations
2. Market Overview
- 2.1. Market Coverage / Taxonomy
- 2.2. Market Definition / Scope / Limitations
3. Key Market Trends
- 3.1. Key Trends Impacting the Market
- 3.2. Product Innovation / Development Trends
4. Key Success Factors
- 4.1. Product Adoption / Usage Analysis
- 4.2. Product USPs / Features
- 4.3. Strategic Promotional Strategies
5. Global Sports Nutrition Ingredients Market - Pricing Analysis
- 5.1. Regional Pricing Trend Analysis, 2019-2023
- 5.2. Global Average Pricing Analysis Benchmark
6. Global Sports Nutrition Ingredients Market Demand (in Value US$ Mn ) Analysis 2019-2023 and Forecast, 2024-2033
- 6.1. Historical Market Value (US$ Mn ) Analysis, 2019-2023
- 6.2. Current and Future Market Value (US$ Mn ) Projections, 2024-2033
- 6.2.1. Y-o-Y Growth Trend Analysis
- 6.2.2. Absolute $ Opportunity Analysis
7. Market Background
- 7.1. Macro-Economic Factors
- 7.1.1. Global GDP Growth Outlook
- 7.1.2. Global Food & Beverage industry Overview
- 7.1.3. Global GDP and Infrastructure Investment
- 7.1.4. International Trade
- 7.1.5. Global Industry Outlook
- 7.2. Forecast Factors - Relevance & Impact
- 7.2.1. Top Companies Historical Growth
- 7.2.2. GDP Growth forecast
- 7.2.3. Manufacturing Industry forecast
- 7.2.4. Global Urbanization Growth Outlook
- 7.2.5. Business Climate
- 7.3. Global Food and Beverage Industry Overview
- 7.4. Global Dairy Industry Overview
- 7.5. Supply Chain & Value-Chain Analysis
- 7.5.1. Raw Material Suppliers
- 7.5.2. Product Manufacturers
- 7.5.3. Distribution Channel Industries
- 7.6. Policy Developments and Regulatory Scenario
- 7.6.1. The United States Food and Drug Administration (FDA)
- 7.6.2. Canadian Food Inspection Agency
- 7.6.3. European Food Safety Authority (EFSA)
- 7.6.4. The Food Safety and Standards Authority of India (FSSAI)
- 7.6.5. Ministry of Health, Labor and Welfare. (MHLW), Japan
- 7.6.6. National Health Commission (NHC), China
- 7.6.7. Food Standards Australia New Zealand (FSANZ)
- 7.7. Market Dynamics
- 7.7.1. Drivers
- 7.7.2. Restraints
- 7.7.3. Opportunity Analysis
- 7.8. Global Supply Demand Analysis
8. Global Sports Nutrition Ingredients Market Analysis 2019-2023 and Forecast 2024-2033, by Ingredient
- 8.1. Introduction / Key Findings
- 8.2. Historical Market Size (US$ Mn ) By Ingredient, 2019-2023
- 8.3. Current and Future Market Size (US$ Mn ) Analysis and Forecast By Ingredient, 2024-2033
- 8.3.1. Milk-Based
- 8.3.2. Soy-Based
- 8.3.3. Organic
- 8.3.4. Probiotic/Prebiotic
- 8.4. Market Attractiveness Analysis By Ingredient
9. Global Sports Nutrition Ingredients Market Analysis 2019-2023 and Forecast 2024-2033, By End Use
- 9.1. Introduction / Key Findings
- 9.2. Historical Market Size (US$ Mn ) Analysis By End Use, 2019-2023
- 9.3. Current and Future Market Size (US$ Mn ) Analysis and Forecast By End Use, 2024-2033
- 9.3.1. Oral administration
- 9.3.2. Enteral administration
- 9.3.3. Intravenous administration
- 9.4. Market Attractiveness Analysis By End Use
10. Global Sports Nutrition Ingredients Market Analysis 2019-2023 and Forecast 2024-2033, by Region
- 10.1. Introduction
- 10.2. Historical Market Size (US$ Mn ) Analysis By Region, 2019-2023
- 10.3. Current Market Size (US$ Mn ) Analysis and Forecast By Region, 2024-2033
- 10.3.1. North America
- 10.3.2. Latin America
- 10.3.3. Europe
- 10.3.4. South Asia and Pacific
- 10.3.5. East Asia
- 10.3.6. Middle East and Africa (MEA)
- 10.4. Market Attractiveness Analysis By Region
11. North America Sports Nutrition Ingredients Market Analysis 2019-2023 and Forecast 2024-2033
- 11.1. Introduction
- 11.2. Pricing Analysis
- 11.3. Historical Market Size (US$ Mn ) Trend Analysis By Market Taxonomy, 2019-2023
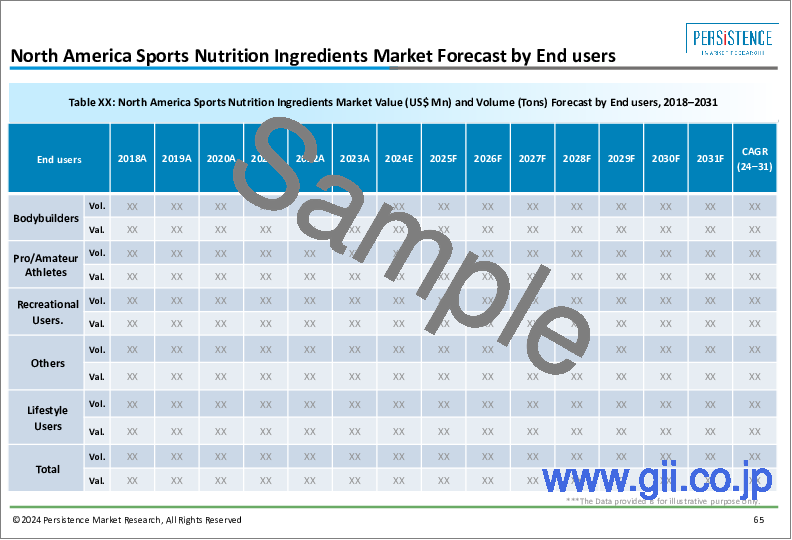
- 11.4. Market Size (US$ Mn ) Forecast By Market Taxonomy, 2024-2033
- 11.4.1. By Country
- 11.4.1.1. U.S.
- 11.4.1.2. Canada
- 11.4.2. By Ingredient
- 11.4.3. By End Use
- 11.4.1. By Country
- 11.5. Market Attractiveness Analysis
- 11.5.1. By Country
- 11.5.2. By Ingredient
- 11.5.3. By End Use
- 11.6. Market Trends
- 11.7. Key Market Participants - Intensity Mapping
- 11.8. Drivers and Restraints - Impact Analysis
12. Latin America Sports Nutrition Ingredients Market Analysis 2019-2023 and Forecast 2024-2033
- 12.1. Introduction
- 12.2. Pricing Analysis
- 12.3. Historical Market Size (US$ Mn ) Trend Analysis By Market Taxonomy, 2019-2023
- 12.4. Market Size (US$ Mn ) Forecast By Market Taxonomy, 2024-2033
- 12.4.1. By Country
- 12.4.1.1. Brazil
- 12.4.1.2. Mexico
- 12.4.1.3. Argentina
- 12.4.1.4. Rest of Latin America
- 12.4.2. By Ingredient
- 12.4.3. By End Use
- 12.4.1. By Country
- 12.5. Market Attractiveness Analysis
- 12.5.1. By Country
- 12.5.2. By Ingredient
- 12.5.3. By End Use
- 12.6. Market Trends
- 12.7. Key Market Participants - Intensity Mapping
- 12.8. Drivers and Restraints - Impact Analysis
13. Europe Sports Nutrition Ingredients Market Analysis 2019-2023 and Forecast 2024-2033
- 13.1. Introduction
- 13.2. Pricing Analysis
- 13.3. Historical Market Size (US$ Mn ) Trend Analysis By Market Taxonomy, 2019-2023
- 13.4. Market Size (US$ Mn ) Forecast By Market Taxonomy, 2024-2033
- 13.4.1. By Country
- 13.4.1.1. Germany
- 13.4.1.2. Italy
- 13.4.1.3. France
- 13.4.1.4. U.K.
- 13.4.1.5. Spain
- 13.4.1.6. BENELUX
- 13.4.1.7. Russia
- 13.4.1.8. Poland
- 13.4.1.9. Rest of Europe
- 13.4.2. By Ingredient
- 13.4.3. By End Use
- 13.4.1. By Country
- 13.5. Market Attractiveness Analysis
- 13.5.1. By Country
- 13.5.2. By Ingredient
- 13.5.3. By End Use
- 13.6. Market Trends
- 13.7. Key Market Participants - Intensity Mapping
- 13.8. Drivers and Restraints - Impact Analysis
14. South Asia and Pacific Sports Nutrition Ingredients Market Analysis 2019-2023 and Forecast 2024-2033
- 14.1. Introduction
- 14.2. Pricing Analysis
- 14.3. Historical Market Size (US$ Mn ) Trend Analysis By Market Taxonomy, 2019-2023
- 14.4. Market Size (US$ Mn ) Forecast By Market Taxonomy, 2024-2033
- 14.4.1. By Country
- 14.4.1.1. India
- 14.4.1.2. ASEAN
- 14.4.1.3. Oceania (Australia & New Zealand)
- 14.4.1.4. Rest of South Asia & Pacific
- 14.4.2. By Ingredient
- 14.4.3. By End Use
- 14.4.1. By Country
- 14.5. Market Attractiveness Analysis
- 14.5.1. By Country
- 14.5.2. By Ingredient
- 14.5.3. By End Use
- 14.6. Market Trends
- 14.7. Key Market Participants - Intensity Mapping
- 14.8. Drivers and Restraints - Impact Analysis
15. East Asia Sports Nutrition Ingredients Market Analysis 2019-2023 and Forecast 2024-2033
- 15.1. Introduction
- 15.2. Pricing Analysis
- 15.3. Historical Market Size (US$ Mn ) Trend Analysis By Market Taxonomy, 2019-2023
- 15.4. Market Size (US$ Mn ) Forecast By Market Taxonomy, 2024-2033
- 15.4.1. By Country
- 15.4.1.1. China
- 15.4.1.2. Japan
- 15.4.1.3. South Korea
- 15.4.2. By Ingredient
- 15.4.3. By End Use
- 15.4.1. By Country
- 15.5. Market Attractiveness Analysis
- 15.5.1. By Country
- 15.5.2. By Ingredient
- 15.5.3. By End Use
- 15.6. Market Trends
- 15.7. Key Market Participants - Intensity Mapping
- 15.8. Drivers and Restraints - Impact Analysis
16. Middle East and Africa Sports Nutrition Ingredients Market Analysis 2019-2023 and Forecast 2024-2033
- 16.1. Introduction
- 16.2. Pricing Analysis
- 16.3. Historical Market Size (US$ Mn ) Trend Analysis By Market Taxonomy, 2019-2023
- 16.4. Market Size (US$ Mn ) Forecast By Market Taxonomy, 2024-2033
- 16.4.1. By Country
- 16.4.1.1. GCC Countries
- 16.4.1.2. Turkey
- 16.4.1.3. Northern Africa
- 16.4.1.4. South Africa
- 16.4.1.5. Rest of Middle East and Africa
- 16.4.2. By Ingredient
- 16.4.3. By End Use
- 16.4.1. By Country
- 16.5. Market Attractiveness Analysis
- 16.5.1. By Country
- 16.5.2. By Ingredient
- 16.5.3. By End Use
- 16.6. Market Trends
- 16.7. Key Market Participants - Intensity Mapping
- 16.8. Drivers and Restraints - Impact Analysis
17. Country Wise Sports Nutrition Ingredients Market Analysis, 2023
- 17.1. Introduction
- 17.1.1. Market Value Proportion Analysis, By Key Countries
- 17.1.2. Global Vs. Country Growth Comparison
- 17.2. U.S. Sports Nutrition Ingredients Market Analysis
- 17.2.1. By Ingredient
- 17.2.2. By End Use
- 17.3. Canada Sports Nutrition Ingredients Market Analysis
- 17.3.1. By Ingredient
- 17.3.2. By End Use
- 17.4. Mexico Sports Nutrition Ingredients Market Analysis
- 17.4.1. By Ingredient
- 17.4.2. By End Use
- 17.5. Brazil Sports Nutrition Ingredients Market Analysis
- 17.5.1. By Ingredient
- 17.5.2. By End Use
- 17.6. Argentina Sports Nutrition Ingredients Market Analysis
- 17.6.1. By Ingredient
- 17.6.2. By End Use
- 17.7. Germany Sports Nutrition Ingredients Market Analysis
- 17.7.1. By Ingredient
- 17.7.2. By End Use
- 17.8. Italy Sports Nutrition Ingredients Market Analysis
- 17.8.1. By Ingredient
- 17.8.2. By End Use
- 17.9. France Sports Nutrition Ingredients Market Analysis
- 17.9.1. By Ingredient
- 17.9.2. By End Use
- 17.10. U.K. Sports Nutrition Ingredients Market Analysis
- 17.10.1. By Ingredient
- 17.10.2. By End Use
- 17.11. Spain Sports Nutrition Ingredients Market Analysis
- 17.11.1. By Ingredient
- 17.11.2. By End Use
- 17.12. Poland Sports Nutrition Ingredients Market Analysis
- 17.12.1. By Ingredient
- 17.12.2. By End Use
- 17.13. Russia Sports Nutrition Ingredients Market Analysis
- 17.13.1. By Ingredient
- 17.13.2. By End Use
- 17.14. China Sports Nutrition Ingredients Market Analysis
- 17.14.1. By Ingredient
- 17.14.2. By End Use
- 17.15. Japan Sports Nutrition Ingredients Market Analysis
- 17.15.1. By Ingredient
- 17.15.2. By End Use
- 17.16. S. Korea Sports Nutrition Ingredients Market Analysis
- 17.16.1. By Ingredient
- 17.16.2. By End Use
- 17.17. India Sports Nutrition Ingredients Market Analysis
- 17.17.1. By Ingredient
- 17.17.2. By End Use
- 17.18. Oceania (Australia and New Zealand) Sports Nutrition Ingredients Market Analysis
- 17.18.1. By Ingredient
- 17.18.2. By End Use
- 17.19. Turkey Sports Nutrition Ingredients Market Analysis
- 17.19.1. By Ingredient
- 17.19.2. By End Use
- 17.20. South Africa Sports Nutrition Ingredients Market Analysis
- 17.20.1. By Ingredient
- 17.20.2. By End Use
18. Market Structure Analysis
- 18.1. Market Analysis by Tier of Companies (Sports Nutrition Ingredients)
- 18.2. Market Share Analysis of Top Players
- 18.3. Market Presence Analysis
19. Competition Analysis
- 19.1. Competition Dashboard
- 19.2. Competition Benchmarking
- 19.3. Competition Deep Dive
- 19.3.1. Nestle S.A.
- 19.3.1.1. Overview
- 19.3.1.2. Product Portfolio
- 19.3.1.3. Profitability by Market Segments (Product/Channel/Region)
- 19.3.1.4. Sales Footprint
- 19.3.1.5. Strategy Overview
- 19.3.2. Red Bull GmbH
- 19.3.2.1. Overview
- 19.3.2.2. Product Portfolio
- 19.3.2.3. Profitability by Market Segments (Product/Channel/Region)
- 19.3.2.4. Sales Footprint
- 19.3.2.5. Strategy Overview
- 19.3.3. Ajinomoto Co., Inc.
- 19.3.3.1. Overview
- 19.3.3.2. Product Portfolio
- 19.3.3.3. Profitability by Market Segments (Product/Channel/Region)
- 19.3.3.4. Sales Footprint
- 19.3.3.5. Strategy Overview
- 19.3.4. Keurig Dr. Pepper, Inc.
- 19.3.4.1. Overview
- 19.3.4.2. Product Portfolio
- 19.3.4.3. Profitability by Market Segments (Product/Channel/Region)
- 19.3.4.4. Sales Footprint
- 19.3.4.5. Strategy Overview
- 19.3.5. Nutrabolt
- 19.3.5.1. Overview
- 19.3.5.2. Product Portfolio
- 19.3.5.3. Profitability by Market Segments (Product/Channel/Region)
- 19.3.5.4. Sales Footprint
- 19.3.5.5. Strategy Overview
- 19.3.6. GlaxoSmithKline plc.
- 19.3.6.1. Overview
- 19.3.6.2. Product Portfolio
- 19.3.6.3. Profitability by Market Segments (Product/Channel/Region)
- 19.3.6.4. Sales Footprint
- 19.3.6.5. Strategy Overview
- 19.3.7. Optimum Nutrition, Inc.
- 19.3.7.1. Overview
- 19.3.7.2. Product Portfolio
- 19.3.7.3. Profitability by Market Segments (Product/Channel/Region)
- 19.3.7.4. Sales Footprint
- 19.3.7.5. Strategy Overview
- 19.3.8. Vitaco Health
- 19.3.8.1. Overview
- 19.3.8.2. Product Portfolio
- 19.3.8.3. Profitability by Market Segments (Product/Channel/Region)
- 19.3.8.4. Sales Footprint
- 19.3.8.5. Strategy Overview
- 19.3.9. Uelzena Group
- 19.3.9.1. Overview
- 19.3.9.2. Product Portfolio
- 19.3.9.3. Profitability by Market Segments (Product/Channel/Region)
- 19.3.9.4. Sales Footprint
- 19.3.9.5. Strategy Overview
- 19.3.10. Premier Nutrition Corporation
- 19.3.10.1. Overview
- 19.3.10.2. Product Portfolio
- 19.3.10.3. Profitability by Market Segments (Product/Channel/Region)
- 19.3.10.4. Sales Footprint
- 19.3.10.5. Strategy Overview
- 19.3.11. INC Sports Nutrition
- 19.3.11.1. Overview
- 19.3.11.2. Product Portfolio
- 19.3.11.3. Profitability by Market Segments (Product/Channel/Region)
- 19.3.11.4. Sales Footprint
- 19.3.11.5. Strategy Overview
- 19.3.12. Now Foods
- 19.3.12.1. Overview
- 19.3.12.2. Product Portfolio
- 19.3.12.3. Profitability by Market Segments (Product/Channel/Region)
- 19.3.12.4. Sales Footprint
- 19.3.12.5. Strategy Overview
- 19.3.13. Biothrive SciencesOthers ( on Additional Request)
- 19.3.13.1. Overview
- 19.3.13.2. Product Portfolio
- 19.3.13.3. Profitability by Market Segments (Product/Channel/Region)
- 19.3.13.4. Sales Footprint
- 19.3.13.5. Strategy Overview
- 19.3.1. Nestle S.A.

