|
|
市場調査レポート
商品コード
1525471
電気自動車部品の世界市場の評価:自動車タイプ別、部品タイプ別、流通チャネル別、地域別、機会、予測(2017年~2031年)Electric Vehicle Component Market Assessment, By Vehicle Type, By Component Type, By Distribution Channel, By Region, Opportunities and Forecast, 2017-2031F |
||||||
|
|||||||
カスタマイズ可能
|
|||||||

| 電気自動車部品の世界市場の評価:自動車タイプ別、部品タイプ別、流通チャネル別、地域別、機会、予測(2017年~2031年) |
|
出版日: 2024年08月02日
発行: Markets & Data
ページ情報: 英文 224 Pages
納期: 3~5営業日
|

全表示
- 概要
- 図表
- 目次
世界の電気自動車部品の市場規模は、2023年の1,549億米ドルから2031年に7,647億米ドルに達すると予測され、2024年~2031年の予測期間にCAGRで22.09%の成長が見込まれます。市場は近年成長を示しており、電気自動車の生産の増加、電気自動車充電プラットフォームの進歩、ゼロカーボンエミッションに関する意識の高まり、充電ステーションを増やすための政府による投資の急増などにより、今後数年間も力強い拡大ペースを維持すると推定されます。電気自動車の売上の増加と電気自動車の急速充電インフラの進歩は、予測期間における世界の電気自動車部品市場の需要を大きく促進しています。国の経済成長は、電気自動車充電部品の市場シェア拡大によって推進されており、これは電気自動車の普及に大きく起因しています。この動向はコスト効率や、騒音公害の低減、ゼロエミッションなどの環境上の利点によって促進されています。電気自動車部品市場の成長は、予測期間に大幅な伸びを示しています。
加えて、新技術の進歩に向けた各地域からの政府の資金提供と部品研究の増加が、世界の電気自動車部品の市場規模を促進しています。さらに、先進技術を利用した効率的な新しい充電ステーションを建設してインフラを強化する取り組みが、予測期間におけるEV充電部品市場の拡大を支えています。自動車産業の自動車メーカーは、電気自動車の需要の増加に対応するため、他国から部品を調達すると予測されます。
例えば2023年11月、Tesla, Inc.は、インドからの19億米ドル相当の部品の輸入を倍増すると発表しました。Commerce and Industry Minister of Indiaによれば、電気自動車の需要の増加は部品の成長を後押しします。
市場需要を促進する電気自動車への投資と生産の増加
電気自動車の生産が増加しているのは、電気自動車がもたらす大きな恩恵と、顧客からの電気自動車に対する需要の高まりによるものです。電気自動車から排出される炭素が少ないため、環境保護が強化され、公害が抑制されるなどのさまざまな恩恵が、予測期間における世界市場の成長を後押ししています。また、消費者からの要求が加速しているため、市場に投入されるさまざまな新しい部品や技術を用いた研究開発活動が活発化していることも、世界の電気自動車部品市場の需要の急増に寄与しています。さらに、充電プラットフォームの増加に伴う電気自動車充電インフラ開発への投資の増加が、予測期間における電気自動車充電部品の成長率を支えています。新興国の政府は、地域の製造エコシステムに機会を創出するため、電気自動車向け部品セグメントへの投資を計画しています。
例えば2024年4月、Investment Information and Credit Rating Agencyは、インドの自動車部品部門、特にEV部品への投資の増加を予測しました。今後3~4年間で30億米ドルが投資され、現地化が進み、EV生産が強化され、製造上の課題に対処できるようになると予測されます。
EV用バッテリー製造施設の設立が市場成長を促進
電気自動車市場では、リチウムイオンバッテリーにさまざまな革新と進歩が見られ、市場各社はこれに対し、自社の製品範囲とフットプリントを拡大するために機能しています。各社は、先進の電気バスや乗用車の開発に特化したEV用バッテリーを幅広く提供しています。また、主要参入企業は、EV用バッテリーを含む電気自動車部品のさまざまなイノベーションと研究開発に重点的に取り組んでいます。さらに、電気自動車に対する消費者の関心の高まりは、世界の電気自動車部品の市場シェアを独占する多くの機会を生み出しています。
例えば、Panasonic Corporationは2022年3月、電気自動車向けの革新的な「4680」リチウムバッテリーを生産するため、西日本の和歌山工場に生産施設を設立すると発表しました。この設立は、EVの世界中での急速な普及に寄与し、世界中で事業を拡大することに主眼を置いています。
当レポートでは、世界の電気自動車部品市場について調査分析し、市場規模と予測、市場力学、主要企業の情勢と見通しなどを提供しています。
目次
第1章 調査手法
第2章 プロジェクトの範囲と定義
第3章 エグゼクティブサマリー
第4章 顧客の声
- 製品と市場情報
- ブランド認知の方式
- 購入決定において考慮される要素
- プライバシーと安全規制の考慮
第5章 世界の電気自動車部品市場の見通し(2017年~2031年)
- 市場規模と予測
- 金額
- 数量
- 車両タイプ別
- バッテリー電気自動車(BEV)
- ハイブリッド電気自動車(HEV)
- プラグインハイブリッド電気自動車(PHEV)
- 燃料電池電気自動車(FCEV)
- コンポーネントタイプ別
- トラクションバッテリーパック
- パワーインバーター
- コントローラー
- その他
- 流通チャネル別
- OEM
- アフターマーケット
- 地域別
- 北米
- 欧州
- アジア太平洋
- 南米
- 中東・アフリカ
- 市場シェア:企業別(2023年)
第6章 世界の電気自動車部品市場の見通し:地域別(2017年~2031年)
- 北米
- 市場規模と予測
- 車両タイプ別
- コンポーネントタイプ別
- 流通チャネル別
- 米国
- カナダ
- メキシコ
- 欧州
- ドイツ
- フランス
- イタリア
- 英国
- ロシア
- オランダ
- スペイン
- トルコ
- ポーランド
- アジア太平洋
- インド
- 中国
- 日本
- オーストラリア
- ベトナム
- 韓国
- インドネシア
- フィリピン
- 南米
- ブラジル
- アルゼンチン
- 中東・アフリカ
- サウジアラビア
- アラブ首長国連邦
- 南アフリカ
第7章 市場マッピング(2023年)
- 車両タイプ別
- コンポーネントタイプ別
- 流通チャネル別
- 地域別
第8章 マクロ環境と産業構造
- 需給分析
- 輸入輸出分析
- バリューチェーン分析
- PESTEL分析
- ポーターのファイブフォース分析
第9章 市場力学
- 成長促進要因
- 成長抑制要因(課題、抑制要因)
第10章 主要企業の情勢
- マーケットリーダー上位5社の競合マトリクス
- マーケットリーダー上位5社の市場収益の分析(2023年)
- 合併と買収/合弁事業(該当する場合)
- SWOT分析(市場企業5社)
- 特許分析(該当する場合)
第11章 価格分析
第12章 ケーススタディ
第13章 主要企業の見通し
- General Motors
- Hyundai Motor Company
- Volkswagen AG
- Build your Dreams Busses Mexico, S. de R.L. de C.V.
- BMW AG
- Ford Motor Company
- Mercedes-Benz AG
- Rivian Netherlands B.V.
- Toyota Kirloskar Motor Private Limited
- Renault Group
- Mahindra & Mahindra Limited
第14章 戦略的推奨
第15章 当社について、免責事項
List of Tables
- Table 1. Pricing Analysis of Products from Key Players
- Table 2. Competition Matrix of Top 5 Market Leaders
- Table 3. Mergers & Acquisitions/ Joint Ventures (If Applicable)
- Table 4. About Us - Regions and Countries Where We Have Executed Client Projects
List of Figures
- Figure 1. Global Electric Vehicle Component Market, By Value, in USD Billion, 2017-2031F
- Figure 2. Global Electric Vehicle Component Market, By Volume, in Units, 2017-2031F
- Figure 3. Global Electric Vehicle Component Market Share (%), By Vehicle Type, 2017-2031F
- Figure 4. Global Electric Vehicle Component Market Share (%), By Component Type, 2017-2031F
- Figure 5. Global Electric Vehicle Component Market Share (%), By Distribution Channel, 2017-2031F
- Figure 6. Global Electric Vehicle Component Market Share (%), By Region, 2017-2031F
- Figure 7. North America Electric Vehicle Component Market, By Value, in USD Billion, 2017-2031F
- Figure 8. North America Electric Vehicle Component Market, By Volume, in Units, 2017-2031F
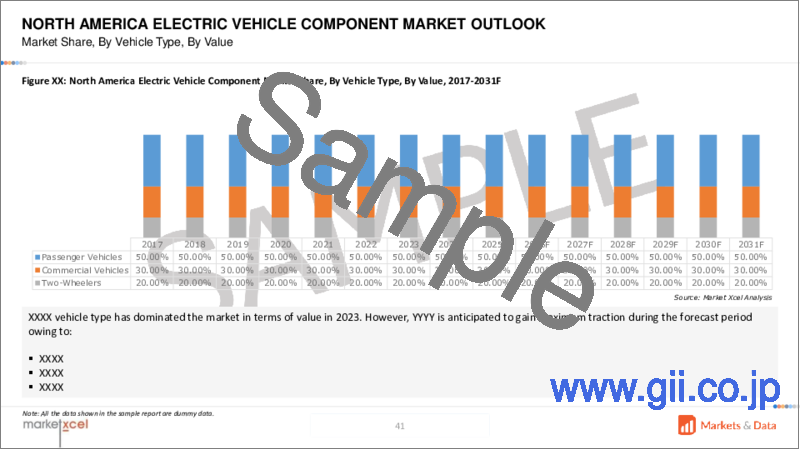
- Figure 9. North America Electric Vehicle Component Market Share (%), By Vehicle Type, 2017-2031F
- Figure 10. North America Electric Vehicle Component Market Share (%), By Component Type, 2017-2031F
- Figure 11. North America Electric Vehicle Component Market Share (%), By Distribution Channel, 2017-2031F
- Figure 12. North America Electric Vehicle Component Market Share (%), By Country, 2017-2031F
- Figure 13. United States Electric Vehicle Component Market, By Value, in USD Billion, 2017-2031F
- Figure 14. United States Electric Vehicle Component Market, By Volume, in Units, 2017-2031F
- Figure 15. United States Electric Vehicle Component Market Share (%), By Vehicle Type, 2017-2031F
- Figure 16. United States Electric Vehicle Component Market Share (%), By Component Type, 2017-2031F
- Figure 17. United States Electric Vehicle Component Market Share (%), By Distribution Channel, 2017-2031F
- Figure 18. Canada Electric Vehicle Component Market, By Value, in USD Billion, 2017-2031F
- Figure 19. Canada Electric Vehicle Component Market, By Volume, in Units, 2017-2031F
- Figure 20. Canada Electric Vehicle Component Market Share (%), By Vehicle Type, 2017-2031F
- Figure 21. Canada Electric Vehicle Component Market Share (%), By Component Type, 2017-2031F
- Figure 22. Canada Electric Vehicle Component Market Share (%), By Distribution Channel, 2017-2031F
- Figure 23. Mexico Electric Vehicle Component Market, By Value, in USD Billion, 2017-2031F
- Figure 24. Mexico Electric Vehicle Component Market, By Volume, in Units, 2017-2031F
- Figure 25. Mexico Electric Vehicle Component Market Share (%), By Vehicle Type, 2017-2031F
- Figure 26. Mexico Electric Vehicle Component Market Share (%), By Component Type, 2017-2031F
- Figure 27. Mexico Electric Vehicle Component Market Share (%), By Distribution Channel, 2017-2031F
- Figure 28. Europe Electric Vehicle Component Market, By Value, in USD Billion, 2017-2031F
- Figure 29. Europe Electric Vehicle Component Market, By Volume, in Units, 2017-2031F
- Figure 30. Europe Electric Vehicle Component Market Share (%), By Vehicle Type, 2017-2031F
- Figure 31. Europe Electric Vehicle Component Market Share (%), By Component Type, 2017-2031F
- Figure 32. Europe Electric Vehicle Component Market Share (%), By Distribution Channel, 2017-2031F
- Figure 33. Europe Electric Vehicle Component Market Share (%), By Country, 2017-2031F
- Figure 34. Germany Electric Vehicle Component Market, By Value, in USD Billion, 2017-2031F
- Figure 35. Germany Electric Vehicle Component Market, By Volume, in Units, 2017-2031F
- Figure 36. Germany Electric Vehicle Component Market Share (%), By Vehicle Type, 2017-2031F
- Figure 37. Germany Electric Vehicle Component Market Share (%), By Component Type, 2017-2031F
- Figure 38. Germany Electric Vehicle Component Market Share (%), By Distribution Channel, 2017-2031F
- Figure 39. France Electric Vehicle Component Market, By Value, in USD Billion, 2017-2031F
- Figure 40. France Electric Vehicle Component Market, By Volume, in Units, 2017-2031F
- Figure 41. France Electric Vehicle Component Market Share (%), By Vehicle Type, 2017-2031F
- Figure 42. France Electric Vehicle Component Market Share (%), By Component Type, 2017-2031F
- Figure 43. France Electric Vehicle Component Market Share (%), By Distribution Channel, 2017-2031F
- Figure 44. Italy Electric Vehicle Component Market, By Value, in USD Billion, 2017-2031F
- Figure 45. Italy Electric Vehicle Component Market, By Volume, in Units, 2017-2031F
- Figure 46. Italy Electric Vehicle Component Market Share (%), By Vehicle Type, 2017-2031F
- Figure 47. Italy Electric Vehicle Component Market Share (%), By Component Type, 2017-2031F
- Figure 48. Italy Electric Vehicle Component Market Share (%), By Distribution Channel, 2017-2031F
- Figure 49. United Kingdom Electric Vehicle Component Market, By Value, in USD Billion, 2017-2031F
- Figure 50. United Kingdom Electric Vehicle Component Market, By Volume, in Units, 2017-2031F
- Figure 51. United Kingdom Electric Vehicle Component Market Share (%), By Vehicle Type, 2017-2031F
- Figure 52. United Kingdom Electric Vehicle Component Market Share (%), By Component Type, 2017-2031F
- Figure 53. United Kingdom Electric Vehicle Component Market Share (%), By Distribution Channel, 2017-2031F
- Figure 54. Russia Electric Vehicle Component Market, By Value, in USD Billion, 2017-2031F
- Figure 55. Russia Electric Vehicle Component Market, By Volume, in Units, 2017-2031F
- Figure 56. Russia Electric Vehicle Component Market Share (%), By Vehicle Type, 2017-2031F
- Figure 57. Russia Electric Vehicle Component Market Share (%), By Component Type, 2017-2031F
- Figure 58. Russia Electric Vehicle Component Market Share (%), By Distribution Channel, 2017-2031F
- Figure 59. Netherlands Electric Vehicle Component Market, By Value, in USD Billion, 2017-2031F
- Figure 60. Netherlands Electric Vehicle Component Market, By Volume, in Units, 2017-2031F
- Figure 61. Netherlands Electric Vehicle Component Market Share (%), By Vehicle Type, 2017-2031F
- Figure 62. Netherlands Electric Vehicle Component Market Share (%), By Component Type, 2017-2031F
- Figure 63. Netherlands Electric Vehicle Component Market Share (%), By Distribution Channel, 2017-2031F
- Figure 64. Spain Electric Vehicle Component Market, By Value, in USD Billion, 2017-2031F
- Figure 65. Spain Electric Vehicle Component Market, By Volume, in Units, 2017-2031F
- Figure 66. Spain Electric Vehicle Component Market Share (%), By Vehicle Type, 2017-2031F
- Figure 67. Spain Electric Vehicle Component Market Share (%), By Component Type, 2017-2031F
- Figure 68. Spain Electric Vehicle Component Market Share (%), By Distribution Channel, 2017-2031F
- Figure 69. Turkey Electric Vehicle Component Market, By Value, in USD Billion, 2017-2031F
- Figure 70. Turkey Electric Vehicle Component Market, By Volume, in Units, 2017-2031F
- Figure 71. Turkey Electric Vehicle Component Market Share (%), By Vehicle Type, 2017-2031F
- Figure 72. Turkey Electric Vehicle Component Market Share (%), By Component Type, 2017-2031F
- Figure 73. Turkey Electric Vehicle Component Market Share (%), By Distribution Channel, 2017-2031F
- Figure 74. Poland Electric Vehicle Component Market, By Value, in USD Billion, 2017-2031F
- Figure 75. Poland Electric Vehicle Component Market, By Volume, in Units, 2017-2031F
- Figure 76. Poland Electric Vehicle Component Market Share (%), By Vehicle Type, 2017-2031F
- Figure 77. Poland Electric Vehicle Component Market Share (%), By Component Type, 2017-2031F
- Figure 78. Poland Electric Vehicle Component Market Share (%), By Distribution Channel, 2017-2031F
- Figure 79. South America Electric Vehicle Component Market, By Value, in USD Billion, 2017-2031F
- Figure 80. South America Electric Vehicle Component Market, By Volume, in Units, 2017-2031F
- Figure 81. South America Electric Vehicle Component Market Share (%), By Vehicle Type, 2017-2031F
- Figure 82. South America Electric Vehicle Component Market Share (%), By Component Type, 2017-2031F
- Figure 83. South America Electric Vehicle Component Market Share (%), By Distribution Channel, 2017-2031F
- Figure 84. South America Electric Vehicle Component Market Share (%), By Country, 2017-2031F
- Figure 85. Brazil Electric Vehicle Component Market, By Value, in USD Billion, 2017-2031F
- Figure 86. Brazil Electric Vehicle Component Market, By Volume, in Units, 2017-2031F
- Figure 87. Brazil Electric Vehicle Component Market Share (%), By Vehicle Type, 2017-2031F
- Figure 88. Brazil Electric Vehicle Component Market Share (%), By Component Type, 2017-2031F
- Figure 89. Brazil Electric Vehicle Component Market Share (%), By Distribution Channel, 2017-2031F
- Figure 90. Argentina Electric Vehicle Component Market, By Value, in USD Billion, 2017-2031F
- Figure 91. Argentina Electric Vehicle Component Market, By Volume, in Units, 2017-2031F
- Figure 92. Argentina Electric Vehicle Component Market Share (%), By Vehicle Type, 2017-2031F
- Figure 93. Argentina Electric Vehicle Component Market Share (%), By Component Type, 2017-2031F
- Figure 94. Argentina Electric Vehicle Component Market Share (%), By Distribution Channel, 2017-2031F
- Figure 95. Asia-Pacific Electric Vehicle Component Market, By Value, in USD Billion, 2017-2031F
- Figure 96. Asia-Pacific Electric Vehicle Component Market, By Volume, in Units, 2017-2031F
- Figure 97. Asia-Pacific Electric Vehicle Component Market Share (%), By Vehicle Type, 2017-2031F
- Figure 98. Asia-Pacific Electric Vehicle Component Market Share (%), By Component Type, 2017-2031F
- Figure 99. Asia-Pacific Electric Vehicle Component Market Share (%), By Distribution Channel, 2017-2031F
- Figure 100. Asia-Pacific Electric Vehicle Component Market Share (%), By Country, 2017-2031F
- Figure 101. India Electric Vehicle Component Market, By Value, in USD Billion, 2017-2031F
- Figure 102. India Electric Vehicle Component Market, By Volume, in Units, 2017-2031F
- Figure 103. India Electric Vehicle Component Market Share (%), By Vehicle Type, 2017-2031F
- Figure 104. India Electric Vehicle Component Market Share (%), By Component Type, 2017-2031F
- Figure 105. India Electric Vehicle Component Market Share (%), By Distribution Channel, 2017-2031F
- Figure 106. China Electric Vehicle Component Market, By Value, in USD Billion, 2017-2031F
- Figure 107. China Electric Vehicle Component Market, By Volume, in Units, 2017-2031F
- Figure 108. China Electric Vehicle Component Market Share (%), By Vehicle Type, 2017-2031F
- Figure 109. China Electric Vehicle Component Market Share (%), By Component Type, 2017-2031F
- Figure 110. China Electric Vehicle Component Market Share (%), By Distribution Channel, 2017-2031F
- Figure 111. Japan Electric Vehicle Component Market, By Value, in USD Billion, 2017-2031F
- Figure 112. Japan Electric Vehicle Component Market, By Volume, in Units, 2017-2031F
- Figure 113. Japan Electric Vehicle Component Market Share (%), By Vehicle Type, 2017-2031F
- Figure 114. Japan Electric Vehicle Component Market Share (%), By Component Type, 2017-2031F
- Figure 115. Japan Electric Vehicle Component Market Share (%), By Distribution Channel, 2017-2031F
- Figure 116. Australia Electric Vehicle Component Market, By Value, in USD Billion, 2017-2031F
- Figure 117. Australia Electric Vehicle Component Market, By Volume, in Units, 2017-2031F
- Figure 118. Australia Electric Vehicle Component Market Share (%), By Vehicle Type, 2017-2031F
- Figure 119. Australia Electric Vehicle Component Market Share (%), By Component Type, 2017-2031F
- Figure 120. Australia Electric Vehicle Component Market Share (%), By Distribution Channel, 2017-2031F
- Figure 121. Vietnam Electric Vehicle Component Market, By Value, in USD Billion, 2017-2031F
- Figure 122. Vietnam Electric Vehicle Component Market, By Volume, in Units, 2017-2031F
- Figure 123. Vietnam Electric Vehicle Component Market Share (%), By Vehicle Type, 2017-2031F
- Figure 124. Vietnam Electric Vehicle Component Market Share (%), By Component Type, 2017-2031F
- Figure 125. Vietnam Electric Vehicle Component Market Share (%), By Distribution Channel, 2017-2031F
- Figure 126. South Korea Electric Vehicle Component Market, By Value, in USD Billion, 2017-2031F
- Figure 127. South Korea Electric Vehicle Component Market, By Volume, in Units, 2017-2031F
- Figure 128. South Korea Electric Vehicle Component Market Share (%), By Vehicle Type, 2017-2031F
- Figure 129. South Korea Electric Vehicle Component Market Share (%), By Component Type, 2017-2031F
- Figure 130. South Korea Electric Vehicle Component Market Share (%), By Distribution Channel, 2017-2031F
- Figure 131. Indonesia Electric Vehicle Component Market, By Value, in USD Billion, 2017-2031F
- Figure 132. Indonesia Electric Vehicle Component Market, By Volume, in Units, 2017-2031F
- Figure 133. Indonesia Electric Vehicle Component Market Share (%), By Vehicle Type, 2017-2031F
- Figure 134. Indonesia Electric Vehicle Component Market Share (%), By Component Type, 2017-2031F
- Figure 135. Indonesia Electric Vehicle Component Market Share (%), By Distribution Channel, 2017-2031F
- Figure 136. Philippines Electric Vehicle Component Market, By Value, in USD Billion, 2017-2031F
- Figure 137. Philippines Electric Vehicle Component Market, By Volume, in Units, 2017-2031F
- Figure 138. Philippines Electric Vehicle Component Market Share (%), By Vehicle Type, 2017-2031F
- Figure 139. Philippines Electric Vehicle Component Market Share (%), By Component Type, 2017-2031F
- Figure 140. Philippines Electric Vehicle Component Market Share (%), By Distribution Channel, 2017-2031F
- Figure 141. Middle East & Africa Electric Vehicle Component Market, By Value, in USD Billion, 2017-2031F
- Figure 142. Middle East & Africa Electric Vehicle Component Market, By Volume, in Units, 2017-2031F
- Figure 143. Middle East & Africa Electric Vehicle Component Market Share (%), By Vehicle Type, 2017-2031F
- Figure 144. Middle East & Africa Electric Vehicle Component Market Share (%), By Component Type, 2017-2031F
- Figure 145. Middle East & Africa Electric Vehicle Component Market Share (%), By Distribution Channel, 2017-2031F
- Figure 146. Middle East & Africa Electric Vehicle Component Market Share (%), By Country, 2017-2031F
- Figure 147. Saudi Arabia Electric Vehicle Component Market, By Value, in USD Billion, 2017-2031F
- Figure 148. Saudi Arabia Electric Vehicle Component Market, By Volume, in Units, 2017-2031F
- Figure 149. Saudi Arabia Electric Vehicle Component Market Share (%), By Vehicle Type, 2017-2031F
- Figure 150. Saudi Arabia Electric Vehicle Component Market Share (%), By Component Type, 2017-2031F
- Figure 151. Saudi Arabia Electric Vehicle Component Market Share (%), By Distribution Channel, 2017-2031F
- Figure 152. UAE Electric Vehicle Component Market, By Value, in USD Billion, 2017-2031F
- Figure 153. UAE Electric Vehicle Component Market, By Volume, in Units, 2017-2031F
- Figure 154. UAE Electric Vehicle Component Market Share (%), By Vehicle Type, 2017-2031F
- Figure 155. UAE Electric Vehicle Component Market Share (%), By Component Type, 2017-2031F
- Figure 156. UAE Electric Vehicle Component Market Share (%), By Distribution Channel, 2017-2031F
- Figure 157. South Africa Electric Vehicle Component Market, By Value, in USD Billion, 2017-2031F
- Figure 158. South Africa Electric Vehicle Component Market, By Volume, in Units, 2017-2031F
- Figure 159. South Africa Electric Vehicle Component Market Share (%), By Vehicle Type, 2017-2031F
- Figure 160. South Africa Electric Vehicle Component Market Share (%), By Component Type, 2017-2031F
- Figure 161. South Africa Electric Vehicle Component Market Share (%), By Distribution Channel, 2017-2031F
- Figure 162. By Vehicle Type Map-Market Size (USD Billion) & Growth Rate (%), 2023
- Figure 163. By Component Type Map-Market Size (USD Billion) & Growth Rate (%), 2023
- Figure 164. By Distribution Channel Map-Market Size (USD Billion) & Growth Rate (%), 2023
- Figure 165. By Region Map-Market Size (USD Billion) & Growth Rate (%), 2023
Global electric vehicle components market is estimated to witness a CAGR of 22.09% during the forecast period 2024-2031, growing from USD 154.90 billion in 2023 to USD 764.70 billion in 2031. The market has experienced growth in recent years and is estimated to maintain a strong pace of expansion in the coming years due to an increase in the production of electric vehicles, advancement in the electric vehicle charging platform, rising awareness concerning zero carbon emission, and surging investment by government to increase number of a charging station. The rising sales of electric vehicles and advancement in the fast-charging infrastructure of electric cars is driving the global electric vehicle components market demand to a larger extent in the forecast period. The country's economic growth, propelled by a growing market share in electric vehicle charging components, is highly owing to the increasing prevalence of electric vehicles. The trend is fostered by their cost-effectiveness and environmental advantages, including reduced noise pollution, and zero emissions. The electric vehicle components market growth has witnessed a significant rise in the forecast period.
In addition, government funding from different regions for new technology advancement and increased research into components foster the global electric vehicle components market size. Furthermore, initiatives to enhance infrastructure by building new, technologically advanced, and more efficient charging stations support the expansion of the EV charging component market in the forecast period. Automakers in the automotive industry are projected to source components from other countries to address the rising demand for electric vehicles.
For instance, in November 2023, Tesla, Inc. announced to double its imports of components worth USD 1.9 billion from India. The increase in demand for EVs will help foster the growth of components according to the Commerce and Industry Minister of India.
Increase in Investment and Production of Electric Vehicles to Foster Market Demand
The production of electric vehicles is rising due to the significant benefits of electric vehicles and the growing demand from customers for EVs. Different benefits including increased environmental protection and controlled pollution owing to less carbon emission from electric vehicles propel the global market growth in the forecast period. Also, a rise in different research and development activities with different new components and technologies launched in the market, owing to accelerated requirements from the consumer has aided to surge in the global electric vehicle component market demand. Moreover, the increasing investment in the development of EV charging infrastructure with a growing number of charging platforms has supported the growth rate of electric vehicle charging components in the forecast period. Governments of emerging countries are planning to invest in the component segment for electric vehicles to create opportunities for the local manufacturing ecosystem.
For instance, in April 2024, the Investment Information and Credit Rating Agency forecasted an increase in investment in India's auto component sector, especially for EV parts. Over the next 3-4 years the investment of USD 3 billion are expected to allow advancements in localization, enhance EV production, and address manufacturing challenges.
Establishment of Manufacturing Facilities for EV Batteries Propel the Market Growth
In the electric vehicle market, there are different innovations and advancements in lithium-ion batteries functioned by the market players to expand their product range and footprint. Companies are offering a wide range of batteries for EVs that are specifically dedicated to the development of advanced electric buses and passenger cars. Also, key participants are majorly focused on different innovations and research and development into electric vehicle components including EV batteries. Moreover, the growing interest of consumers in electric vehicles has created a number of opportunities for dominating the global electric vehicle components market share. From start-up entrepreneurs compelled by government initiatives to giant companies investing a heavy amount in establishing a manufacturing facility for the production of batteries to expand their business across the globe.
For instance, in March 2022, Panasonic Corporation announced to establish a production facility at Wakayama Factory across western Japan to produce innovative '4680' lithium batteries for electric vehicles. The setup is majorly focused on contributing to the rapid adoption of EVs globally and expanding its business across the globe.
Government Investments, Incentives, and Regulations Propel the Global Market Growth
Government policies significantly propel the growth of the electric vehicle market. Different countries are enacting regulations focused on decreasing carbon emissions and motivating the usage and adoption of electric vehicles which further fosters the global electric vehicle components market demand. Financial investments and incentives comprising rebates, tax credits, and exemptions, are compelled to make EVs more fascinating to purchasers. In addition, mandates that compel vehicle manufacturers to manufacture a precise quantity and quality of electric vehicles propel the advancement and increase of demand for electric vehicle components. Furthermore, governments of different countries are significantly investing in electric mobility projects, introducing opportunities for electric vehicle component manufacturers. By providing incentives to consumers and automakers to adopt and produce electric vehicles respectively, governments are propelling the shift. Thereby, the growing requirement for electric vehicles is projected to drive the sales of components including batteries, motors, power inverters, and others.
For instance, in November 2022, the U.S. Energy Department announced a preliminary approval for approximately USD 710 million in loans to electric vehicle technology manufacturing ventures. SK Siltron CSS, a South Korea-based company, is projected to receive USD 544 million to expand a plant across Bay City, Michigan to produce high-power silicon carbide wafers integrated in EVs.
Traction Battery Pack Dominates the Largest Global Electric Vehicle Components Market Share
Traction battery pack dominate the market growth due to the increase in requirement and production of electric vehicles. A traction battery pack is an essential component in an electric vehicle as it is an electrical energy storage system in the form of direct-current electricity and is used to drive the motor. Therefore, an increase in demand for electric vehicles is projected to foster the demand for traction battery pack segment growth. In the global market for electric vehicle components, there is a range of electric car batteries whereas lithium-ion batteries are most widely used in EVs. Key participants in the market are significantly planning to invest in batteries of electric vehicles to offer better driving experience and vehicle safety.
For instance, in January 2024, Altmin Private Ltd. announced an investment of USD 100 million in lithium-ion batteries in India over the next five years to represent a noteworthy advancement in the value chain for electric vehicles in India.
Asia-Pacific Registers the Largest Global Electric Vehicle Components Market Size
Asia-Pacific registers the largest market size in the global market due to emerging countries witnessing increased technological developments, rising integration of components in electric vehicles, surge in manufacturing and production of electric vehicles, and growing customer requirements concerning electric vehicles. In addition, the government of different countries in Asia-Pacific is increasing their funding in different research and development activities with technological advancement in components coupled with increased infrastructure development, which is projected to market expansion to a greater extent in the forecast period. Furthermore, it is projected that China will be a leading player in the global electric vehicle market as there is a significant increase in demand for passenger cars and economic development. Also, companies in the region have been planning to invest to decrease carbon emissions and encourage the adoption of electric vehicle components.
For instance, in May 2024, Mitsubishi Electric Corporation announced a joint venture with Japanese components and systems producer, Aisin Corporation, for electric and hybrid vehicle components and aims to use the scale as an advantage in an increasingly competitive market.
Future Market Scenario (2024 - 2031F)
Increase in production of electric vehicles, and government policies including FAME and FAME II policies, is expected to propel the global electric vehicle components market growth.
Governments of emerging nations are offering monetary incentives for the advancement of innovative technologies coupled with investment in different research and development activities, accelerating the global electric vehicle components market demand.
Collaboration between companies to introduce new and advanced electrical components, boosting the market growth in the forecast period.
Establishment of new manufacturing facilities in emerging countries propel the production and sales of electric vehicle components.
Key Players Landscape and Outlook
Key participants in the electric vehicle components are significantly investing in different research and development activities to expand their portfolio and develop hybrid and electric vehicles. The automakers in emerging countries are taking and investing in advancement practices to offer cost-effective cars. In addition, companies are efficiently adopting different market growth strategies including new product launches, partnerships, collaborations, mergers and acquisitions, and others to expand product portfolios, and gain a competitive edge.
In May 2022, Mahindra & Mahindra Limited announced to strengthen its electric vehicle portfolio and explore partnerships for sourcing more components from other companies.
Table of Contents
1. Research Methodology
2. Project Scope and Definitions
3. Executive Summary
4. Voice of Customer
- 4.1. Product and Market Intelligence
- 4.2. Mode of Brand Awareness
- 4.3. Factors Considered in Purchase Decisions
- 4.3.1. Features and other value-added service
- 4.3.2. Compatibility and Reliability
- 4.3.3. Efficiency of Solutions
- 4.3.4. After-Sales Support
- 4.4. Consideration of Privacy and Safety Regulations
5. Global Electric Vehicle Component Market Outlook, 2017-2031F
- 5.1. Market Size & Forecast
- 5.1.1. By Value
- 5.1.2. By Volume
- 5.2. By Vehicle Type
- 5.2.1. Battery Electric Vehicle (BEV)
- 5.2.2. Hybrid Electric Vehicle (HEV)
- 5.2.3. Plug-In Hybrid Electric Vehicle (PHEV)
- 5.2.4. Fuel Cell Electric Vehicle (FCEV)
- 5.3. By Component Type
- 5.3.1. Traction Battery Pack
- 5.3.2. Power Inverter
- 5.3.3. Controller
- 5.3.4. Others
- 5.4. By Distribution Channel
- 5.4.1. Original Equipment Manufacturer (OEM)
- 5.4.2. Aftermarket
- 5.5. By Region
- 5.5.1. North America
- 5.5.2. Europe
- 5.5.3. Asia-Pacific
- 5.5.4. South America
- 5.5.5. Middle East and Africa
- 5.6. By Company Market Share (%), 2023
6. Global Electric Vehicle Component Market Outlook, By Region, 2017-2031F
- 6.1. North America*
- 6.1.1. Market Size & Forecast
- 6.1.1.1. By Value
- 6.1.1.2. By Volume
- 6.1.2. By Vehicle Type
- 6.1.2.1. Battery Electric Vehicle (BEV)
- 6.1.2.2. Hybrid Electric Vehicle (HEV)
- 6.1.2.3. Plug-In Hybrid Electric Vehicle (PHEV)
- 6.1.2.4. Fuel Cell Electric Vehicle (FCEV)
- 6.1.3. By Component Type
- 6.1.3.1. Traction Battery Pack
- 6.1.3.2. Power Inverter
- 6.1.3.3. Controller
- 6.1.3.4. Others
- 6.1.4. By Distribution Channel
- 6.1.4.1. Original Equipment Manufacturer (OEM)
- 6.1.4.2. Aftermarket
- 6.1.5. United States*
- 6.1.5.1. Market Size & Forecast
- 6.1.5.1.1. By Value
- 6.1.5.1.2. By Volume
- 6.1.5.2. By Vehicle Type
- 6.1.5.2.1. Battery Electric Vehicle (BEV)
- 6.1.5.2.2. Hybrid Electric Vehicle (HEV)
- 6.1.5.2.3. Plug-In Hybrid Electric Vehicle (PHEV),
- 6.1.5.2.4. Fuel Cell Electric Vehicle (FCEV)
- 6.1.5.3. By Component Type
- 6.1.5.3.1. Traction Battery Pack
- 6.1.5.3.2. Power Inverter
- 6.1.5.3.3. Controller
- 6.1.5.3.4. Others
- 6.1.5.4. By Distribution Channel
- 6.1.5.4.1. Original Equipment Manufacturer (OEM)
- 6.1.5.4.2. Aftermarket
- 6.1.5.1. Market Size & Forecast
- 6.1.6. Canada
- 6.1.7. Mexico
- 6.1.1. Market Size & Forecast
All segments will be provided for all regions and countries covered
- 6.2. Europe
- 6.2.1. Germany
- 6.2.2. France
- 6.2.3. Italy
- 6.2.4. United Kingdom
- 6.2.5. Russia
- 6.2.6. Netherlands
- 6.2.7. Spain
- 6.2.8. Turkey
- 6.2.9. Poland
- 6.3. Asia-Pacific
- 6.3.1. India
- 6.3.2. China
- 6.3.3. Japan
- 6.3.4. Australia
- 6.3.5. Vietnam
- 6.3.6. South Korea
- 6.3.7. Indonesia
- 6.3.8. Philippines
- 6.4. South America
- 6.4.1. Brazil
- 6.4.2. Argentina
- 6.5. Middle East and Africa
- 6.5.1. Saudi Arabia
- 6.5.2. UAE
- 6.5.3. South Africa
7. Market Mapping, 2023
- 7.1. By Vehicle Type
- 7.2. By Component Type
- 7.3. By Distribution Channel
- 7.4. By Region
8. Macro Environment and Industry Structure
- 8.1. Demand Supply Analysis
- 8.2. Import Export Analysis
- 8.3. Value Chain Analysis
- 8.4. PESTEL Analysis
- 8.4.1. Political Factors
- 8.4.2. Economic System
- 8.4.3. Social Implications
- 8.4.4. Technological Advancements
- 8.4.5. Environmental Impacts
- 8.4.6. Legal Compliances and Regulatory Policies (Statutory Bodies Included)
- 8.5. Porter's Five Forces Analysis
- 8.5.1. Supplier Power
- 8.5.2. Buyer Power
- 8.5.3. Substitution Threat
- 8.5.4. Threat from New Entrant
- 8.5.5. Competitive Rivalry
9. Market Dynamics
- 9.1. Growth Drivers
- 9.2. Growth Inhibitors (Challenges and Restraints)
10. Key Players Landscape
- 10.1. Competition Matrix of Top Five Market Leaders
- 10.2. Market Revenue Analysis of Top Five Market Leaders (By Value, 2023)
- 10.3. Mergers and Acquisitions/Joint Ventures (If Applicable)
- 10.4. SWOT Analysis (For Five Market Players)
- 10.5. Patent Analysis (If Applicable)
11. Pricing Analysis
12. Case Studies
13. Key Players Outlook
- 13.1. General Motors
- 13.1.1. Company Details
- 13.1.2. Key Management Personnel
- 13.1.3. Products and Services
- 13.1.4. Financials (As Reported)
- 13.1.5. Key Market Focus and Geographical Presence
- 13.1.6. Recent Developments
- 13.2. Hyundai Motor Company
- 13.3. Volkswagen AG
- 13.4. Build your Dreams Busses Mexico, S. de R.L. de C.V.
- 13.5. BMW AG
- 13.6. Ford Motor Company
- 13.7. Mercedes-Benz AG
- 13.8. Rivian Netherlands B.V.
- 13.9. Toyota Kirloskar Motor Private Limited
- 13.10. Renault Group
- 13.11. Mahindra & Mahindra Limited
Companies mentioned above DO NOT hold any order as per market share and can be changed as per information available during research work.
