|
|
市場調査レポート
商品コード
1481476
キャリアニュートラルネットワークオペレーター (CNNO) - 市場レビュー (2023年第4四半期):2023年は収益5%増、設備投資8%増、M&Aは有機的成長が引き継がれる中で小刻みに減速・PE企業は業界再編を継続、生成AIの盛り上がりは拡大Carrier-Neutral Network Operators - 4Q23 Market Review: Revenues up 5%, Capex up 8%, in 2023, M&A Slows to Trickle as Organic Growth Takes Over, PE Firms Continue to Reshape Sector and GenAI Hype Builds |
||||||
|
|
|||||||


| キャリアニュートラルネットワークオペレーター (CNNO) - 市場レビュー (2023年第4四半期):2023年は収益5%増、設備投資8%増、M&Aは有機的成長が引き継がれる中で小刻みに減速・PE企業は業界再編を継続、生成AIの盛り上がりは拡大 |
|
出版日: 2024年05月17日
発行: MTN Consulting, LLC
ページ情報: 英文
納期: 即納可能
|
- 全表示
- 概要
- 図表
- 目次
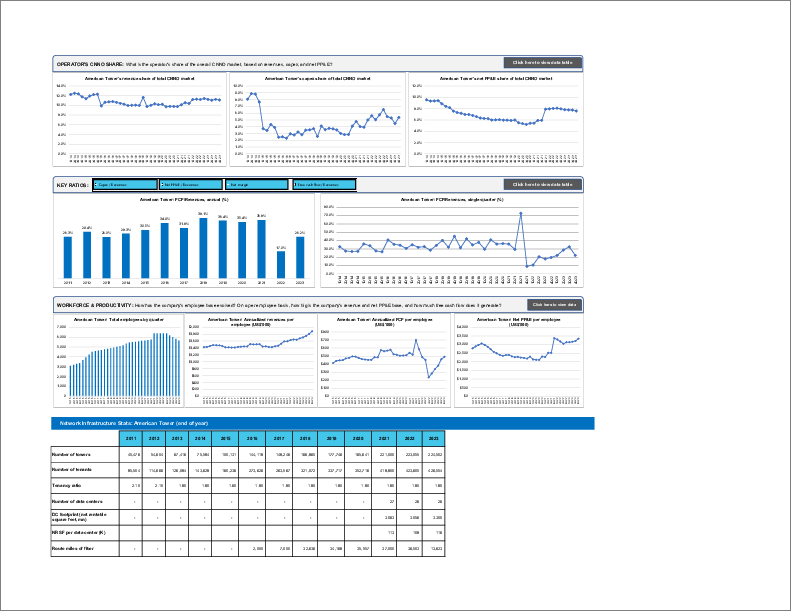
当レポートでは、キャリアニュートラルネットワークオペレーター (CNNO) 市場の成長と発展をレビューし、世界の47社のCNNOについて、2011年第1四半期から2023年第4四半期までの幅広い財務統計を追跡調査しています。
2023年通年では、対象企業の収益は997億米ドル (前年比5.1%増) 、設備投資は348億米ドル (同7.8%増) でした。2023年末時点で、これらのCNNOは、2,611億米ドルの純PP&E (前年比3.9%増) を保有し、約11万3,000人 (前年比2.1%増) を雇用しています。
ビジュアル
レポートハイライト:
- 収益:2011年には200億米ドル以下だったCNNO部門の収益は、2023年には997億米ドルに達します。この5.1%の成長は、昨年のウェブスケール部門の6.2%の成長より少し遅い程度で、2023年に通信事業者が経験した1%の収益減少をはるかに上回ります。2023年の収益上位5社のCNNOは、China Tower (CTC) 、American Tower (ATC)、Equinix、Level 3、Crown Castleです。CTCはセルタワー、Equinixはデータセンター、Level 3はファイバー/帯域幅です。しかし、ATCはセルタワー、データセンター、ファイバーにまたがり、Crown Castleはセルタワーとファイバーの両方を保有しています。両者とも、CNNO部門におけるインフラ収束の動向をよく表しており、個々の企業体は、より完全な「プラットフォーム」の資産を所有することで相乗効果を求めています。
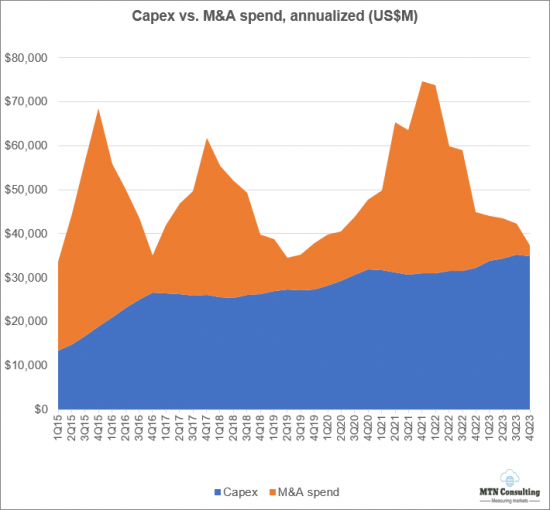
- 市場は10年間で5倍以上に成長し、その展望は劇的に拡大しました。もっとも重要なことは、通信事業者が資産をスピンオフして多くのCNNOを設立または拡大したことです。例えば、China Towerは2015年に中国政府が同国の3つの国有通信事業者のタワー保有を統合したことで市場に参入しました。規模はだいぶ小さいですが、米国を拠点とするUniti Groupは、2015年に通信事業者であるWindstreamがパッシブネットワークインフラの大半をスピンアウトして設立されました。CNNO部門を成長させるため、過去10年の間にこのようなスピンオフが多く行われました。2011年以降のM&A総額は2,280億米ドルで、同期間の設備投資額2,910億米ドルをさほど下回っていません。
- 設備投資:2011年に60億米ドルだったCNNOの設備投資は、2023年には348億米ドルになります。これは通信事業者とウェブスケーラーの設備投資がそれぞれ4%と5%減少した2022年の合計から8%近く増加しています。CTCの設備投資額がもっとも高く、Digital Realty、Equinix、Cellnex、NBN Australiaが続いています。
- 収益性:CNNO部門の2023年の平均純利益率は2.9%で、2022年の-0.2%から上昇しましたが、2021年の+6.8%からは低下しました。フリーキャッシュフローマージンも4.9%で、2021年の10.4%、2022年の11.5%の半分以下でした。金利上昇はいくつかの要因のひとつでした。CNNOの貸借対照表には、2023年時点で2,430億米ドル近い負債があり、現金と投資はわずか1,900億米ドル強でした。旺盛な需要動向のなかでも、CNNOのなかには多額の負債を抱えているため、経営の合理化を図っているところもあります。
- 従業員CNNOの2023年の従業員数は約11万3,000人でした。CNNOはインフラの効率的な運用を目指し、人件費を下げるために可能な限り自動化を進めています。しかし、ほとんどのCNNOはM&Aを行うため、規模とシナジーのメリットを享受する前に、資産の統合と合理化が必要になることが多いです。労働力の調整が行われるため、多少の遅れが生じることもあります。従業員一人当たりの収益でみると、CNNO部門は2023年に89万米ドルを超え、2022年の87万米ドルから若干増加します。2023年のウェブスケールの58万4,000米ドル、電話会社の39万2,000米ドルと比較すると、その差は歴然としています。
対象範囲
本レビューには以下の企業が含まれています:
|
|
目次
- 1.レポートハイライト
- 2.CNNOセグメントの概要
- 3.分析
- 4.運用指標
- 5.主要統計
- 6.セグメント別ドリルダウン分析
- 7.企業別ドリルダウン分析
- 8.企業ベンチマーキング
- 9.生データ
- 10.為替レート
- 11.当社について
List of Figures and Charts
- 1. Revenues by CNNO type (US$M)
- 2. Revenues single-quarter (US$M)
- 3. CNNO Profitability, annualized (%)
- 4. Capex & M&A spending, single-quarter (US$M)
- 5. Net PP&E by CNNO type (US$M)
- 6. Number of data centers & NRSF per data center (K)
- 7. Bandwidth fiber route miles, Global
- 8. CNNO towers & average tenancy ratio
- 9. Average size of data center, owned vs. leased: Equinix (000s of sq ft)
- 10. Average number of cabinets installed, owned vs. leased: 21ViaNet
- 11. TOP CNNOs (2023): # OF DATACENTERS
- 12. TOP CNNOs (2023): NET RENTABLE SQUARE FEET (NRSF) (MN)
- 13. TOP CNNOs (2023): NRSF PER DATA CENTER (K)
- 14. TOP CNNOs (2023): # OF TOWERS
- 15. TOP CNNOs (2023): NUMBER OF TENANTS
- 16. TOP CNNOs (2023): AVG TENANCY PER OCCUPIED TOWER
- 17. TOP CNNOs (2023): ROUTE MILES OF FIBER
Below charts by total CNNO market, CNNO sub-segments, and by companies:
- 1. Revenues: annual, single-quarter, and annualized (US$M)
- 2. Profitability (Net Profit; Cash from operations; Free cash flow): annual, single-quarter, and annualized (US$M)
- 3. Spending (M&A; Capex): annual, single-quarter, and annualized (US$M)
- 4. Cash & Short-term Investments: annual and single-quarter (US$M)
- 5. Debt (Total debt; Net debt): annual and single-quarter (US$M)
- 6. Property, Plant & Equipment: annual and single-quarter (US$M)
- 7. Key Ratios: Net margin; Capex/revenues; M&A/revenues; Free cash flow/revenues
- 8. Total employees
- 9. Revenue per employee, annualized (US$K)
- 10. FCF per employee, annualized (US$K)
- 11. Net PP&E per employee, annualized (US$K)
Company benchmarking charts:
- 1. 2011 vs. 2023: company benchmark by KPI (Revenues, Net profit, Cash from operations, Capex, Free cash flow, Cash & short-term investments, Net PP&E, Total debt)
- 2. 2011 vs. 2023: company benchmark by key ratio (Capex/revenues; Net margin; FCF margin)
- 3. Top 5 CNNOs by sub-segment: by KPI (Revenues, Net profit, Cash from operations, Capex, Free cash flow, Cash & short-term investments, Net PP&E, Total debt)
- 4. Top 5 CNNOs by sub-segment by Key ratio: Capex/revenues; Net margin; FCF margin
- 5. Top CNNOs by infrastructure type (2023):
- # of towers
- Avg tenancy per occupied tower
- Number of Tenants
- Route miles of fiber
- # of datacenters
- Net rentable square feet (NRSF) (Mn)
This report reviews the growth and development of the carrier-neutral network operator (CNNO) market. The report tracks a wide range of financial stats for 47 CNNOs across the globe, from 1Q11 through 4Q23. For the full-year 2023, the companies covered by this study represented $99.7 billion (B) in revenues (+5.1% YoY), and $34.8 B in capex (+7.8% YoY). At the end of 2023 (EOY23), these CNNOs had $261.1B of net plant, property and equipment (net PP&E) on the books (+3.9% YoY), and employed approximately 113,000 people (+2.1% YoY).
VISUALS
The CNNO market is the smallest of three operator segments tracked by MTN Consulting on a quarterly basis, alongside telco & webscale, but CNNOs play a crucial, complementary role in the communications sector and own and operate a large portion of the world's cell towers, data centers, and fiber networks. In the old days, telcos did it all: they owned all the network infrastructure, they manufactured the switches and transmission gear deployed in the network, and even provided CPE. That model is long since extinct. The telco of 2024 cobbles together its physical network from a mix of owned and leased or rented resources. Cloud providers in the webscale world do the same; while they spend heavily on capex ($192B last year), they generally lease fiber or transmission bandwidth, and only own a portion of their data centers. CNNOs do serve other end markets, including various enterprise verticals (finance, media, and energy), and government. But telcos and webscalers are the biggest targets. CNNOs play a vital role in the network design and cost structure of these operators.
In addition to demand from the telco & webscale markets, other factors driving the development of the CNNO sector over the last decade include: low interest rates (in the past) enabling debt-financed expansion (M&A and capex); the tax advantages of the real estate investment trust (REIT) operating model; and, the growth of the asset pool managed by private equity, a key source of funding for CNNOs. Private equity is the single largest force driving the CNNO market today. Recent developments include: Blackrock acquired Global Infra Partners (1/24); Blackstone partnered with Digital Realty on a $7B hyperscale JV (12/23); Brookfield bought Cyxtera (11/23) and the Indian tower assets of American Tower (1/24); EQT acquired EdgeConneX (1/24); KKR purchased TIM's fiber network NetCo for $24B (1/24). More broadly, a number of large PE firms are creating portofolios of "digital infrastructure" assets, and buying up or funding new CNNOs. They're attempting to create synergies across their digital investees, sometimes through mergers, and synergies with other parts of their investment portfolio. With the rise of GenAI, for instance, some PE firms are investing directly in energy supply in order to ensure competitive rates and terms for the data center players in their portoflio.
Below are some highlights from the report:
- Revenues: from under $20B in 2011, the CNNO sector recorded revenues of $99.7B in 2023. This 5.1% growth is only a bit slower than the 6.2% growth of the webscale sector last year, and far ahead of the 1% revenue decline experienced by telcos in 2023. The largest 5 CNNOs by revenues in 2023 were China Tower (CTC), American Tower (ATC), Equinix, Level 3, and Crown Castle. Three of these are almost entirely focused on one type of infrastructure: cell towers for CTC, data centers for Equinix, and fiber/bandwidth for Level 3. However, ATC has substantial holdings across cell towers, data centers, and fiber, while Crown Castle has both cell towers and fiber. Both are good representations of the trend towards infrastructure convergence in the CNNO sector, where individual corporate entities seek out synergies from owning a more complete "platform" of assets. Many private equity firms are also attempting to create a virtual "platform" through holdings across different portfolio companies, but it's not clear that this can be truly accomplished without a single corporate entity, ideally with public reporting requirements.
- To grow over five-fold in a decade, the scope of the market has expanded dramatically: most importantly, telcos have spun off assets to create or enlarge many CNNOs. For instance China Tower entered the market in 2015 when the Chinese government merged the tower holdings of that country's three state-owned telcos. On a far smaller scale, US-based Uniti Group was created in 2015 when Windstream, a telco, spun out most of its passive network infrastructure holdings. Many other such spinoffs were accomplished over the last decade in order to grow the CNNO sector. This is why the CNNO sector spends so heavily on M&A: since 2011, M&A spending has totaled $228B, not much less than the $291B capex spend for the same period.
- Capex: from ~$6B in 2011, CNNO capex was $34.8B in 2023. That is up nearly 8% from the 2022 total, in a year when capex for telcos and webscalers fell 4% and 5%, respectively. CTC reported the highest capex, followed by Digital Realty, Equinix, Cellnex, and NBN Australia. A major reason for CNNO's healthy capex last year was widespread enthusiasm for generative AI, and an investor view that CNNO data centers can ride this enthusiasm to faster growth as long as they invest now, in a big way. To speed development, the two largest data center-focused CNNOs are both using creative financing vehicles to build hyperscale-class facilities for the big cloud providers. In December 2023, for instance, Digital Realty announced a $7B JV with Blackstone, to build 4 hyperscale campuses across three metro areas on two continents, supporting an IT load of up to 500MW, or the equivalent power needs of over 300K households.
- Profitability: average net margin for the CNNO sector was 2.9% in 2023, up from -0.2% in 2022 but down from the +6.8% of 2021. Free cash flow margin also disappointed in 2023, amounting to 4.9%, less than half of the 10.4% and 11.5% recorded in 2021-22 respectively. Rising interest rates were one of several factors. CNNOs had nearly $243B of debt on the balance sheets at EOY23, and just over $19B in cash & investments. Even with strong demand trends, some CNNOs are attempting to streamline operations in order to cope with their heavy debt load. American Tower, for instance, sold off its Indian operations for $2.5B in Jan. 2024, to Brookfield.
- Employees: CNNOs ended 2023 with about 113K employees, from 110.7K at EOY2022. CNNOs aim for efficiency in the operation of their infrastructure, and use automation when possible to lower labor costs. However, most CNNOs engage in M&A and hence often need to integrate & rationalize assets before they can reap the scale & synergy benefits. There can be some delay as adjustments to the workforce are made. On a revenue per employee basis, the CNNO sector is impressive, at over $890K per employee in 2023, up slightly from $870K in 2022. This compares to $584K for webscale in 2023, and just $392K for the telco market.
COVERAGE:
The following companies are included in this Market Review:
|
|
Table of Contents
- 1. Report Highlights
- 2. CNNO Segment Overview
- 3. Analysis
- 4. Operating Metrics
- 5. Key Stats
- 6. Segment Drilldown
- 7. Company Drilldown
- 8. Company Benchmarking
- 9. Raw Data
- 10. Exchange Rates
- 11. About