
|
市場調査レポート
商品コード
1440110
サーモン:市場シェア分析、業界動向と統計、成長予測(2024-2029)Salmon - Market Share Analysis, Industry Trends & Statistics, Growth Forecasts (2024 - 2029) |
||||||
カスタマイズ可能
適宜更新あり
|
|||||||
| サーモン:市場シェア分析、業界動向と統計、成長予測(2024-2029) |
|
出版日: 2024年02月15日
発行: Mordor Intelligence
ページ情報: 英文 110 Pages
納期: 2~3営業日
|

全表示
- 概要
- 目次
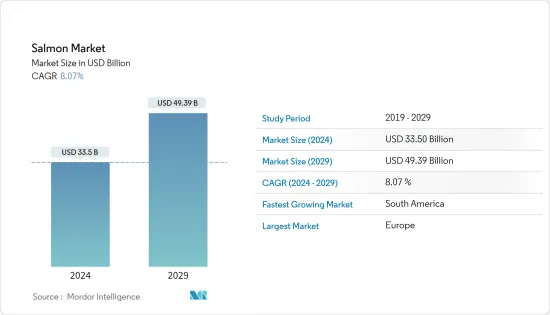
サーモン市場規模は2024年に335億米ドルと推定され、2029年までに493億9,000万米ドルに達すると予測されており、予測期間(2024年から2029年)中に8.07%のCAGRで成長します。
世界のサーモン業界は、生産、加工、物流といったサプライチェーン全体にわたってCOVID-19症の影響を感じています。ノルウェーでは、第1四半期の価格が1キロあたり70ノルウェークローネを超えて非常に高かったため、生産者はここ数年の好調な価格の恩恵を受けており、この部門はかなり回復力のあるものとなっています。チリでは、検疫、夜間外出禁止令、その他のCOVID-19制限により、加工工場に届くサケ科の魚の量が減少しています。
生物学的制約、海水温度要件、その他の自然制約により、養殖サーモンは主にノルウェー、チリ、英国、北米、フェロー諸島、アイスランド、アイルランド、ニュージーランド、タスマニアの海で生産されています。 2020年には、260万トン以上の養殖サケノイドが生産されました。対照的に、野生のサケ科のサケ類はわずか約55万トンしか捕獲されておらず、養殖サケは世界のサケ生産量全体のほぼ74%を占めています。アトランティックサーモンは、世界中で最も一般的に養殖されているサケの一種です。養殖アトランティックサーモンの総生産量は2018年に240万トンでしたが、2020年までに274万トンに増加しました。
養殖アトランティックサーモンは生産量が多かったので、2019年上半期にノルウェーとチリの両国で価格が急落しました。その後、この価格下落傾向は急激に反転し、主に過去最高値に近い水準まで価格が高騰しました。-伝統的市場および中国などの新興市場での需要の強化。
サーモン市場の動向
サーモンの生産量を健全に増やす
養殖サーモンの世界生産量は2020年に268万トンでピークに達し、チリの水産養殖部門の業績はここ数年で徐々に改善しています。その結果、サーモン養殖、特にタイセイヨウサケ養殖が増加し、世界のサケ生産量のほぼ74%を占めています。生産増加の大部分はチリで観察されており、2018年から2019年にかけて約14%であり、新しい規制制度が成果を上げています。同様に、世界最大の生産国であるノルウェーでも、冬の寒さと魚の健康問題により、サケの漁獲量はわずか5%増加しました。
さらに、供給量の増加は世界のサーモン需要を満たすことができません。世界的にサーモンの需要が高まり続ける中、伝統的な放網囲い養殖における地理的制約と規制上の制約により、生産者の対応能力が制限されています。しかし、中国市場におけるサケ生産への投資の増加は、陸地および沖合での養殖や遺伝子組み換えサケなどの技術的アプローチと相まって、生産量をさらに加速する潜在的な機会の一部となっています。
ノルウェーが魚の健康に取り組む中、チリがサーモン市場をリード
養殖サーモンの世界の供給量の増加は、チリがアオコの大量死に関する制約を乗り越え、収益性を維持していることに牽引されています。 2020年、チリでは100万トン以上のサーモンが漁獲され、チリの貿易団体サーモンチリによると、2007年以来同国の最高生産量となった。養殖サーモンの生産では、家畜に比べて使用する水の量が13分の1、二酸化炭素排出量が10分の1になります。
業界は2019年にマネタリーベイ水族館と2050年までに抗生物質の使用を25%削減することで合意に達しました。2020年、業界は抗生物質の使用率を収穫バイオマス1トンあたり621グラムから298グラムに引き下げました。 2016年に記録された1トン当たりの重量は、2019年の349グラム/MTから14.6%減少しました。
同じ期間、欧州、特にスコットランドでは比較的低い生産増加率が観察されました。過去2年間、ノルウェーの生産量も規制上の制約とフナムシの問題により比較的遅いペースで増加しています。 2020年のノルウェーにおけるサケ科魚類の総漁獲量は146万トンに達し、2019年と比較して3.5%増加しました。
ノルウェーのサーモン産業は、サケの餌の重要な植物成分である大豆のサプライチェーンの大胆な変化を推し進めることに成功しました。ノルウェーのサーモン養殖産業にブラジルの大豆を供給するすべての企業は、2020年を期限として100%森林破壊と無転換の大豆バリューチェーンを導入することに同意しました。
養殖アトランティックサーモンの生産は好調で、2019年前半にはノルウェーとチリの両国で価格が急落しました。その後、この価格下落傾向は急反転し、価格は記録的な高値近くまで高騰しましたが、その主な原因は、中国などの既存市場および新興市場における需要の絶え間ない強化にあります。
サーモン産業の概要
その他の特典
- エクセル形式の市場予測(ME)シート
- 3か月のアナリストサポート
目次
第1章 イントロダクション
- 調査の成果
- 調査の前提条件と調査範囲
第2章 調査手法
第3章 エグゼクティブサマリー
第4章 市場力学
- 市場概要
- 市場促進要因
- 市場抑制要因
- サプライチェーン分析
第5章 市場セグメンテーション
- 種属タイプ
- アトランティックサーモン
- ギンザケ
- マスサーモン
- チヌークサーモン
- その他の種属タイプ
- タイプ
- 養殖
- 野生捕獲
- 地域
- 北米
- 米国
- カナダ
- 欧州
- ノルウェー
- スペイン
- オランダ
- フランス
- イタリア
- ギリシャ
- 英国
- スコットランド
- アジア太平洋
- 中国
- 日本
- オーストラリア
- 南米
- チリ
- 北米
第6章 市場機会と将来の動向
第7章 COVID-19の影響の評価
The Salmon Market size is estimated at USD 33.5 billion in 2024, and is expected to reach USD 49.39 billion by 2029, growing at a CAGR of 8.07% during the forecast period (2024-2029).
The global salmon sector has felt the impact of COVID-19 all along the supply chain, with production, processing, and logistics. In Norway, prices were very high in Q1, at over NOK 70 per kilo, and producers have benefitted from several strong years of prices, making the sector fairly resilient. In Chile, quarantines, curfews, and other COVID-19 restrictions have led to lower volumes of salmonids reaching processing plants.
Due to biological constraints, seawater temperature requirements, and other natural constraints, farmed salmon is mainly produced in the sea in Norway, Chile, the United Kingdom, North America, the Faroe Islands, Iceland, Ireland, New Zealand, and Tasmania. In 2020, more than 2.6 million tons of farmed salmonoids were produced. In comparison, only around 550,000 tons of wild salmonids were caught, with farmed salmon capturing nearly 74% of the overall salmon production in the world. Atlantic salmon is one of the most commonly cultured species of salmon across the world. The overall production of farmed Atlantic salmon was marked at 2.4 million metric ton in 2018, which increased to 2.74 million metric ton by 2020.
Good production of farmed Atlantic salmon had experienced a steep decline in the prices in both Norway and Chile in the first half of 2019. Subsequently, this declining price trend was sharply reversed, and prices soared to near-record heights, primarily attributed to the ever-strengthening demand in traditional and emerging markets such as China.
Salmon Market Trends
Healthy Boost in the Salmon Production
The global production of farmed salmon peaked at 2.68 million metric tons in 2020, with Chile's aquaculture sector performance gradually improving over the past few years. This has resulted in increased salmon culture, especially Atlantic salmon culture, which is garnering nearly 74% of the salmon production in the world. The bulk of production increase is observed in Chile, at around 14% from 2018 to 2019, where a new regulatory regime is producing results. Similarly, in Norway, the world's largest producing country, a cold winter and fish health issues translated into a modest 5% increase in salmon harvests.
Moreover, the growth in supply is unable to satiate the salmon demand globally. As demand for salmon continues to strengthen globally, a combination of geographic and regulatory constraints on traditional open net-pen farming has limited the ability of producers to keep pace. However, increasing investments in the salmon production in the Chinese market, coupled with the technological approaches such as land and off-shore based culture and genetically engineered salmon, are some of the potential opportunities for pacing up the production further.
Chile leads the Salmon Market as Norway Grapple with Fish Health
The global supply growth of farmed salmon is led by Chile surpassing the constraints pertaining to the mass algal bloom mortalities, thereby maintaining its profitability. In 2020, more than one million metric ton of salmon were harvested in Chile, the country's highest value produced since 2007 as per Chilean trade body SalmonChile. Farmed salmon production uses 13 times less water, and its carbon footprint is ten times less than that of livestock.
The industry reached an agreement with Monetary Bay Aquarium in 2019 to reduce the use of antibiotics by 25% by 2050. In 2020, the industry lowered its antibiotic use rate to 298 grams-per-MT of biomass harvested, down from the 621 grams-per-metric ton it registered in 2016 and a 14.6% drop from the 349 grams-per-MT it used in 2019.
A relatively lower rate of production growth was observed in Europe, especially in Scotland, during the same period. For the past two years, Norwegian production has also been growing at a relatively slow rate due to regulatory constraints and sea lice difficulties. The total harvest quantity of salmonids in Norway in 2020 amounted to 1.46 million metric ton, representing an increase of 3.5% compared to 2019.
Norway's salmon industry had successfully pushed for bold changes in the supply chains for soya, an important vegetable component of salmon feed. All the Brazilian soy suppliers to the Norwegian salmon farming industry agreed to the implementation of a 100 % deforestation and conversion-free soybean value chain with 2020 as their cut-off date.
The Chilean salmon farming sector achieved very prospecting results. Production costs have fallen, and biological conditions at farms have reportedly improved, reflected in higher harvests that have even surpassed those of Norway. This is particularly driving the efforts to develop new approaches to farming, mainly focused on closed containment technologies, both on land and at sea. Also, new aquaculture operations are being set up in a variety of geographically dispersed countries, such as Iceland, the Russian Federation, and China, which is likely to spike up the salmon supply in the years to come.
Salmon Industry Overview
Additional Benefits:
- The market estimate (ME) sheet in Excel format
- 3 months of analyst support
TABLE OF CONTENTS
1 INTRODUCTION
- 1.1 Study Deliverables
- 1.2 Study Assumptions and Scope of the Study
2 RESEARCH METHODOLOGY
3 EXECUTIVE SUMMARY
4 MARKET DYNAMICS
- 4.1 Market Overview
- 4.2 Market Drivers
- 4.3 Market Restraints
- 4.4 Supply Chain Analysis
5 MARKET SEGMENTATION
- 5.1 Species Type
- 5.1.1 Atlantic Salmon
- 5.1.2 Coho Salmon
- 5.1.3 Masu Salmon
- 5.1.4 Chinook Salmon
- 5.1.5 Other Species Types
- 5.2 Type
- 5.2.1 Farmed
- 5.2.2 Wild Captured
- 5.3 Geography
- 5.3.1 North America
- 5.3.1.1 United States
- 5.3.1.2 Canada
- 5.3.2 Europe
- 5.3.2.1 Norway
- 5.3.2.2 Spain
- 5.3.2.3 Netherlands
- 5.3.2.4 France
- 5.3.2.5 Italy
- 5.3.2.6 Greece
- 5.3.2.7 United Kingdom
- 5.3.2.8 Scotland
- 5.3.3 Asia-Pacific
- 5.3.3.1 China
- 5.3.3.2 Japan
- 5.3.3.3 Australia
- 5.3.4 South America
- 5.3.4.1 Chile
- 5.3.1 North America

