
|
市場調査レポート
商品コード
1444830
乳製品:市場シェア分析、業界動向と統計、成長予測(2024~2029年)Dairy - Market Share Analysis, Industry Trends & Statistics, Growth Forecasts (2024 - 2029) |
||||||
カスタマイズ可能
適宜更新あり
|
|||||||
| 乳製品:市場シェア分析、業界動向と統計、成長予測(2024~2029年) |
|
出版日: 2024年02月15日
発行: Mordor Intelligence
ページ情報: 英文 513 Pages
納期: 2~3営業日
|

全表示
- 概要
- 目次
概要
乳製品市場規模は2024年に6,200億米ドルと推定され、2029年までに7,688億米ドルに達すると予測されており、予測期間(2024年から2029年)中に4.40%のCAGRで成長します。
消費者の意思決定に影響を与える能力により、スーパーマーケット/ハイパーマーケットを通じて需要が促進されています。
- 他の小売チャネルと比較して、スーパーマーケットとハイパーマーケットが乳製品市場を独占しています。スーパーマーケットとハイパーマーケットにおける乳製品の売上が最も多い場所は欧州でした。 2022年の時点で、スーパーマーケットやハイパーマーケットを通じた乳製品の売上高は、欧州の金額シェアの41.6%を占めています。特に大都市や大都市圏におけるスーパーマーケットやハイパーマーケットの近接性は、市場で入手可能な多種多様な製品の中から購入する消費者の決定に影響を与えるというさらなる利点をもたらします。
- 外食チャネルからの乳製品ベースのレシピに対する需要の増加により、世界の乳製品市場の成長が促進されています。貿易チャネルを通じた乳製品の売上は、2022年と比較して2025年に9%増加すると予想されています。この部門の成長は、自宅で調理された食品の消費に起因すると考えられています。 2022年には、世界中の消費者の47%がレストランで食事を消費し、消費者の31%がフードサービスチャネルから食事を注文しました。
- アジア太平洋は、世界のオンラインチャネルを通じた乳製品販売の最大の市場の1つであり、2018年から2022年にかけて金額ベースで10.2%成長しました。無料配達、注文のキャンセルの容易さ、返金手続き、クーポンコードの提供などの利点があります。これらのプラットフォームにより、消費者に手間のかからないショッピング体験を提供します。
- すべての乳製品の中で、乳製品デザートが貿易外チャネルのシェアの大部分を占めました。 2022年には、乳製品デザートが乳製品業界全体の40.24%を占め、次にチーズが続き、金額シェアは24.6%となりました。
欧州からの需要に続き、アジア太平洋が世界市場を独占している
- 世界の乳製品市場は、2019年から2023年にかけて金額ベースで11%成長しました。南米では、主に政府投資、メーカーによる製品革新、より健康的な選択への意識の高まりにより、2023年には乳製品消費量が2019年比で12%増と大幅に急増すると予想されています。
- 欧州は金額シェア33.76%で市場を独占しており、2023年には北米を10.9%上回っています。牛乳の高生産と牛乳産業への政府投資の増加が欧州市場の成長を牽引しています。欧州で消費される乳製品の多くは地元で生産されています。 2021年、欧州の酪農場は1億6,100万トンの生乳を生産し、そのうち96%が牛乳でした。欧州政府の有機農業への投資は、有機牛乳生産の機会を生み出しています。欧州委員会のグリーンディール産業計画は、2030年までに欧州連合の農地の少なくとも25%を有機農業で利用するという目標を設定しています。
- アジア太平洋は世界で2番目に大きな乳製品市場です。この地域は、2024年から2027年にかけて金額ベースで14%の成長率を記録すると予想されています。アジア太平洋では、乳製品に対する強い需要と世界有数の乳製品生産国が存在することにより、乳製品市場が大幅に拡大しています。インドは世界最大の牛乳生産国で、2021年から2022年にかけて世界の牛乳生産量の24%を占めています。インド政府は、食品加工の自動ルートを通じた100% FDI(海外直接投資)を許可しました。乳製品産業は、インドの食品産業におけるFDIの約40%を占める相当なFDIを記録し、この地域の市場の成長を押し上げました。
世界の乳製品市場動向
牛乳および牛乳関連製品の消費は、健康意識の高まり、栄養上の利点に対する意識、オーガニック製品や天然製品への嗜好によって促進されています。
- 健康志向の消費者がさまざまな乳製品の栄養上の利点を認識していることにより、牛乳および牛乳関連製品の消費が増加しています。 2022年の欧州乳業産業の一人当たり消費量は、2021年と比較して1.35%の成長率を記録しました。米国、ドイツ、英国などの先進国の消費者は、牛乳やその他の乳製品の消費に徐々に関心を抱くようになりました。より自然で健康的であると信じているため、有機栽培または他の自然技術を使用して生産されています。
- 乳製品は、ピザ、パスタ、ハンバーガーなどのさまざまな食品にチーズ、乳製品デザート、バターを多用するため、アメリカ人の食生活において重要な役割を果たしています。これにより、地域全体でさまざまな乳製品の需要が増加しました。国内消費量が多いため、乳製品の生産と輸入は大幅に増加しています。 2021年、米国は33億米ドル相当の乳製品を輸入しました。チーズの生産も2021年には2.8%増の136億ポンドとなった。
- 米国、オーストラリア、英国、ドイツなどの先進国では、ヨーグルトを含む乳製品不使用製品の大幅な成長が見込まれています。糖分が低く、タンパク質や繊維が多く、砂糖の加工がゼロまたは最小限に抑えられた製品が、消費者からますます求められています。一人当たりのヨーグルト消費量の増加により、生産量も大幅に増加しました。例えば、英国におけるヨーグルトの生産量は2021年に約46万3,000トンでした。
乳業の概要
乳製品市場は細分化されており、上位5社が9.58%を占めています。
その他の特典
- エクセル形式の市場予測(ME)シート
- 3か月のアナリストサポート
目次
第1章 エグゼクティブサマリーと主要な調査結果
第2章 レポートの提供
第3章 イントロダクション
- 調査の前提条件と市場の定義
- 調査範囲
- 調査手法
第4章 主要な業界動向
- 一人当たりの消費量
- 原材料・商品の製造
- バター
- チーズ
- 牛乳
- 規制の枠組み
- アルゼンチン
- オーストラリア
- ブラジル
- カナダ
- 中国
- フランス
- ドイツ
- インド
- イタリア
- 日本
- メキシコ
- サウジアラビア
- アラブ首長国連邦
- 英国
- 米国
- バリューチェーンと流通チャネルの分析
第5章 市場セグメンテーション(金額と数量での市場規模、2029年までの予測、および成長見通しの分析を含む)
- カテゴリー
- バター
- 製品タイプ別
- 培養バター
- 無培養バター
- チーズ
- 製品タイプ別
- ナチュラルチーズ
- プロセスチーズ
- クリーム
- 製品タイプ別
- ダブルクリーム
- シングルクリーム
- ホイップクリーム
- その他
- 乳製品デザート
- 製品タイプ別
- チーズケーキ
- 冷菓
- アイスクリーム
- ムース
- その他
- 牛乳
- 製品タイプ別
- 練乳
- フレーバーミルク
- 新鮮な牛乳
- 粉ミルク
- UHTミルク
- サワーミルクドリンク
- ヨーグルト
- 製品タイプ別
- フレーバーヨーグルト
- 無味ヨーグルト
- バター
- 流通チャネル
- オフトレード
- コンビニエンスストア
- オンライン小売
- 専門小売店
- スーパーマーケットとハイパーマーケット
- その他(ウェアハウスクラブ、ガソリンスタンド等)
- オントレード
- オフトレード
- 地域
- アフリカ
- カテゴリ別
- 流通チャネル別
- 国別
- エジプト
- ナイジェリア
- 南アフリカ
- その他アフリカ
- アジア太平洋
- カテゴリ別
- 流通チャネル別
- 国別
- オーストラリア
- 中国
- インド
- インドネシア
- 日本
- マレーシア
- ニュージーランド
- パキスタン
- 韓国
- その他アジア太平洋地域
- 欧州
- カテゴリ別
- 流通チャネル別
- 国別
- ベルギー
- フランス
- ドイツ
- イタリア
- オランダ
- ロシア
- スペイン
- トルコ
- 英国
- その他欧州
- 中東
- カテゴリ別
- 流通チャネル別
- 国別
- バーレーン
- イラン
- クウェート
- オマーン
- カタール
- サウジアラビア
- アラブ首長国連邦
- その他中東
- 北米
- カテゴリ別
- 流通チャネル別
- 国別
- カナダ
- メキシコ
- 米国
- その他北米
- 南米
- カテゴリ別
- 流通チャネル別
- 国別
- アルゼンチン
- ブラジル
- その他南米
- アフリカ
第6章 競合情勢
- 主要な戦略的動き
- 市場シェア分析
- 会社の情勢
- 企業プロファイル(世界レベルの概要、市場レベルの概要、中核事業セグメント、財務、従業員数、主要情報、市場ランク、市場シェア、製品とサービス、および最近の動向の分析を含む)。
- Almarai Company
- Arla Foods Amba
- China Mengniu Dairy Company Ltd
- Dairy Farmers of America Inc.
- Danone SA
- Fonterra Co-operative Group Limited
- Groupe Lactalis
- Gujarat Co-operative Milk Marketing Federation Ltd
- Inner Mongolia Yili Industrial Group Co. Ltd
- Nestle SA
- Saputo Inc.
- Unilever PLC
第7章 CEOへの主戦略的な質問
第8章 付録
- 世界概要
- 概要
- ポーターのファイブ・フォース・フレームワーク
- 世界バリューチェーン分析
- 市場力学(DRO)
- 出典と参考文献
- 表と図のリスト
- 主な洞察
- データパック
- 用語集
目次
Product Code: 60119
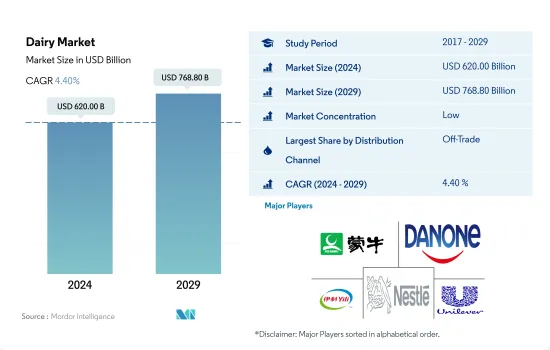
The Dairy Market size is estimated at USD 620 billion in 2024, and is expected to reach USD 768.80 billion by 2029, growing at a CAGR of 4.40% during the forecast period (2024-2029).
The capability to influence consumer decision is driving the demand through Supermarkets/ Hypermarkets.
- Compared to other retail channels, supermarkets and hypermarkets dominate the dairy market. Europe topped the place with the most sales of dairy products in Supermarkets and Hypermarkets. As of 2022, the sales of dairy products through supermarkets and hypermarkets accounted for 41.6% of the value share in Europe. The proximity factor of Supermarkets and Hypermarkets, especially in large cities and metropolitan areas, provides them with an added advantage of influencing the consumer's decision to make the purchase among the large variety of products available in the market.
- Increasing demand for dairy-based recipes from food service channels is boosting the growth of the global dairy market. The sales of dairy through on-trade channels are anticipated to grow by 9% in 2025 compared to the year 2022. The segment's growth is attributed to consuming food prepared away from home. In 2022, 47% of consumers globally consumed meals at restaurants, and 31% of consumers ordered their food from food service channels.
- Asia-Pacific is one of the largest markets for the sales of dairy products through online channels globally, growing by 10.2% in terms of value from 2018 to 2022. Advantages like free deliveries, ease of canceling orders, refund process, and coupon codes offered by these platforms provide consumers with a hassle-free shopping experience.
- Among all dairy products, dairy desserts accounted for the majority of share in off-trade channels. In 2022, dairy desserts accounted for 40.24% of the total dairy industry, followed by cheese, with a 24.6% value share.
The demand from Europe followed by Asia-Pacific is dominating the global market
- The global dairy market grew by 11% in terms of value from 2019 to 2023. South America is expected to see a substantial spike of 12% in dairy consumption in 2023 compared to 2019, mainly due to government investments, product innovations from manufacturers, and the growing awareness of healthier choices.
- Europe dominates the market with a value share of 33.76%, which was 10.9% more than North America in 2023. High production of cow's milk and the growing government investments in the milk industry are driving the market's growth in Europe. Much of the dairy consumed in Europe is produced locally. In 2021, European dairy farms produced 161 million metric tons of raw milk, of which 96% was cow's milk. The European governments' investments in organic farming are creating opportunities for organic milk production. The European Commission's Green Deal Industry Plan set a target of utilizing at least 25% of the European Union's agricultural land under organic farming by 2030.
- Asia-Pacific is the second-largest dairy market globally. The region is anticipated to register a growth rate of 14% by value during 2024-2027. In Asia-Pacific, the dairy market is expanding rigorously due to the strong demand for dairy products and the presence of countries with the world's leading dairy producers. India is the largest producer of milk in the world, contributing 24% of the global milk production from 2021-2022. The Government of India permitted 100% FDI (Foreign Direct Investment) through an automatic route for food processing. The dairy industry recorded a substantial FDI constituting about 40% of FDIs in the Indian food industry, thus boosting the market's growth in the region.
Global Dairy Market Trends
The consumption of milk and milk-related products is driven by increasing health-consciousness, awareness of nutritional benefits, and preference for organic and natural products.
- Consumption of milk and milk-related products is growing due to health-conscious consumers, along with awareness of the nutritional benefits of different dairy products. In 2022, the per capita consumption of the European dairy industry observed a growth rate of 1.35% compared to 2021. Consumers in developed countries like the United States, Germany, and the United Kingdom have gradually become more interested in consuming milk and other dairy products produced organically or using other natural techniques as they believe them to be more natural and healthy.
- Dairy products play a vital part in the diets of Americans as they use cheese, dairy desserts, and butter significantly in different food items like pizza, pasta, and burger. This has led to increased demand for different dairy products across the region. Owing to high domestic consumption, there is significant growth in terms of the production and import of dairy products. In 2021, the United States imported USD 3.3 billion worth of dairy products. Production of cheese also increased by 2.8% to 13.6 billion pounds in 2021.
- Strong growth is projected for free-from dairy products, including yogurt, in developed countries like the United States, Australia, the United Kingdom, and Germany. Products with low sugar content, high protein or fiber, and zero or minimally processed sugar are increasingly desired by consumers. Owing to the growing per capita consumption of yogurt, production has also witnessed significant growth. For example, the production volume of yogurt was approximately 463,000 tonnes in the United Kingdom in 2021.
Dairy Industry Overview
The Dairy Market is fragmented, with the top five companies occupying 9.58%. The major players in this market are China Mengniu Dairy Company Ltd, Danone SA, Inner Mongolia Yili Industrial Group Co. Ltd, Nestle SA and Unilever PLC (sorted alphabetically).
Additional Benefits:
- The market estimate (ME) sheet in Excel format
- 3 months of analyst support
TABLE OF CONTENTS
1 EXECUTIVE SUMMARY & KEY FINDINGS
2 REPORT OFFERS
3 INTRODUCTION
- 3.1 Study Assumptions & Market Definition
- 3.2 Scope of the Study
- 3.3 Research Methodology
4 KEY INDUSTRY TRENDS
- 4.1 Per Capita Consumption
- 4.2 Raw Material/Commodity Production
- 4.2.1 Butter
- 4.2.2 Cheese
- 4.2.3 Milk
- 4.3 Regulatory Framework
- 4.3.1 Argentina
- 4.3.2 Australia
- 4.3.3 Brazil
- 4.3.4 Canada
- 4.3.5 China
- 4.3.6 France
- 4.3.7 Germany
- 4.3.8 India
- 4.3.9 Italy
- 4.3.10 Japan
- 4.3.11 Mexico
- 4.3.12 Saudi Arabia
- 4.3.13 United Arab Emirates
- 4.3.14 United Kingdom
- 4.3.15 United States
- 4.4 Value Chain & Distribution Channel Analysis
5 MARKET SEGMENTATION (includes market size in Value in USD and Volume, Forecasts up to 2029 and analysis of growth prospects)
- 5.1 Category
- 5.1.1 Butter
- 5.1.1.1 By Product Type
- 5.1.1.1.1 Cultured Butter
- 5.1.1.1.2 Uncultured Butter
- 5.1.2 Cheese
- 5.1.2.1 By Product Type
- 5.1.2.1.1 Natural Cheese
- 5.1.2.1.2 Processed Cheese
- 5.1.3 Cream
- 5.1.3.1 By Product Type
- 5.1.3.1.1 Double Cream
- 5.1.3.1.2 Single Cream
- 5.1.3.1.3 Whipping Cream
- 5.1.3.1.4 Others
- 5.1.4 Dairy Desserts
- 5.1.4.1 By Product Type
- 5.1.4.1.1 Cheesecakes
- 5.1.4.1.2 Frozen Desserts
- 5.1.4.1.3 Ice Cream
- 5.1.4.1.4 Mousses
- 5.1.4.1.5 Others
- 5.1.5 Milk
- 5.1.5.1 By Product Type
- 5.1.5.1.1 Condensed milk
- 5.1.5.1.2 Flavored Milk
- 5.1.5.1.3 Fresh Milk
- 5.1.5.1.4 Powdered Milk
- 5.1.5.1.5 UHT Milk
- 5.1.6 Sour Milk Drinks
- 5.1.7 Yogurt
- 5.1.7.1 By Product Type
- 5.1.7.1.1 Flavored Yogurt
- 5.1.7.1.2 Unflavored Yogurt
- 5.1.1 Butter
- 5.2 Distribution Channel
- 5.2.1 Off-Trade
- 5.2.1.1 Convenience Stores
- 5.2.1.2 Online Retail
- 5.2.1.3 Specialist Retailers
- 5.2.1.4 Supermarkets and Hypermarkets
- 5.2.1.5 Others (Warehouse clubs, gas stations, etc.)
- 5.2.2 On-Trade
- 5.2.1 Off-Trade
- 5.3 Region
- 5.3.1 Africa
- 5.3.1.1 By Category
- 5.3.1.2 By Distribution Channel
- 5.3.1.3 By Country
- 5.3.1.3.1 Egypt
- 5.3.1.3.2 Nigeria
- 5.3.1.3.3 South Africa
- 5.3.1.3.4 Rest of Africa
- 5.3.2 Asia-Pacific
- 5.3.2.1 By Category
- 5.3.2.2 By Distribution Channel
- 5.3.2.3 By Country
- 5.3.2.3.1 Australia
- 5.3.2.3.2 China
- 5.3.2.3.3 India
- 5.3.2.3.4 Indonesia
- 5.3.2.3.5 Japan
- 5.3.2.3.6 Malaysia
- 5.3.2.3.7 New Zealand
- 5.3.2.3.8 Pakistan
- 5.3.2.3.9 South Korea
- 5.3.2.3.10 Rest of Asia Pacific
- 5.3.3 Europe
- 5.3.3.1 By Category
- 5.3.3.2 By Distribution Channel
- 5.3.3.3 By Country
- 5.3.3.3.1 Belgium
- 5.3.3.3.2 France
- 5.3.3.3.3 Germany
- 5.3.3.3.4 Italy
- 5.3.3.3.5 Netherlands
- 5.3.3.3.6 Russia
- 5.3.3.3.7 Spain
- 5.3.3.3.8 Turkey
- 5.3.3.3.9 United Kingdom
- 5.3.3.3.10 Rest of Europe
- 5.3.4 Middle East
- 5.3.4.1 By Category
- 5.3.4.2 By Distribution Channel
- 5.3.4.3 By Country
- 5.3.4.3.1 Bahrain
- 5.3.4.3.2 Iran
- 5.3.4.3.3 Kuwait
- 5.3.4.3.4 Oman
- 5.3.4.3.5 Qatar
- 5.3.4.3.6 Saudi Arabia
- 5.3.4.3.7 United Arab Emirates
- 5.3.4.3.8 Rest of Middle East
- 5.3.5 North America
- 5.3.5.1 By Category
- 5.3.5.2 By Distribution Channel
- 5.3.5.3 By Country
- 5.3.5.3.1 Canada
- 5.3.5.3.2 Mexico
- 5.3.5.3.3 United States
- 5.3.5.3.4 Rest of North America
- 5.3.6 South America
- 5.3.6.1 By Category
- 5.3.6.2 By Distribution Channel
- 5.3.6.3 By Country
- 5.3.6.3.1 Argentina
- 5.3.6.3.2 Brazil
- 5.3.6.3.3 Rest of South America
- 5.3.1 Africa
6 COMPETITIVE LANDSCAPE
- 6.1 Key Strategic Moves
- 6.2 Market Share Analysis
- 6.3 Company Landscape
- 6.4 Company Profiles (includes Global Level Overview, Market Level Overview, Core Business Segments, Financials, Headcount, Key Information, Market Rank, Market Share, Products and Services, and Analysis of Recent Developments).
- 6.4.1 Almarai Company
- 6.4.2 Arla Foods Amba
- 6.4.3 China Mengniu Dairy Company Ltd
- 6.4.4 Dairy Farmers of America Inc.
- 6.4.5 Danone SA
- 6.4.6 Fonterra Co-operative Group Limited
- 6.4.7 Groupe Lactalis
- 6.4.8 Gujarat Co-operative Milk Marketing Federation Ltd
- 6.4.9 Inner Mongolia Yili Industrial Group Co. Ltd
- 6.4.10 Nestle SA
- 6.4.11 Saputo Inc.
- 6.4.12 Unilever PLC
7 KEY STRATEGIC QUESTIONS FOR DAIRY AND DAIRY ALTERNATIVE CEOS
8 APPENDIX
- 8.1 Global Overview
- 8.1.1 Overview
- 8.1.2 Porter's Five Forces Framework
- 8.1.3 Global Value Chain Analysis
- 8.1.4 Market Dynamics (DROs)
- 8.2 Sources & References
- 8.3 List of Tables & Figures
- 8.4 Primary Insights
- 8.5 Data Pack
- 8.6 Glossary of Terms

