|
|
市場調査レポート
商品コード
1456782
グリースの世界市場 2024-2028Global Grease Market 2024-2028 |
||||||

|
|||||||
カスタマイズ可能
|
|||||||


| グリースの世界市場 2024-2028 |
|
出版日: 2024年03月01日
発行: TechNavio
ページ情報: 英文 189 Pages
納期: 即納可能
|

全表示
- 概要
- 図表
- 目次
グリース市場は2023-2028年に12億7,000万米ドル、予測期間中のCAGRは3.77%で成長すると予測されます。
当レポートでは、グリース市場の全体的な分析、市場規模・予測、動向、成長促進要因、課題、約25のベンダーを網羅したベンダー分析などを掲載しています。
現在の市場シナリオ、最新動向と促進要因、市場環境全体に関する最新分析を提供しています。市場は、造船事業の成長、鉄道取引と物流活動の増加、アジア太平洋における自動車産業の成長によって牽引されています。
| 市場範囲 | |
|---|---|
| 基準年 | 2024 |
| 終了年 | 2028 |
| 予測期間 | 2024-2028 |
| 成長モメンタム | 加速 |
| 前年比2024年 | 3.43% |
| CAGR | 3.77% |
| 増分額 | 12億7,000万米ドル |
本調査では、今後数年間のグリース市場の成長を促進する主な要因の一つとして、グリース生産のための新工場の立ち上げを挙げています。また、グリース生産におけるイノベーションのためのジョイントベンチャーの増加や、顧客へのリーチを拡大するためのeコマース産業の活用も、市場の大きな需要につながると思われます。
目次
第1章 エグゼクティブサマリー
- 市場概要
第2章 市場情勢
- 市場エコシステム
第3章 市場規模
- 市場の定義
- 市場セグメント分析
- 市場規模 2023
- 市場の見通し 2023-2028
第4章 市場規模実績
- グリースの世界市場 2018-2022
- エンドユーザーセグメント分析 2018-2022
- ソースセグメント分析 2018-2022
- 地域別セグメント分析 2018-2022
- 国別セグメント分析 2018-2022
第5章 ファイブフォース分析
- ファイブフォースの要約
- 買い手の交渉力
- 供給企業の交渉力
- 新規参入業者の脅威
- 代替品の脅威
- 競争の脅威
- 市況
第6章 市場セグメンテーション:エンドユーザー別
- 市場セグメント
- 比較:エンドユーザー別
- 自動車:市場規模と予測 2023-2028
- 建設とオフハイウェイ:市場規模と予測 2023-2028
- 金属の生産:市場規模と予測 2023-2028
- 一般製造業:市場規模と予測 2023-2028
- 発電他:市場規模と予測 2023-2028
- 市場機会:エンドユーザー別
第7章 市場セグメンテーション:ソース別
- 市場セグメント
- 比較:ソース別
- 鉱油:市場規模と予測 2023-2028
- 合成油:市場規模と予測 2023-2028
- バイオベースオイル:市場規模と予測 2023-2028
- 市場機会:ソース別
第8章 顧客情勢
- 顧客情勢の概要
第9章 地域別情勢
- 地域別セグメンテーション
- 地域別比較
- アジア太平洋:市場規模と予測 2023-2028
- 北米:市場規模と予測 2023-2028
- 欧州:市場規模と予測 2023-2028
- 中東・アフリカ:市場規模と予測 2023-2028
- 南米:市場規模と予測 2023-2028
- 中国:市場規模と予測 2023-2028
- 米国:市場規模と予測 2023-2028
- インド:市場規模と予測 2023-2028
- 日本:市場規模と予測 2023-2028
- ドイツ:市場規模と予測 2023-2028
- 市場機会:地域情勢別
第10章 促進要因、課題、および動向
- 市場促進要因
- 市場の課題
- 促進要因と課題の影響
- 市場動向
第11章 ベンダー情勢
- 概要
- ベンダー情勢
- 混乱の状況
- 業界のリスク
第12章 ベンダー分析
- 対象ベンダー
- ベンダーの市場ポジショニング
- BP Plc
- Chevron Corp.
- DuPont de Nemours Inc.
- ENEOS Holdings Inc.
- Exxon Mobil Corp.
- Freudenberg and Co. KG
- FUCHS PETROLUB SE
- MOL Group
- Morris Lubricants
- Normet Group Oy
- Shell plc
- Sinopec Shanghai Petrochemical Co. Ltd.
- Sintek Group JSC
- SKF
- TotalEnergies SE
第13章 付録
Exhibits:
- Exhibits1: Executive Summary - Chart on Market Overview
- Exhibits2: Executive Summary - Data Table on Market Overview
- Exhibits3: Executive Summary - Chart on Global Market Characteristics
- Exhibits4: Executive Summary - Chart on Market By Geographical Landscape
- Exhibits5: Executive Summary - Chart on Market Segmentation by End-user
- Exhibits6: Executive Summary - Chart on Market Segmentation by Source
- Exhibits7: Executive Summary - Chart on Incremental Growth
- Exhibits8: Executive Summary - Data Table on Incremental Growth
- Exhibits9: Executive Summary - Chart on Vendor Market Positioning
- Exhibits10: Parent market
- Exhibits11: Market Characteristics
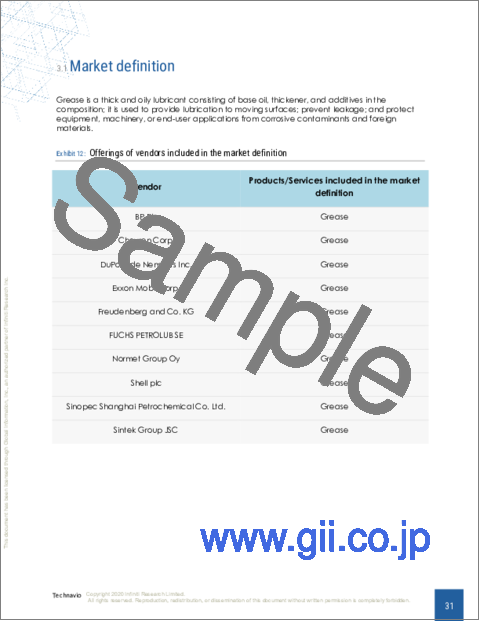
- Exhibits12: Offerings of vendors included in the market definition
- Exhibits13: Market segments
- Exhibits14: Chart on Global - Market size and forecast 2023-2028 ($ billion)
- Exhibits15: Data Table on Global - Market size and forecast 2023-2028 ($ billion)
- Exhibits16: Chart on Global Market: Year-over-year growth 2023-2028 (%)
- Exhibits17: Data Table on Global Market: Year-over-year growth 2023-2028 (%)
- Exhibits18: Historic Market Size - Data Table on global grease market 2018 - 2022 ($ billion)
- Exhibits19: Historic Market Size - End-user Segment 2018 - 2022 ($ billion)
- Exhibits20: Historic Market Size - Source Segment 2018 - 2022 ($ billion)
- Exhibits21: Historic Market Size - Geography Segment 2018 - 2022 ($ billion)
- Exhibits22: Historic Market Size - Country Segment 2018 - 2022 ($ billion)
- Exhibits23: Five forces analysis - Comparison between 2023 and 2028
- Exhibits24: Chart on Bargaining power of buyers - Impact of key factors 2023 and 2028
- Exhibits25: Bargaining power of suppliers - Impact of key factors in 2023 and 2028
- Exhibits26: Threat of new entrants - Impact of key factors in 2023 and 2028
- Exhibits27: Threat of substitutes - Impact of key factors in 2023 and 2028
- Exhibits28: Threat of rivalry - Impact of key factors in 2023 and 2028
- Exhibits29: Chart on Market condition - Five forces 2023 and 2028
- Exhibits30: Chart on End-user - Market share 2023-2028 (%)
- Exhibits31: Data Table on End-user - Market share 2023-2028 (%)
- Exhibits32: Chart on Comparison by End-user
- Exhibits33: Data Table on Comparison by End-user
- Exhibits34: Chart on Automotive - Market size and forecast 2023-2028 ($ billion)
- Exhibits35: Data Table on Automotive - Market size and forecast 2023-2028 ($ billion)
- Exhibits36: Chart on Automotive - Year-over-year growth 2023-2028 (%)
- Exhibits37: Data Table on Automotive - Year-over-year growth 2023-2028 (%)
- Exhibits38: Chart on Construction and off-highway - Market size and forecast 2023-2028 ($ billion)
- Exhibits39: Data Table on Construction and off-highway - Market size and forecast 2023-2028 ($ billion)
- Exhibits40: Chart on Construction and off-highway - Year-over-year growth 2023-2028 (%)
- Exhibits41: Data Table on Construction and off-highway - Year-over-year growth 2023-2028 (%)
- Exhibits42: Chart on Metal production - Market size and forecast 2023-2028 ($ billion)
- Exhibits43: Data Table on Metal production - Market size and forecast 2023-2028 ($ billion)
- Exhibits44: Chart on Metal production - Year-over-year growth 2023-2028 (%)
- Exhibits45: Data Table on Metal production - Year-over-year growth 2023-2028 (%)
- Exhibits46: Chart on General manufacturing - Market size and forecast 2023-2028 ($ billion)
- Exhibits47: Data Table on General manufacturing - Market size and forecast 2023-2028 ($ billion)
- Exhibits48: Chart on General manufacturing - Year-over-year growth 2023-2028 (%)
- Exhibits49: Data Table on General manufacturing - Year-over-year growth 2023-2028 (%)
- Exhibits50: Chart on Power generation and others - Market size and forecast 2023-2028 ($ billion)
- Exhibits51: Data Table on Power generation and others - Market size and forecast 2023-2028 ($ billion)
- Exhibits52: Chart on Power generation and others - Year-over-year growth 2023-2028 (%)
- Exhibits53: Data Table on Power generation and others - Year-over-year growth 2023-2028 (%)
- Exhibits54: Market opportunity by End-user ($ billion)
- Exhibits55: Data Table on Market opportunity by End-user ($ billion)
- Exhibits56: Chart on Source - Market share 2023-2028 (%)
- Exhibits57: Data Table on Source - Market share 2023-2028 (%)
- Exhibits58: Chart on Comparison by Source
- Exhibits59: Data Table on Comparison by Source
- Exhibits60: Chart on Mineral oil - Market size and forecast 2023-2028 ($ billion)
- Exhibits61: Data Table on Mineral oil - Market size and forecast 2023-2028 ($ billion)
- Exhibits62: Chart on Mineral oil - Year-over-year growth 2023-2028 (%)
- Exhibits63: Data Table on Mineral oil - Year-over-year growth 2023-2028 (%)
- Exhibits64: Chart on Synthetic oil - Market size and forecast 2023-2028 ($ billion)
- Exhibits65: Data Table on Synthetic oil - Market size and forecast 2023-2028 ($ billion)
- Exhibits66: Chart on Synthetic oil - Year-over-year growth 2023-2028 (%)
- Exhibits67: Data Table on Synthetic oil - Year-over-year growth 2023-2028 (%)
- Exhibits68: Chart on Bio-based oil - Market size and forecast 2023-2028 ($ billion)
- Exhibits69: Data Table on Bio-based oil - Market size and forecast 2023-2028 ($ billion)
- Exhibits70: Chart on Bio-based oil - Year-over-year growth 2023-2028 (%)
- Exhibits71: Data Table on Bio-based oil - Year-over-year growth 2023-2028 (%)
- Exhibits72: Market opportunity by Source ($ billion)
- Exhibits73: Data Table on Market opportunity by Source ($ billion)
- Exhibits74: Analysis of price sensitivity, lifecycle, customer purchase basket, adoption rates, and purchase criteria
- Exhibits75: Chart on Market share By Geographical Landscape 2023-2028 (%)
- Exhibits76: Data Table on Market share By Geographical Landscape 2023-2028 (%)
- Exhibits77: Chart on Geographic comparison
- Exhibits78: Data Table on Geographic comparison
- Exhibits79: Chart on APAC - Market size and forecast 2023-2028 ($ billion)
- Exhibits80: Data Table on APAC - Market size and forecast 2023-2028 ($ billion)
- Exhibits81: Chart on APAC - Year-over-year growth 2023-2028 (%)
- Exhibits82: Data Table on APAC - Year-over-year growth 2023-2028 (%)
- Exhibits83: Chart on North America - Market size and forecast 2023-2028 ($ billion)
- Exhibits84: Data Table on North America - Market size and forecast 2023-2028 ($ billion)
- Exhibits85: Chart on North America - Year-over-year growth 2023-2028 (%)
- Exhibits86: Data Table on North America - Year-over-year growth 2023-2028 (%)
- Exhibits87: Chart on Europe - Market size and forecast 2023-2028 ($ billion)
- Exhibits88: Data Table on Europe - Market size and forecast 2023-2028 ($ billion)
- Exhibits89: Chart on Europe - Year-over-year growth 2023-2028 (%)
- Exhibits90: Data Table on Europe - Year-over-year growth 2023-2028 (%)
- Exhibits91: Chart on Middle East and Africa - Market size and forecast 2023-2028 ($ billion)
- Exhibits92: Data Table on Middle East and Africa - Market size and forecast 2023-2028 ($ billion)
- Exhibits93: Chart on Middle East and Africa - Year-over-year growth 2023-2028 (%)
- Exhibits94: Data Table on Middle East and Africa - Year-over-year growth 2023-2028 (%)
- Exhibits95: Chart on South America - Market size and forecast 2023-2028 ($ billion)
- Exhibits96: Data Table on South America - Market size and forecast 2023-2028 ($ billion)
- Exhibits97: Chart on South America - Year-over-year growth 2023-2028 (%)
- Exhibits98: Data Table on South America - Year-over-year growth 2023-2028 (%)
- Exhibits99: Chart on China - Market size and forecast 2023-2028 ($ billion)
- Exhibits100: Data Table on China - Market size and forecast 2023-2028 ($ billion)
- Exhibits101: Chart on China - Year-over-year growth 2023-2028 (%)
- Exhibits102: Data Table on China - Year-over-year growth 2023-2028 (%)
- Exhibits103: Chart on US - Market size and forecast 2023-2028 ($ billion)
- Exhibits104: Data Table on US - Market size and forecast 2023-2028 ($ billion)
- Exhibits105: Chart on US - Year-over-year growth 2023-2028 (%)
- Exhibits106: Data Table on US - Year-over-year growth 2023-2028 (%)
- Exhibits107: Chart on India - Market size and forecast 2023-2028 ($ billion)
- Exhibits108: Data Table on India - Market size and forecast 2023-2028 ($ billion)
- Exhibits109: Chart on India - Year-over-year growth 2023-2028 (%)
- Exhibits110: Data Table on India - Year-over-year growth 2023-2028 (%)
- Exhibits111: Chart on Japan - Market size and forecast 2023-2028 ($ billion)
- Exhibits112: Data Table on Japan - Market size and forecast 2023-2028 ($ billion)
- Exhibits113: Chart on Japan - Year-over-year growth 2023-2028 (%)
- Exhibits114: Data Table on Japan - Year-over-year growth 2023-2028 (%)
- Exhibits115: Chart on Germany - Market size and forecast 2023-2028 ($ billion)
- Exhibits116: Data Table on Germany - Market size and forecast 2023-2028 ($ billion)
- Exhibits117: Chart on Germany - Year-over-year growth 2023-2028 (%)
- Exhibits118: Data Table on Germany - Year-over-year growth 2023-2028 (%)
- Exhibits119: Market opportunity By Geographical Landscape ($ billion)
- Exhibits120: Data Tables on Market opportunity By Geographical Landscape ($ billion)
- Exhibits121: Impact of drivers and challenges in 2023 and 2028
- Exhibits122: Overview on Criticality of inputs and Factors of differentiation
- Exhibits123: Overview on factors of disruption
- Exhibits124: Impact of key risks on business
- Exhibits125: Vendors covered
- Exhibits126: Matrix on vendor position and classification
- Exhibits127: BP Plc - Overview
- Exhibits128: BP Plc - Business segments
- Exhibits129: BP Plc - Key news
- Exhibits130: BP Plc - Key offerings
- Exhibits131: BP Plc - Segment focus
- Exhibits132: Chevron Corp. - Overview
- Exhibits133: Chevron Corp. - Business segments
- Exhibits134: Chevron Corp. - Key offerings
- Exhibits135: Chevron Corp. - Segment focus
- Exhibits136: DuPont de Nemours Inc. - Overview
- Exhibits137: DuPont de Nemours Inc. - Business segments
- Exhibits138: DuPont de Nemours Inc. - Key news
- Exhibits139: DuPont de Nemours Inc. - Key offerings
- Exhibits140: DuPont de Nemours Inc. - Segment focus
- Exhibits141: ENEOS Holdings Inc. - Overview
- Exhibits142: ENEOS Holdings Inc. - Product / Service
- Exhibits143: ENEOS Holdings Inc. - Key offerings
- Exhibits144: Exxon Mobil Corp. - Overview
- Exhibits145: Exxon Mobil Corp. - Business segments
- Exhibits146: Exxon Mobil Corp. - Key news
- Exhibits147: Exxon Mobil Corp. - Key offerings
- Exhibits148: Exxon Mobil Corp. - Segment focus
- Exhibits149: Freudenberg and Co. KG - Overview
- Exhibits150: Freudenberg and Co. KG - Business segments
- Exhibits151: Freudenberg and Co. KG - Key news
- Exhibits152: Freudenberg and Co. KG - Key offerings
- Exhibits153: Freudenberg and Co. KG - Segment focus
- Exhibits154: FUCHS PETROLUB SE - Overview
- Exhibits155: FUCHS PETROLUB SE - Business segments
- Exhibits156: FUCHS PETROLUB SE - Key news
- Exhibits157: FUCHS PETROLUB SE - Key offerings
- Exhibits158: FUCHS PETROLUB SE - Segment focus
- Exhibits159: MOL Group - Overview
- Exhibits160: MOL Group - Business segments
- Exhibits161: MOL Group - Key offerings
- Exhibits162: MOL Group - Segment focus
- Exhibits163: Morris Lubricants - Overview
- Exhibits164: Morris Lubricants - Product / Service
- Exhibits165: Morris Lubricants - Key offerings
- Exhibits166: Normet Group Oy - Overview
- Exhibits167: Normet Group Oy - Product / Service
- Exhibits168: Normet Group Oy - Key news
- Exhibits169: Normet Group Oy - Key offerings
- Exhibits170: Shell plc - Overview
- Exhibits171: Shell plc - Business segments
- Exhibits172: Shell plc - Key news
- Exhibits173: Shell plc - Key offerings
- Exhibits174: Shell plc - Segment focus
- Exhibits175: Sinopec Shanghai Petrochemical Co. Ltd. - Overview
- Exhibits176: Sinopec Shanghai Petrochemical Co. Ltd. - Business segments
- Exhibits177: Sinopec Shanghai Petrochemical Co. Ltd. - Key news
- Exhibits178: Sinopec Shanghai Petrochemical Co. Ltd. - Key offerings
- Exhibits179: Sinopec Shanghai Petrochemical Co. Ltd. - Segment focus
- Exhibits180: Sintek Group JSC - Overview
- Exhibits181: Sintek Group JSC - Product / Service
- Exhibits182: Sintek Group JSC - Key offerings
- Exhibits183: SKF - Overview
- Exhibits184: SKF - Business segments
- Exhibits185: SKF - Key news
- Exhibits186: SKF - Key offerings
- Exhibits187: SKF - Segment focus
- Exhibits188: TotalEnergies SE - Overview
- Exhibits189: TotalEnergies SE - Business segments
- Exhibits190: TotalEnergies SE - Key news
- Exhibits191: TotalEnergies SE - Key offerings
- Exhibits192: TotalEnergies SE - Segment focus
- Exhibits193: Inclusions checklist
- Exhibits194: Exclusions checklist
- Exhibits195: Currency conversion rates for US$
- Exhibits196: Research methodology
- Exhibits197: Validation techniques employed for market sizing
- Exhibits198: Information sources
- Exhibits199: List of abbreviations
The grease market is forecasted to grow by USD 1.27 bn during 2023-2028, accelerating at a CAGR of 3.77% during the forecast period. The report on the grease market provides a holistic analysis, market size and forecast, trends, growth drivers, and challenges, as well as vendor analysis covering around 25 vendors.
The report offers an up-to-date analysis regarding the current market scenario, the latest trends and drivers, and the overall market environment. The market is driven by a growing shipbuilding business, an increase in rail trading and logistics activities, and a growing automotive industry in APAC.
Technavio's grease market is segmented as below:
| Market Scope | |
|---|---|
| Base Year | 2024 |
| End Year | 2028 |
| Series Year | 2024-2028 |
| Growth Momentum | Accelerate |
| YOY 2024 | 3.43% |
| CAGR | 3.77% |
| Incremental Value | $1.27bn |
By End-user
- Automotive
- Construction and off-highway
- Metal production
- General manufacturing
- Power generation and others
By Source
- Mineral oil
- Synthetic oil
- Bio-based oil
By Geographical Landscape
- APAC
- North America
- Europe
- Middle East and Africa
- South America
This study identifies the inauguration of new plants for grease production as one of the prime reasons driving the grease market growth during the next few years. Also, increase in number of joint ventures for innovations in grease production and leveraging e-commerce industry to increase customer reach will lead to sizable demand in the market.
The report on the grease market covers the following areas:
- Grease market sizing
- Grease market forecast
- Grease market industry analysis
The robust vendor analysis is designed to help clients improve their market position, and in line with this, this report provides a detailed analysis of several leading grease market vendors that include Balmer Lawrie and Co. Ltd., Berkshire Hathaway Inc., BP Plc, Chevron Corp., DuPont de Nemours Inc., ENEOS Holdings Inc., Exxon Mobil Corp., Freudenberg and Co. KG, FUCHS PETROLUB SE, Indian Oil Corp. Ltd., MOL Group, Morris Lubricants, Normet Group Oy, PJSC LUKOIL, Shell plc, Sinopec Shanghai Petrochemical Co. Ltd., Sintek Group JSC, SK Innovation Co. Ltd., SKF, and TotalEnergies SE. Also, the grease market analysis report includes information on upcoming trends and challenges that will influence market growth. This is to help companies strategize and leverage all forthcoming growth opportunities.
The study was conducted using an objective combination of primary and secondary information including inputs from key participants in the industry. The report contains a comprehensive market and vendor landscape in addition to an analysis of the key vendors.
The publisher presents a detailed picture of the market by the way of study, synthesis, and summation of data from multiple sources by an analysis of key parameters such as profit, pricing, competition, and promotions. It presents various market facets by identifying the key industry influencers. The data presented is comprehensive, reliable, and a result of extensive research - both primary and secondary. The market research reports provide a complete competitive landscape and an in-depth vendor selection methodology and analysis using qualitative and quantitative research to forecast the accurate market growth.
Table of Contents
1 Executive Summary
- 1.1 Market overview
2 Market Landscape
- 2.1 Market ecosystem
3 Market Sizing
- 3.1 Market definition
- 3.2 Market segment analysis
- 3.3 Market size 2023
- 3.4 Market outlook: Forecast for 2023-2028
4 Historic Market Size
- 4.1 Global grease market 2018 - 2022
- 4.2 End-user Segment Analysis 2018 - 2022
- 4.3 Source Segment Analysis 2018 - 2022
- 4.4 Geography Segment Analysis 2018 - 2022
- 4.5 Country Segment Analysis 2018 - 2022
5 Five Forces Analysis
- 5.1 Five forces summary
- 5.2 Bargaining power of buyers
- 5.3 Bargaining power of suppliers
- 5.4 Threat of new entrants
- 5.5 Threat of substitutes
- 5.6 Threat of rivalry
- 5.7 Market condition
6 Market Segmentation by End-user
- 6.1 Market segments
- 6.2 Comparison by End-user
- 6.3 Automotive - Market size and forecast 2023-2028
- 6.4 Construction and off-highway - Market size and forecast 2023-2028
- 6.5 Metal production - Market size and forecast 2023-2028
- 6.6 General manufacturing - Market size and forecast 2023-2028
- 6.7 Power generation and others - Market size and forecast 2023-2028
- 6.8 Market opportunity by End-user
7 Market Segmentation by Source
- 7.1 Market segments
- 7.2 Comparison by Source
- 7.3 Mineral oil - Market size and forecast 2023-2028
- 7.4 Synthetic oil - Market size and forecast 2023-2028
- 7.5 Bio-based oil - Market size and forecast 2023-2028
- 7.6 Market opportunity by Source
8 Customer Landscape
- 8.1 Customer landscape overview
9 Geographic Landscape
- 9.1 Geographic segmentation
- 9.2 Geographic comparison
- 9.3 APAC - Market size and forecast 2023-2028
- 9.4 North America - Market size and forecast 2023-2028
- 9.5 Europe - Market size and forecast 2023-2028
- 9.6 Middle East and Africa - Market size and forecast 2023-2028
- 9.7 South America - Market size and forecast 2023-2028
- 9.8 China - Market size and forecast 2023-2028
- 9.9 US - Market size and forecast 2023-2028
- 9.10 India - Market size and forecast 2023-2028
- 9.11 Japan - Market size and forecast 2023-2028
- 9.12 Germany - Market size and forecast 2023-2028
- 9.13 Market opportunity By Geographical Landscape
10 Drivers, Challenges, and Trends
- 10.1 Market drivers
- 10.2 Market challenges
- 10.3 Impact of drivers and challenges
- 10.4 Market trends
11 Vendor Landscape
- 11.1 Overview
- 11.2 Vendor landscape
- 11.3 Landscape disruption
- 11.4 Industry risks
12 Vendor Analysis
- 12.1 Vendors covered
- 12.2 Market positioning of vendors
- 12.3 BP Plc
- 12.4 Chevron Corp.
- 12.5 DuPont de Nemours Inc.
- 12.6 ENEOS Holdings Inc.
- 12.7 Exxon Mobil Corp.
- 12.8 Freudenberg and Co. KG
- 12.9 FUCHS PETROLUB SE
- 12.10 MOL Group
- 12.11 Morris Lubricants
- 12.12 Normet Group Oy
- 12.13 Shell plc
- 12.14 Sinopec Shanghai Petrochemical Co. Ltd.
- 12.15 Sintek Group JSC
- 12.16 SKF
- 12.17 TotalEnergies SE
13 Appendix
- 13.1 Scope of the report
- 13.2 Inclusions and exclusions checklist
- 13.3 Currency conversion rates for US$
- 13.4 Research methodology
- 13.5 List of abbreviations

