
|
市場調査レポート
商品コード
1850102
オリーブ:市場シェア分析、産業動向、統計、成長予測(2025年~2030年)Olive - Market Share Analysis, Industry Trends & Statistics, Growth Forecasts (2025 - 2030) |
||||||
カスタマイズ可能
適宜更新あり
|
|||||||
| オリーブ:市場シェア分析、産業動向、統計、成長予測(2025年~2030年) |
|
出版日: 2025年06月19日
発行: Mordor Intelligence
ページ情報: 英文 120 Pages
納期: 2~3営業日
|

概要
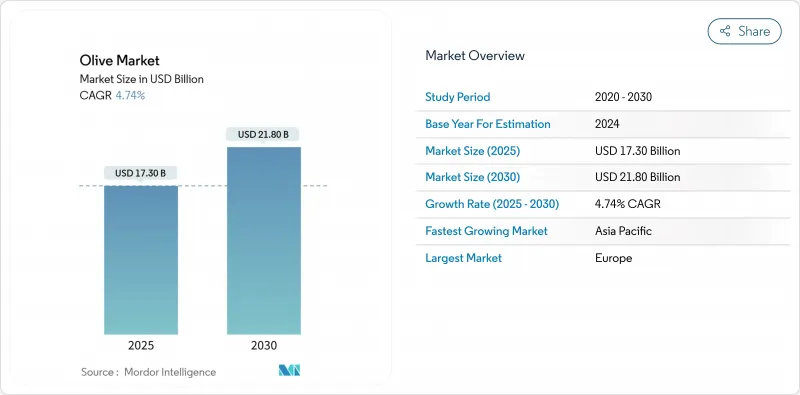
オリーブの世界市場規模は2025年に173億米ドル、2030年には218億米ドルに達し、予測期間中のCAGRは4.74%です。
この勢いは、臨床的に心血管系リスクの低減につながる地中海式食生活が広く受け入れられていること、アジア太平洋における可処分所得の増加、多年生作物に報いる持続可能性補助金などに起因しています。生産者はまた、乾燥した土地を超高密度の木立に転換し、水を節約しながら収量を向上させています。プレミアム・エキストラバージン輸出は、価格プレミアムを確保するブロックチェーントレーサビリティの恩恵を受けているが、気候に左右される2年ごとの着果の変動やキシレラ菌の蔓延により、不安定な状況が続いています。
世界のオリーブ市場の動向と洞察
地中海食への食事連動型シフト
PREDIMED試験から、オリーブオイルが豊富な食事パターンが心血管系イベントを減少させるという確固たる臨床的証拠が示され、医師やウェルネスプログラムがオリーブオイルを機能性主食として推奨するようになりました。現在、需要は地中海沿岸地域以外にも広がっており、都市部の所得が上昇している中国やインドでは、高級食品の購入を支えるものとして急速に普及しています。オリーブオイルに含まれる一価不飽和脂肪酸とポリフェノールは、LDLコレステロールと全身性炎症を低下させ、その健康への影響力を強めています。職場や病院のミールプランによる制度的導入が、家庭での消費を拡大しています。マーケティング・キャンペーンでは、科学的に証明された効能が強調され、日常の食生活にこの製品がさらに浸透しています。
プレミアム・エクストラバージン輸出の急拡大オリーブ
生産者がバルク販売から瓶詰めされたトレーサブルな形態に軸足を移しているため、スペインからインドへの出荷量は2023年初頭に最高値を記録しました。デオレオのIBM Food Trustとの提携により、消費者がQRコードをスキャンして原産地を確認できるようになり、プレミアム価格をサポート。コールドチェーンの改善と耐光パッケージングにより、長距離輸送中のフェノール類が保護され、東南アジアと北米にゲートウェイが開かれます。チュニジアの輸出業者もこれに追随し、官僚的なハードルにもかかわらずブランドボトルにシフトしています。伝統的な一次産品メーカーは、より利益率の高いニッチを追い求め、競合は激化しています。
気候による二年苗の不安定性
温暖な季節は開花を妨げ、果実の成熟を長引かせ、油分を減少させ、交互着果の変動を大きくします。地中海沿岸の降雨量は、今世紀半ばまでにさらに7~9%減少し、天水栽培の収量は7%も減少する可能性があります。加工業者は不安定な原料フローに直面し、価格高騰は大衆市場においてより安価な種子油への代替を誘発します。育種プログラムは耐性形質を追求しているが、商業的展開には10年以上かかります。
セグメント分析
砕油品種は2024年のオリーブ市場シェアの72.40%を占め、消費者の液体フォーマットへの嗜好と加工業者の工業的処理効率への依存を浮き彫りにしています。健康志向の間食がアジアで支持されるにつれて、2030年までのCAGRは6.80%となり、オリーブ市場全体の成長を上回ると予測されます。スペインでは2024/25年シーズンに141万トンが収穫され、その大半は破砕機向けです。また、生産者は兼用品種を採用し、相対価格が変動したときに配分を切り替えています。ラベリング改革とポリフェノール保持技術が品質基準を引き上げ、量販店向けブレンドをより高いフェノール基準へと押し上げています。表ーオリーブ加工業者は、利便性の高い購買層を惹きつけるために、分量管理されたパウチと低塩分硬化を展開しています。QRを利用した産地証明のチェックは、真正性の主張をさらに強化し、グルメ店舗でのプレミアム商品棚価格を5~6%上昇させる。
オリーブ市場セグメンテーションレポートは、製品用途別(砕油オリーブ、その他)、認証状況別(有機認証、その他)、地域別(北米、その他)に分類されています。生産(数量)、消費(金額と数量)、輸入(金額と数量)、輸出(金額と数量)、価格動向の分析を含んでいます。市場予測は金額(米ドル)と数量(メトリックトン)で提供されます。
地域分析
欧州は2024年にオリーブ世界市場の39.50%を占め、これはEUの生産が好天に恵まれて31%増加したためです。欧州のオリーブ市場の強さは、深い加工能力、長年の貿易ネットワーク、厳格な品質管理によって世界的にプレミアムな地位を確立していることにあります。2024/25年の生産量は、スペインが降雨パターンを正常に戻し、超高密度の作付面積が拡大したことも手伝って、200万トンになると予想されます。それでも生産者は労働力不足の深刻化と闘っています。2024年にはセビリアの果実の15%が未収穫となり、機械式シェーカーやロボットの採用が広まりました。
アジア太平洋はCAGR 6.20%で最も急成長している地域であり、インドの消費増加が牽引しています。アジア太平洋は、近代的な小売チェーンやフードサービスの拡大を通じて健康志向の消費者を取り込み、急速な軌道を続けています。スペインの輸出業者はインドのボトル入り輸入の約82%を占めており、45%の基本関税と5%のGSTにもかかわらず、先行者利益を示しています。ムンバイとデリーのホスピタリティ・チャンネルは、都市部におけるオリーブオイル使用の40%を占めており、インドネシアの成長は、ソーシャルメディア・ストーリーテリングを活用してブランド・エクイティを構築するアンダルシアの生産者を惹きつけています。
2025年4月に予定されている10%の関税により、流通業者は北アフリカのバルク・サプライヤーを含む複数の原産地との契約を追求するようになります。これとは対照的に、干ばつによりモロッコの2024/25年の収穫量は9万トンに減少し、5年間の標準である14万1,600トンを大幅に下回っています。
その他の特典:
- エクセル形式の市場予測(ME)シート
- 3ヶ月間のアナリスト・サポート
よくあるご質問
目次
第1章 イントロダクション
- 調査の前提条件と市場の定義
- 調査範囲
第2章 調査手法
第3章 エグゼクティブサマリー
第4章 市場情勢
- 市場概要
- 市場促進要因
- 食生活に関連した地中海式ダイエットへの移行
- 高級エクストラバージンオリーブ輸出の急速な拡大
- 心臓代謝疾患の負担増加が需要を押し上げる
- 多年生作物に対する政府の持続可能性補助金
- 灌漑不足の乾燥地を超高密度(SHD)果樹園に転換
- ブロックチェーンベースの専門オークションにおける来歴プレミアム
- 市場抑制要因
- 気候による2年ごとのベアリング変動
- キシレラ・ファスティディオサおよびバーティシリウム萎凋病病原菌の蔓延
- 北アフリカの豊作による価格下落
- 地中海沿岸地域で農業労働力不足が深刻化
- バリューチェーン/サプライチェーン分析
- 規制情勢
- テクノロジーの展望
- PESTEL分析
第5章 市場規模と成長予測(価値と量)
- 製品用途別
- オリーブの搾油
- テーブルオリーブ
- 二重目的品種
- 認定ステータス別
- オーガニック認証
- 従来型
- その他
- 地域別(生産量分析、消費量・金額分析、輸入量・金額分析、輸出量・金額分析、価格動向分析)
- 北米
- 米国
- カナダ
- 南米
- アルゼンチン
- ブラジル
- チリ
- 欧州
- スペイン
- ギリシャ
- イタリア
- トルコ
- ポルトガル
- フランス
- ドイツ
- ロシア
- アジア太平洋地域
- 中国
- インド
- オーストラリア
- 中東
- エジプト
- アフリカ
- モロッコ
- チュニジア
- アルジェリア
- 北米
第6章 競合情勢
- List of Stakeholders
- Dcoop S. Coop.
- Deoleo(CVC Capital Partners)
- Sovena Group
- Borges Agricultural & Industrial Nuts, S.A.(Borges International Group)
- California Olive Ranch. Inc
- Colavita S.p.A.
- Almazaras de la Subbetica
- Aceites Maeva
- Olivar de Segura
- Ybarra
- Migasa
- Filippo Berio(GRUPPO SALOV)
- Acesur
- Iberica Olive Line S.L.U(Olive Line International)

