
|
市場調査レポート
商品コード
1693874
英国の乳製品-市場シェア分析、産業動向と統計、成長予測(2025年~2030年)United Kingdom Dairy - Market Share Analysis, Industry Trends & Statistics, Growth Forecasts (2025 - 2030) |
||||||
カスタマイズ可能
適宜更新あり
|
|||||||
| 英国の乳製品-市場シェア分析、産業動向と統計、成長予測(2025年~2030年) |
|
出版日: 2025年03月18日
発行: Mordor Intelligence
ページ情報: 英文 251 Pages
納期: 2~3営業日
|

全表示
- 概要
- 目次
概要
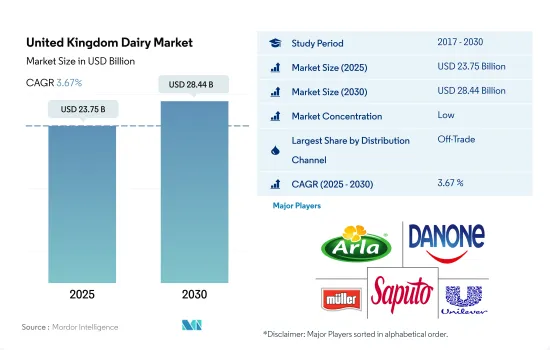
英国の乳製品市場規模は2025年に237億5,000万米ドルと推定・予測され、2030年には284億4,000万米ドルに達し、予測期間中(2025~2030年)のCAGRは3.67%で成長すると予測されます。
組織小売チャネルの強力な浸透が市場成長を促進
- 英国では、乳製品が消費される主要チャネルは非商業流通チャネルです。商外チャネルのサブタイプの中では、スーパーマーケットとハイパーマーケットが主要チャネルです。事業拡大やスーパーマーケットやハイパーマーケットの増加などの要因とともに、これらの小売業態の成長は、英国の乳製品市場にプラスの影響を与えました。2022年現在、テスコは全国に合計2,823のスーパーセンターを展開しています。
- テスコ、セインズベリー、アズダ、モリソンズ、リディなど、さまざまなスーパーマーケットやハイパーマーケットチェーンは、消費者を囲い込むためにロイヤルティ特典を提供しています。2021年の食料品市場では、テスコとセインズベリーが43%のシェアを占め、最大でした。
- オンラインショッピングに関しては、英国は欧州の主要市場です。流通チャネルとしてのオンライン小売店は、国中で人気を集めています。2021年、英国におけるeコマース全体の売上は、2020年の1,350億米ドルから1,560億米ドルに達します。
- 2020年、英国では外食チャネルの需要減少により、オントレード流通チャネル向け乳製品の成長動向に急激な落ち込みが見られました。COVID-19以降、市場は急速に回復しています。これは、アジア料理、アメリカ料理、中華料理、日本料理、タイ料理など、さまざまなエスニック料理を提供するレストランの頻度が増えていることと、外国人人口の増加によるものです。英国におけるレストランとカフェへの支出は、2020年の781億6,000万米ドルに対し、2021年には1,113億4,000万米ドルに達しました。
英国の乳製品市場動向
ピザ、モッツァレラ入り焼きマカロニ、その他のチーズやバターベースの製品など、焼き食品の需要の高まりがチーズ消費を牽引しています。
- 2022年、英国における乳製品の一人当たり消費量は2021年比で2%の伸びを示しました。この成長は、消費者の間でベーカリー製品に対する需要が高まっていることに起因しています。ベーカリー製品の中には、乳製品を使ったデザート(ムースやチーズケーキ)もあります。英国におけるチーズケーキの一人当たり消費量は0.93kgと推定されます。乳製品デザートなどの需要を考慮し、同国は過去3年間で乳製品の輸入を増やしました。2022年には1,171万トンの乳製品を輸入し、2021年と比較して4.35%の伸び率となりました。
- ピザ、モルタデッラ入り焼きマカロニなど、チーズを使った焼き食品の需要が高まる中、同地域ではチーズの需要が高まっています。消費者の間でのチーズ需要の高まりにより、2022年にはチーズ価格の一貫した変動が観察されました。2022年、チーズ価格は2021年と比較して32.35%の成長率を観測しました。
- 欧州の消費者は、クッキーやクランチーのようなバターベースのスナック製品の消費に移行しています。その結果、バターの輸入量が増加しています。バター需要の増加に伴い、バター価格も大きく変動し、1kgあたり207.99英ポンドに達しました。1トンの平均価格はバーミンガムとロンドンで28万8,456.87米ドルです。2023年の英国におけるバターのおおよその価格帯は、キログラム当たり288.46米ドルから5.88米ドル、またはポンド(lb)当たり130.84米ドルから2.67米ドルです。
英国の乳製品産業概要
英国の乳製品市場はセグメント化されており、上位5社で19.77%を占めています。この市場の主要企業は、Arla Foods、Danone SA、Muller Group、Saputo Inc.、Unilever PLCなどです。
その他の特典
- エクセル形式の市場予測(ME)シート
- 3ヶ月のアナリストサポート
目次
第1章 エグゼクティブサマリーと主要調査結果
第2章 レポートのオファー
第3章 イントロダクション
- 調査の前提条件と市場定義
- 調査範囲
- 調査手法
第4章 主要産業動向
- 一人当たり消費量
- 原料/商品生産量
- バター
- チーズ
- 牛乳
- 規制の枠組み
- 英国
- バリューチェーンと流通チャネル分析
第5章 市場セグメンテーション
- カテゴリー
- バター
- 製品タイプ別
- 培養バター
- 未加工バター
- チーズ
- 製品タイプ別
- 天然チーズ
- プロセスチーズ
- クリーム
- 製品タイプ別
- ダブルクリーム
- シングルクリーム
- ホイップクリーム
- その他
- 乳製品デザート
- 製品タイプ別
- チーズケーキ
- フローズンデザート
- アイスクリーム
- ムース
- その他
- 牛乳
- 製品タイプ別
- コンデンスミルク
- フレーバーミルク
- フレッシュミルク
- 粉ミルク
- UHTミルク
- サワーミルクドリンク
- ヨーグルト
- 製品タイプ別
- フレーバーヨーグルト
- ノンフレーバーヨーグルト
- バター
- 流通チャネル
- オフトレード
- コンビニエンスストア
- オンライン小売
- 専門小売店
- スーパーマーケットとハイパーマーケット
- その他(倉庫クラブ、ガソリンスタンドなど)
- オントレード
- オフトレード
第6章 競合情勢
- 主要な戦略動向
- 市場シェア分析
- 企業情勢
- 企業プロファイル
- Arla Foods
- Bel Group
- Dale Farm Cooperative Limited
- Danone SA
- Glanbia PLC
- Kingcott Dairy
- Muller Group
- Ornua Co-Operative Limited
- Saputo Inc.
- Unilever PLC
第7章 CEOへの主要戦略的質問
第8章 付録
- 世界概要
- 概要
- ファイブフォース分析フレームワーク
- 世界のバリューチェーン分析
- 市場力学(DROs)
- 情報源と参考文献
- 図表一覧
- 主要な洞察
- データパック
- 用語集
目次
Product Code: 50000743
The United Kingdom Dairy Market size is estimated at 23.75 billion USD in 2025, and is expected to reach 28.44 billion USD by 2030, growing at a CAGR of 3.67% during the forecast period (2025-2030).
Strong penetration of organized retail channels fueling the market growth
- In the United Kingdom, the off-trade distribution channel is the primary channel through which dairy products are more consumed in the country. Of all the sub-types of the off-trade channel, supermarkets and hypermarkets are the major channels. The growth of these retail formats, along with factors like business expansion and the increase in supermarkets and hypermarkets, positively impacted the dairy products market in the United Kingdom. As of 2022, Tesco has a total of 2,823 supercenter stores throughout the country.
- Different supermarket and hypermarket chains, like Tesco, Sainsbury, Asda, Morrisons, and Lidi, offer loyalty benefits to retain consumers. Tesco and Sainsbury's had the largest share, with a 43% share of the grocery market in 2021.
- The United Kingdom is the leading market in Europe when it comes to online shopping. Online retail stores as a sales channel are gaining popularity across the country. In 2021, the overall revenue of e-commerce in the United Kingdom reached a total of USD 156 billion from USD 135 billion in 2020.
- In 2020, there was a sudden fall in the growth trend of dairy products for the on-trade distribution channel in the United Kingdom due to the decline in the demand for foodservice channels. Post-COVID-19, the market has witnessed a speedy recovery. This is due to the increasing frequency of restaurants offering various ethnic foods, such as Asian, American, Chinese, Japanese, and Thai cuisines, coupled with a growing expat population. Spending on restaurants and cafes in the United Kingdom reached USD 111.34 billion in 2021 compared to USD 78.16 billion in 2020.
United Kingdom Dairy Market Trends
The rising demand for baked foods, including pizza, baked macaroni with mozzarella, and other cheese and butter-based products, is driving cheese consumption
- In 2022, the per capita consumption of dairy products in the United Kingdom witnessed a growth of 2% compared to 2021. The growth was attributed to the rising demand for bakery products among consumers. Some of these bakery products are dairy desserts (mousses and cheesecakes). The per capita consumption of cheesecakes in the United Kingdom was estimated at 0.93 kg. Considering the demand for dairy desserts and other products, the country increased its dairy imports in the last three years. In 2022, the country imported 11.71 million metric tons of dairy products, a growth rate of 4.35% compared to 2021.
- With the rising demand for baked foods, including pizza, baked macaroni with mortadella, and other cheese-based products, the demand for cheese is rising in the region. Due to the rising demand for cheese among consumers, consistent fluctuation in the prices of cheese was observed in 2022. In 2022, cheese prices observed a growth rate of 32.35% compared to 2021.
- Consumers in Europe are moving toward the consumption of butter-based snack products, such as cookies and crunchies. As a result, the import volume of butter has increased. With the growing demand for butter, there was a significant fluctuation in butter prices, which reached GBP 207.99 per kg. The average price for a tonne is USD 288,456.87 in Birmingham and London. In 2023, the approximate price range for butter in the United Kingdom is between USD 288.46 and USD 5.88 per kilogram or between USD 130.84 and USD 2.67 per pound (lb).
United Kingdom Dairy Industry Overview
The United Kingdom Dairy Market is fragmented, with the top five companies occupying 19.77%. The major players in this market are Arla Foods, Danone SA, Muller Group, Saputo Inc. and Unilever PLC (sorted alphabetically).
Additional Benefits:
- The market estimate (ME) sheet in Excel format
- 3 months of analyst support
TABLE OF CONTENTS
1 EXECUTIVE SUMMARY & KEY FINDINGS
2 REPORT OFFERS
3 INTRODUCTION
- 3.1 Study Assumptions & Market Definition
- 3.2 Scope of the Study
- 3.3 Research Methodology
4 KEY INDUSTRY TRENDS
- 4.1 Per Capita Consumption
- 4.2 Raw Material/commodity Production
- 4.2.1 Butter
- 4.2.2 Cheese
- 4.2.3 Milk
- 4.3 Regulatory Framework
- 4.3.1 United Kingdom
- 4.4 Value Chain & Distribution Channel Analysis
5 MARKET SEGMENTATION (includes market size in Value in USD and Volume, Forecasts up to 2030 and analysis of growth prospects)
- 5.1 Category
- 5.1.1 Butter
- 5.1.1.1 By Product Type
- 5.1.1.1.1 Cultured Butter
- 5.1.1.1.2 Uncultured Butter
- 5.1.2 Cheese
- 5.1.2.1 By Product Type
- 5.1.2.1.1 Natural Cheese
- 5.1.2.1.2 Processed Cheese
- 5.1.3 Cream
- 5.1.3.1 By Product Type
- 5.1.3.1.1 Double Cream
- 5.1.3.1.2 Single Cream
- 5.1.3.1.3 Whipping Cream
- 5.1.3.1.4 Others
- 5.1.4 Dairy Desserts
- 5.1.4.1 By Product Type
- 5.1.4.1.1 Cheesecakes
- 5.1.4.1.2 Frozen Desserts
- 5.1.4.1.3 Ice Cream
- 5.1.4.1.4 Mousses
- 5.1.4.1.5 Others
- 5.1.5 Milk
- 5.1.5.1 By Product Type
- 5.1.5.1.1 Condensed milk
- 5.1.5.1.2 Flavored Milk
- 5.1.5.1.3 Fresh Milk
- 5.1.5.1.4 Powdered Milk
- 5.1.5.1.5 UHT Milk
- 5.1.6 Sour Milk Drinks
- 5.1.7 Yogurt
- 5.1.7.1 By Product Type
- 5.1.7.1.1 Flavored Yogurt
- 5.1.7.1.2 Unflavored Yogurt
- 5.1.1 Butter
- 5.2 Distribution Channel
- 5.2.1 Off-Trade
- 5.2.1.1 Convenience Stores
- 5.2.1.2 Online Retail
- 5.2.1.3 Specialist Retailers
- 5.2.1.4 Supermarkets and Hypermarkets
- 5.2.1.5 Others (Warehouse clubs, gas stations, etc.)
- 5.2.2 On-Trade
- 5.2.1 Off-Trade
6 COMPETITIVE LANDSCAPE
- 6.1 Key Strategic Moves
- 6.2 Market Share Analysis
- 6.3 Company Landscape
- 6.4 Company Profiles (includes Global Level Overview, Market Level Overview, Core Business Segments, Financials, Headcount, Key Information, Market Rank, Market Share, Products and Services, and Analysis of Recent Developments).
- 6.4.1 Arla Foods
- 6.4.2 Bel Group
- 6.4.3 Dale Farm Cooperative Limited
- 6.4.4 Danone SA
- 6.4.5 Glanbia PLC
- 6.4.6 Kingcott Dairy
- 6.4.7 Muller Group
- 6.4.8 Ornua Co-Operative Limited
- 6.4.9 Saputo Inc.
- 6.4.10 Unilever PLC
7 KEY STRATEGIC QUESTIONS FOR DAIRY AND DAIRY ALTERNATIVE CEOS
8 APPENDIX
- 8.1 Global Overview
- 8.1.1 Overview
- 8.1.2 Porter's Five Forces Framework
- 8.1.3 Global Value Chain Analysis
- 8.1.4 Market Dynamics (DROs)
- 8.2 Sources & References
- 8.3 List of Tables & Figures
- 8.4 Primary Insights
- 8.5 Data Pack
- 8.6 Glossary of Terms

