
|
市場調査レポート
商品コード
1693774
アジア太平洋の有機肥料:市場シェア分析、産業動向、成長予測(2025年~2030年)Asia-Pacific Organic Fertilizer - Market Share Analysis, Industry Trends & Statistics, Growth Forecasts (2025 - 2030) |
||||||
カスタマイズ可能
適宜更新あり
|
|||||||
| アジア太平洋の有機肥料:市場シェア分析、産業動向、成長予測(2025年~2030年) |
|
出版日: 2025年03月18日
発行: Mordor Intelligence
ページ情報: 英文 172 Pages
納期: 2~3営業日
|

全表示
- 概要
- 目次
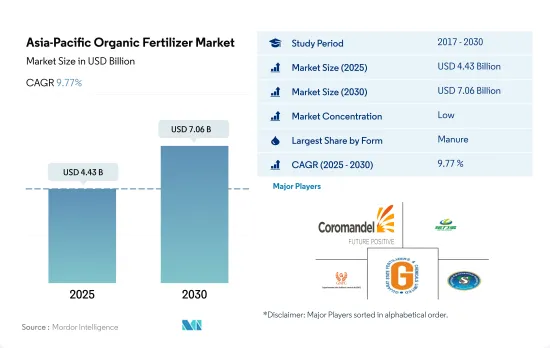
アジア太平洋の有機肥料市場規模は、2025年に44億3,000万米ドルと推定され、2030年には70億6,000万米ドルに達すると予測され、予測期間中(2025~2030年)のCAGRは9.77%で成長すると予測されます。
- 有機肥料は、アジア太平洋で農業用生物肥料の中で最も消費されている肥料です。有機肥料は2022年にアジア太平洋農業生物製剤市場額の約45.8%を占めたが、これは主に有機農業とプラクティス農業で大量に使用されるためです。
- 同地域では、主に畑作物、換金作物、果物・野菜など、あらゆる種類の作物に適していることから、プラクティス農法と有機農法の両方において、たい肥の利用が優勢で、2022年の市場規模は16億7,000万米ドルでした。肥料はまた、種まき前の土壌の物理化学的特性を改善するために使用され、さらに必要性に応じて作物のさまざまな成長段階でも使用されます。
- 食事ベースの有機肥料の消費量は、2022年には9億2,740万米ドルと評価されました。これらの肥料は、肥料に比べて高い栄養分を含んでいます。血粉や角粉のようなミールベースの肥料は、他のミールベースの肥料に比べてリン含有量が高く、換金作物に最適です。
- 2022年の油かす有機肥料の消費額は1,870万米ドルと評価されました。これらの肥料は栄養分の放出が遅いため、園芸作物に最適です。
- インドや中国のようなこの地域の主要な農業国は、有機農業とサステイナブル農業投入物の適用を促進する様々なプログラムやスキームを開始しています。有機作物の栽培面積の拡大と有機商品に対する需要の高まりが、2023~2029年にかけてアジア太平洋の有機肥料市場を牽引する可能性があります。
- アジア太平洋は、世界の有機農業と有機肥料市場において急速にホットスポットとなりつつあります。米、サトウキビ、新鮮果物や野菜のような主要な有機作物は、この地域全体で栽培されています。中国とインドは有機生産のリーダーとして台頭してきています。この2カ国は有機農業の栽培面積が多いこれらの国の総農業面積に占める割合はまだ2.0%以下です。
- この地域ではここ数年、有機農業面積が大幅に増加しており、2017年の490万ヘクタールから2021年には690万ヘクタールへと拡大しています。この増加傾向が有機肥料の需要を牽引しており、2029年までに73.1%増加すると推定されています。
- アジア太平洋のほとんどの国では連作作物が優勢で、有機作物総面積の約67.7%を占めています。この優位性により、連作作物の有機肥料の消費量が最も多く、2022年にはアジア太平洋の消費量の79.7%を占めることになります。
- さまざまな政府機関が、有機肥料に対する奨励金の支給など、さまざまな制度やプログラムを通じて有機農法やサステイナブル農法を奨励しています。この動向は、同地域における有機肥料の需要を促進すると予想されます。
- アジア太平洋は、有機農業と有機肥料市場の大幅な成長を目の当たりにしています。この地域では有機農業の面積が増加しており、政府の様々な優遇措置と相まって、2023~2029年にかけてこの地域の有機肥料の需要を牽引すると予想されます。
アジア太平洋の有機肥料市場動向
中国、インド、インドネシア、オーストラリアなどの国々における政府支援の拡大がこの地域の有機農業を後押し
- FiBLの統計によれば、アジア太平洋の有機農地面積は2021年には370万haを超え、世界の有機農地面積の26.4%を占めました。有機栽培面積は2017~2022年の間に19.3%増加しました。2020年時点で、この地域の有機生産者は183万人で、インドが130万人でトップです。中国、インド、インドネシア、オーストラリアは、この地域で有機栽培面積が大きい主要国です。中国やインドなどの政府当局は、作物栽培における化学品への依存を減らすため、有機農業を絶えず推進しています。例えば、インドはParamparagat Krishi Vikas YojanaやAll India Network Programme on Organic Farming(AI-NPOF)のような制度を実施しています。
- 2021年には、中国が250万haで66.1%の最大シェアを占め、次いでインドが19.3%、インドネシアが1.5%、オーストラリアが1.4%でした。全有機農地は、連作作物、園芸作物、換金作物の3つの作物タイプに分けられます。連作作物はこの地域の有機農地の67.5%、すなわち2021年には250万haを占め、大きなシェアを占めています。この地域で栽培されている主要連作作物には、水稲、小麦、豆類、大豆、雑穀が含まれます。
- 換金作物のシェアは第2位で、2021年には70万haとなり、有機農地の18.5%を占めます。砂糖や有機茶のような有機換金作物への需要は世界的に増加しています。中国とインドは、それぞれ最大の有機緑茶と有機紅茶の生産国です。国際的な需要の高まりにより、この地域の有機栽培面積は増加すると予想されます。
オーガニック製品への1人当たり支出はオーストラリアが圧倒的に多く、中国のオーガニック食品市場が大きく成長
- この地域のオーガニック製品に対する1人当たり支出は、2021年には85.1米ドルを記録しました。オーストラリアでは、オーガニック製品に対する一人当たり支出が58.3米ドルと、同年の方が高かったが、これはオーガニック食品は健康によいという消費者の認識による需要の高まりに起因しています。Global Organic Tradeのデータによると、オーストラリアの有機包装飲食品市場は、2021年には8億8,520万米ドルとなりました。
- 中国のオーガニック食品市場は2021年に13.3%成長し、2023~2029年にかけてのCAGRは7.1%と、プラス成長パターンが続くと予想されます。若い世代の間でオーガニック製品の重要性が重視されるようになり、また、母親の就労数の増加や健康とウェルネスの動向の採用増加によりオーガニックベビーフードの需要が高まっていることから、オーガニック製品は2025年までに64億米ドルの規模に達すると予想されます。
- インドのオーガニック製品は世界需要の1.0%に遠く及ばず、2021年の1人当たり支出額はわずか0.08米ドルです。しかし、インド市場は今後数年で成長し、2025年には1億5,330万米ドルに達する可能性があります。現在、この地域のオーガニック商品市場は非常にセグメント化されており、一部のスーパーマーケットや専門店だけがオーガニック商品を販売しています。消費者の知識の増大と購買パターンの変化によって、この地域の有機食品の持続可能性に対する理解が深まる可能性があります。1人当たり所得の増加と有機食品の重要性に対する消費者の意識の向上によって、アジア太平洋の有機食品に対する1人当たり支出が増加する可能性があります。
アジア太平洋の有機肥料産業概要
アジア太平洋の有機肥料市場はセグメント化されており、上位5社で6.60%を占めています。この市場の主要企業は、Coromandel International Ltd、Genliduo Bio-tech Corporation Ltd、Gujarat Narmada Valley Fertilizers & Chemicals Ltd、Gujarat State Fertilizers & Chemicals Ltd、Swaroop Agrochemical Industriesなどです。
その他の特典
- エクセル形式の市場予測(ME)シート
- 3ヶ月のアナリストサポート
目次
第1章 エグゼクティブサマリーと主要調査結果
第2章 レポートのオファー
第3章 イントロダクション
- 調査の前提条件と市場定義
- 調査範囲
- 調査手法
第4章 主要産業動向
- 有機栽培面積
- 一人当たりのオーガニック製品への支出
- 規制の枠組み
- オーストラリア
- 中国
- インド
- インドネシア
- 日本
- フィリピン
- タイ
- ベトナム
- バリューチェーンと流通チャネル分析
第5章 市場セグメンテーション
- 形態
- 肥料
- ミールベース肥料
- オイルケーキ
- その他の有機肥料
- 作物タイプ
- 換金作物
- 園芸作物
- 畑作物
- 生産国
- オーストラリア
- 中国
- インド
- インドネシア
- 日本
- フィリピン
- タイ
- ベトナム
- その他のアジア太平洋
第6章 競合情勢
- 主要な戦略動向
- 市場シェア分析
- 企業情勢
- 企業プロファイル
- Biolchim SpA
- Coromandel International Ltd
- Deepak Fertilisers & Petrochemicals Corp. Ltd
- Genliduo Bio-tech Corporation Ltd
- Gujarat Narmada Valley Fertilizers & Chemicals Ltd
- Gujarat State Fertilizers & Chemicals Ltd
- Prabhat Fertilizer And Chemical Works
- Shandong Nongda Fertilizer Sci.& Tech. Co. Ltd(NDFY)
- Sustane Natural Fertilizer Inc.
- Swaroop Agrochemical Industries
第7章 CEOへの主要戦略的質問
第8章 付録
- 世界概要
- 概要
- ファイブフォース分析フレームワーク
- 世界のバリューチェーン分析
- 市場力学(DROs)
- 情報源と参考文献
- 図表一覧
- 主要な洞察
- データパック
- 用語集
The Asia-Pacific Organic Fertilizer Market size is estimated at 4.43 billion USD in 2025, and is expected to reach 7.06 billion USD by 2030, growing at a CAGR of 9.77% during the forecast period (2025-2030).
- Organic fertilizers are the most consumed fertilizers in Asia-Pacific under agricultural biologicals. Organic fertilizers accounted for about 45.8% of the Asia-Pacific agriculture biologicals market value in 2022, mainly due to their application in bulk quantities in organic and conventional farming.
- Manure application was dominant in the region, valued at USD 1.67 billion in 2022, mainly due to its suitability to all types of crops, including field crops, cash crops, and fruits and vegetables, both in conventional and organic farming. Manures are also used to improve the physio-chemical properties of the soil before taking up the seed sowing and even at different growth stages of the crop based on the requirement.
- The consumption of meal-based organic fertilizers was valued at USD 927.4 million in 2022. These fertilizers have high nutrient content compared to manures. Meal-based fertilizers like blood and horn meal have higher phosphorus content compared to other meal-based fertilizers, and they are best suited for cash crops.
- The consumption value of oil cake organic fertilizers was valued at USD 18.7 million in 2022. These fertilizers are best suited in horticultural crops due to their slow release of nutrients.
- Major agricultural countries in the region, like India and China, have initiated various programs or schemes promoting organic farming and the application of sustainable agricultural inputs. The growing organic crop cultivation areas and the rising demand for organic commodities may drive the Asia-Pacific organic fertilizer market between 2023 and 2029.
- The Asia-Pacific region is rapidly becoming a hotspot in the global organic farming and organic fertilizer market. Major organic crops, like rice, sugarcane, and fresh fruits and vegetables, are grown across the region. China and India are emerging as leaders in organic production. While these two countries have a higher area under organic farming, it still accounts for less than 2.0% of the total agricultural area in these countries.
- The region has seen a significant increase in organic farming area over the last few years, growing from 4.9 million hectares in 2017 to 6.9 million hectares in 2021. This rising trend is driving the demand for organic fertilizers, which is estimated to increase by 73.1% by 2029.
- Row crops dominate most countries in the Asia-Pacific region, accounting for about 67.7% of the total organic crop area. This dominance resulted in row crops having the highest consumption of organic fertilizers, accounting for a 79.7% share of the Asia-Pacific region's consumption by value in 2022.
- Various government bodies are encouraging organic or sustainable farming methods through various schemes or programs, including offering incentives for organic fertilizers. This trend is expected to drive the demand for organic fertilizers in the region.
- The Asia-Pacific region is witnessing substantial growth in the organic farming and organic fertilizer market. The region's increasing organic farming area, combined with various government incentives, is expected to drive the demand for organic fertilizers in the region between 2023 and 2029.
Asia-Pacific Organic Fertilizer Market Trends
Growing government support in countries like China, India, Indonesia, and Australia, boosts organic farming in the region
- The area of organic agricultural land in Asia-Pacific was over 3.7 million ha in 2021, representing 26.4% of the global organic area, as per FiBL statistics. The organic area under cultivation grew by 19.3% between 2017-2022. As of 2020, the region had 1.83 million organic producers, with India topping the list with 1.3 million organic producers. China, India, Indonesia, and Australia are the major countries with large organic cultivation areas in the region. Government authorities in countries like China and India are constantly promoting organic agriculture to reduce reliance on chemical inputs for crop cultivation. For instance, India has implemented schemes like Paramparagat Krishi Vikas Yojana and the All India Network Programme on Organic Farming (AI-NPOF).
- In 2021, China accounted for a maximum share of 66.1%, with 2.5 million ha, followed by India, Indonesia, and Australia, with 19.3%, 1.5%, and 1.4%, respectively. The total organic land is divided into three crop types, namely row crops, horticultural crops, and cash crops. Row crops occupy a major share of organic agricultural land in the region, accounting for 67.5% share, i.e., 2.5 million ha in 2021. The major row crops grown in the region include paddy, wheat, pulses, soybeans, and millets.
- Cash crops held the second largest share, with 0.7 million ha in 2021, accounting for an 18.5% share of organic cropland. The demand for organic cash crops like sugar and organic tea is increasing worldwide. China and India are the largest organic green and black tea producers, respectively. The growing international demand is expected to increase the organic acreages in the region.
Per capita spending on organic product predominant in Australia and China's organic food market growing significantly
- The per capita spending on organic products in the region was recorded at USD 85.1 in 2021. Australia witnessed a higher per capita spending on organic products, with USD 58.3 in the same year, attributed to the higher demand due to consumers' perception of organic food as healthy. As per the Global Organic Trade data, the organic packaged food and beverage market in Australia was valued at USD 885.2 million in 2021.
- China's organic food market grew by 13.3% in 2021, and the positive growth pattern is expected to continue, with a CAGR of 7.1% between 2023 and 2029. With an increasing emphasis on the importance of organic products among the younger generation and the rising demand for organic baby food due to the growing number of mothers in the workforce and the increasing adoption of the health and wellness trend, organic products are expected to reach a value of USD 6.4 billion by 2025.
- Organic products in India represent far less than 1.0% of global demand, with a per capita expenditure of just USD 0.08 in 2021. However, the Indian market may grow over the coming years, reaching a value of USD 153.3 million by 2025. Currently, the region's organic goods market is highly fragmented, with just a few supermarkets and specialty stores selling them, as people from higher-income families are the only potential customers. Growing consumer knowledge and changing buying patterns may lead to a better understanding of organic food sustainability in the region. Increasing per capita income and increased consumer awareness of the importance of organic food can raise per capita expenditure on organic food items in the Asia-Pacific region.
Asia-Pacific Organic Fertilizer Industry Overview
The Asia-Pacific Organic Fertilizer Market is fragmented, with the top five companies occupying 6.60%. The major players in this market are Coromandel International Ltd, Genliduo Bio-tech Corporation Ltd, Gujarat Narmada Valley Fertilizers & Chemicals Ltd, Gujarat State Fertilizers & Chemicals Ltd and Swaroop Agrochemical Industries (sorted alphabetically).
Additional Benefits:
- The market estimate (ME) sheet in Excel format
- 3 months of analyst support
TABLE OF CONTENTS
1 EXECUTIVE SUMMARY & KEY FINDINGS
2 REPORT OFFERS
3 INTRODUCTION
- 3.1 Study Assumptions & Market Definition
- 3.2 Scope of the Study
- 3.3 Research Methodology
4 KEY INDUSTRY TRENDS
- 4.1 Area Under Organic Cultivation
- 4.2 Per Capita Spending On Organic Products
- 4.3 Regulatory Framework
- 4.3.1 Australia
- 4.3.2 China
- 4.3.3 India
- 4.3.4 Indonesia
- 4.3.5 Japan
- 4.3.6 Philippines
- 4.3.7 Thailand
- 4.3.8 Vietnam
- 4.4 Value Chain & Distribution Channel Analysis
5 MARKET SEGMENTATION (includes market size in Value in USD and Volume, Forecasts up to 2030 and analysis of growth prospects)
- 5.1 Form
- 5.1.1 Manure
- 5.1.2 Meal Based Fertilizers
- 5.1.3 Oilcakes
- 5.1.4 Other Organic Fertilizers
- 5.2 Crop Type
- 5.2.1 Cash Crops
- 5.2.2 Horticultural Crops
- 5.2.3 Row Crops
- 5.3 Country
- 5.3.1 Australia
- 5.3.2 China
- 5.3.3 India
- 5.3.4 Indonesia
- 5.3.5 Japan
- 5.3.6 Philippines
- 5.3.7 Thailand
- 5.3.8 Vietnam
- 5.3.9 Rest of Asia-Pacific
6 COMPETITIVE LANDSCAPE
- 6.1 Key Strategic Moves
- 6.2 Market Share Analysis
- 6.3 Company Landscape
- 6.4 Company Profiles (includes Global Level Overview, Market Level Overview, Core Business Segments, Financials, Headcount, Key Information, Market Rank, Market Share, Products and Services, and Analysis of Recent Developments).
- 6.4.1 Biolchim SpA
- 6.4.2 Coromandel International Ltd
- 6.4.3 Deepak Fertilisers & Petrochemicals Corp. Ltd
- 6.4.4 Genliduo Bio-tech Corporation Ltd
- 6.4.5 Gujarat Narmada Valley Fertilizers & Chemicals Ltd
- 6.4.6 Gujarat State Fertilizers & Chemicals Ltd
- 6.4.7 Prabhat Fertilizer And Chemical Works
- 6.4.8 Shandong Nongda Fertilizer Sci.&Tech. Co. Ltd (NDFY)
- 6.4.9 Sustane Natural Fertilizer Inc.
- 6.4.10 Swaroop Agrochemical Industries
7 KEY STRATEGIC QUESTIONS FOR AGRICULTURAL BIOLOGICALS CEOS
8 APPENDIX
- 8.1 Global Overview
- 8.1.1 Overview
- 8.1.2 Porter's Five Forces Framework
- 8.1.3 Global Value Chain Analysis
- 8.1.4 Market Dynamics (DROs)
- 8.2 Sources & References
- 8.3 List of Tables & Figures
- 8.4 Primary Insights
- 8.5 Data Pack
- 8.6 Glossary of Terms
