
|
市場調査レポート
商品コード
1693733
米国の飼料用アミノ酸-市場シェア分析、産業動向、統計、成長予測(2025年~2030年)United States Feed Amino Acids - Market Share Analysis, Industry Trends & Statistics, Growth Forecasts (2025 - 2030) |
||||||
カスタマイズ可能
適宜更新あり
|
|||||||
| 米国の飼料用アミノ酸-市場シェア分析、産業動向、統計、成長予測(2025年~2030年) |
|
出版日: 2025年03月18日
発行: Mordor Intelligence
ページ情報: 英文 187 Pages
納期: 2~3営業日
|

全表示
- 概要
- 目次
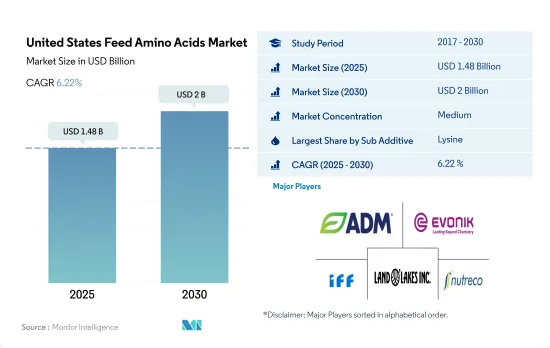
米国の飼料用アミノ酸市場規模は2025年に14億8,000万米ドルと推定され、2030年には20億米ドルに達し、予測期間中(2025~2030年)のCAGRは6.22%で成長すると予測されています。
- 北米の飼料用アミノ酸市場では、米国が最も顕著な参入企業であり、2022年の市場総額の70%を占めています。同国における飼料用アミノ酸の需要は、主に動物の成長と食肉生産をサポートする必要性によってもたらされました。リジンとメチオニンは、市場規模において最も重要な飼料用アミノ酸でした。これらのアミノ酸の人気は、食肉生産の強化に加えて、動物の腸の健康と消化を促進する効率の高さに起因している可能性があります。
- 米国ではメチオニンとトリプトファンが最も急成長している飼料用アミノ酸で、予測期間中の予想CAGRはそれぞれ6.8%と目覚ましい伸びを示しています。動物の利用が増加していることが、食肉と免疫力向上におけるその重要性のためにこの成長を後押ししています。
- 米国では家禽類と反芻動物が飼料用アミノ酸の最大の消費者で、2022年にはそれぞれ飼料用アミノ酸市場全体の39.7%と38.7%を占めました。反芻動物用飼料用アミノ酸の使用シェアが高かったのは、肉牛飼育における動物の頭数とアミノ酸の需要が多かったためです。豚は第3位の動物セグメントで、豚肉を含む赤身肉の需要が高いため、国内の飼料用アミノ酸市場全体の19%を占めました。
- 食肉と食肉製品の需要増加が見込まれることに加え、腸内pHのバランスを整え、感染症の発生を抑えるというアミノ酸の利点に対する認識が高まっていることが、米国の飼料用アミノ酸市場を支える大きな原動力になるとみられます。そのため、飼料用アミノ酸産業の参入企業は、この動向を注視し、この動向を活用する戦略を開発する可能性が高いです。
米国の飼料用アミノ酸市場の動向
米国の鶏肉産業は最大の商業食品産業の一つであり、肉や卵の消費増加により鶏肉生産が増加しています。
- 米国の鶏肉産業は、商業食品産業における卵と鶏肉の需要増と輸出の増加により盛んです。同国は世界有数の鶏卵生産・輸出国であり、2020年の鶏卵輸出総額は前年比9.3%増の35億卵、輸出額は2.4%増の1億8,900万米ドルです。
- 米国における鶏肉消費は、良好な価格、高タンパク食への意識の高まり、鶏肉需要の増加により改善しました。その結果、2022年の食鳥頭数は前年比1,760万羽増加しました。狭いスペースやさまざまな環境で鶏を飼育することで、鶏肉生産は牛肉や豚肉よりも実現可能で安価になり、飼育面積が限られた畜産農業従事者が養鶏場に投資するようになります。
- しかし、米国の輸入シェアは2021年の26%から2031年には24%に減少すると予想されており、これが家禽飼料市場の成長に影響を与える可能性があります。2018~2019年にかけての豚インフルエンザと中国との貿易紛争も、畜産農業従事者が飼育増加に消極的であったため、歴史的期間中の家禽個体数が堅調に推移する一因となりました。
- このような課題にもかかわらず、食肉と卵の消費の増加と輸出の増加は、家禽人口の増加と相まって、予測期間中、米国の飼料添加物市場の成長を促進すると予想されます。
多数の養殖場と飼料工場の存在が養殖用飼料生産の増加に寄与している
- 米国における養殖用飼料生産量は、2022年に2017年比で4.1%の増加を記録しました。米国だけで6,232に上る複数の飼料工場の存在がこの増加に寄与しています。一人当たりの水産物消費量も2018年の21.88kgから2022年には22.26kgに増加しました。
- 魚は様々な養殖飼料の中で大きなシェアを占め、2022年には83.2%を占めました。これは、人間の食生活における魚の利点に対する意識の高まり、国際市場における高い需要、小売部門の拡大、国内に多数の養魚場が存在することなどに起因すると考えられます。ほとんどの養殖場はオハイオ州にあり、最も消費されている魚はナマズです。ナマズはペレット飼料を何ポンドもの魚に変えることができるからです。
- エビは2022年の水産養殖飼料市場の7.5%を占めたが、これは水産物需要の高まりと高タンパク質含量のため、他の最も消費される水生動物だからです。しかし、同国はエビを他国に依存しているため、調査期間中の成長に影響を与えました。一方、他の水生動物タイプは、二枚貝がメイン料理として人気があるため、COVID-19以降、レストランからの需要が増加し、需要が高い伸びを示しました。飼料工場の数が多く、水産養殖の飼料生産が増加していることから、魚介類の需要が増加しており、予測期間中、米国の飼料添加物市場の成長を牽引すると予想されます。
米国の飼料用アミノ酸産業概要
米国の飼料用アミノ酸市場は適度に統合されており、上位5社で45.82%を占めています。この市場の主要企業は、Archer Daniel Midland Co.、Evonik Industries AG、IFF(Danisco Animal Nutrition)、Land O'Lakes、SHV(Nutreco NV)などです。
その他の特典
- エクセル形式の市場予測(ME)シート
- 3ヶ月のアナリストサポート
目次
第1章 エグゼクティブサマリーと主要調査結果
第2章 レポートのオファー
第3章 イントロダクション
- 調査の前提条件と市場定義
- 調査範囲
- 調査手法
第4章 主要産業動向
- 動物頭数
- 家禽
- 反芻動物
- 豚
- 飼料生産
- 水産養殖
- 家禽
- 反芻動物
- 養豚
- 規制の枠組み
- 米国
- バリューチェーンと流通チャネル分析
第5章 市場セグメンテーション
- サブ添加物
- リジン
- メチオニン
- スレオニン
- トリプトファン
- その他のアミノ酸
- 動物
- 水産養殖
- サブ動物別
- 魚類
- エビ
- 魚類
- その他の養殖種
- 家禽類
- サブ動物別
- ブロイラー
- レイヤー
- その他の鳥類
- 反芻動物
- 小動物別
- 肉牛
- 乳牛
- その他の反芻動物
- 豚
- その他の動物
- 水産養殖
第6章 競争情勢
- 主要な戦略的動き
- 市場シェア分析
- 企業情勢
- 企業プロファイル
- Adisseo
- Ajinomoto Co., Inc.
- Alltech, Inc.
- Archer Daniel Midland Co.
- Evonik Industries AG
- IFF(Danisco Animal Nutrition)
- Kemin Industries
- Land O'Lakes
- Novus International, Inc.
- SHV(Nutreco NV)
第7章 CEOへの主要戦略的質問
第8章 付録
- 世界概要
- 概要
- ファイブフォース分析フレームワーク
- 世界のバリューチェーン分析
- 世界市場規模とDRO
- 情報源と参考文献
- 図表リスト
- 主要な洞察
- データパック
- 用語集
The United States Feed Amino Acids Market size is estimated at 1.48 billion USD in 2025, and is expected to reach 2 billion USD by 2030, growing at a CAGR of 6.22% during the forecast period (2025-2030).
- In the North American feed amino acid market, the United States was the most prominent player, accounting for 70% of the total market value in 2022. The demand for feed amino acids in the country was primarily driven by the need to support animal growth and meat production. Lysine and methionine were the most significant feed amino acids in terms of market value. The popularity of these amino acids could be attributed to their high efficiency in promoting gut health and digestion in animals, in addition to enhancing meat production.
- Methionine and tryptophan were the fastest-growing feed amino acids in the United States, with an impressive anticipated CAGR of 6.8% each during the forecast period. The increasing usage of animals propels this growth for meat and its importance in boosting immunity.
- Poultry and ruminants were the largest consumers of feed amino acids in the United States, accounting for 39.7% and 38.7% of the total feed amino acid market, respectively, in 2022. Ruminants had a higher share of feed amino acid usage because of the greater animal headcount and demand for amino acids in beef cattle farming. Swine was the third largest animal segment, with a 19% share of the total feed amino acids market in the country due to the high demand for red meat, including pork.
- The expected increase in demand for meat and meat products, as well as the growing awareness of the benefits of amino acids in balancing gut pH and reducing the incidence of infections, is set to be the major driving force behind the feed amino acids market in the United States. As a result, players in the feed amino acids industry are likely to keep an eye on this trend and develop strategies to capitalize on it.
United States Feed Amino Acids Market Trends
The United States poultry industry is one of the largest commercial food industry and increased consumption of meats and eggs is increasing the poultry production
- The poultry industry in the United States is thriving due to the increasing demand for eggs and poultry meat in the commercial food industry and the rising export. The country is one of the largest egg producers and exporters globally, with the total egg exports in 2020 increasing by 9.3% to 3.5 billion eggs from the previous year and the export value growing by 2.4% to USD 189 million.
- The consumption of poultry meat in the United States improved due to favorable prices, a rise in awareness of a high-protein diet, and increasing demand for poultry meat. As a result, the poultry bird headcount increased by 17.6 million in 2022 compared to the previous year. Raising chickens in small spaces and different environments makes poultry production more feasible and less expensive than beef and pork, attracting animal farmers with limited rearing areas to invest in poultry farms.
- However, the US import share is expected to decrease from 26% in 2021 to 24% in 2031, which can affect the growth of the poultry feed market. Swine flu and trade disputes with China between 2018 and 2019 also contributed to the steady poultry population during the historical period, as animal farmers were reluctant to increase rearing.
- Despite these challenges, the increasing consumption of meat and eggs and rising export, combined with the growing poultry population, are expected to drive the growth of the feed additives market in the United States during the forecast period.
Presence of a large number of fish farms and feed mills is contributing to increasing feed production for aquaculture
- Aquaculture feed production in the United States recorded an increase of 4.1% in 2022 compared to 2017. The presence of several feed mills, which totaled 6,232 in the United States alone, contributed to this increase. The per capita seafood consumption also increased from 21.88 kg in 2018 to 22.26 kg in 2022.
- Fish had a significant share among the various aquaculture feed, accounting for 83.2% in 2022. This can be attributed to the increasing awareness of the benefits of fish in the human diet, high demand in the international market, expansion of the retail sector, and the presence of numerous fish farms in the country. Most fish farms are located in Ohio, and the most consumed fish is catfish. This is because catfish can convert pellet feed into pounds of fish.
- Shrimp accounted for 7.5% of the aquaculture feed market in 2022, as it is the other most consumed aquatic animal due to the rise in demand for seafood and its high protein content. However, the country depends on other countries for shrimp, which affected its growth during the study period. On the other hand, other aquatic species witnessed high growth in demand, as the demand for bivalves from restaurants increased after COVID-19 due to their popularity as a main cuisine. The high number of feed mills and rising demand for fish and seafood, with increasing feed production of aquaculture, are expected to drive the growth of the feed additives market in the United States during the forecast period.
United States Feed Amino Acids Industry Overview
The United States Feed Amino Acids Market is moderately consolidated, with the top five companies occupying 45.82%. The major players in this market are Archer Daniel Midland Co., Evonik Industries AG, IFF(Danisco Animal Nutrition), Land O'Lakes and SHV (Nutreco NV) (sorted alphabetically).
Additional Benefits:
- The market estimate (ME) sheet in Excel format
- 3 months of analyst support
TABLE OF CONTENTS
1 EXECUTIVE SUMMARY & KEY FINDINGS
2 REPORT OFFERS
3 INTRODUCTION
- 3.1 Study Assumptions & Market Definition
- 3.2 Scope of the Study
- 3.3 Research Methodology
4 KEY INDUSTRY TRENDS
- 4.1 Animal Headcount
- 4.1.1 Poultry
- 4.1.2 Ruminants
- 4.1.3 Swine
- 4.2 Feed Production
- 4.2.1 Aquaculture
- 4.2.2 Poultry
- 4.2.3 Ruminants
- 4.2.4 Swine
- 4.3 Regulatory Framework
- 4.3.1 United States
- 4.4 Value Chain & Distribution Channel Analysis
5 MARKET SEGMENTATION (includes market size in Value in USD and Volume, Forecasts up to 2030 and analysis of growth prospects)
- 5.1 Sub Additive
- 5.1.1 Lysine
- 5.1.2 Methionine
- 5.1.3 Threonine
- 5.1.4 Tryptophan
- 5.1.5 Other Amino Acids
- 5.2 Animal
- 5.2.1 Aquaculture
- 5.2.1.1 By Sub Animal
- 5.2.1.1.1 Fish
- 5.2.1.1.2 Shrimp
- 5.2.1.1.3 fish
- 5.2.1.1.4 Other Aquaculture Species
- 5.2.2 Poultry
- 5.2.2.1 By Sub Animal
- 5.2.2.1.1 Broiler
- 5.2.2.1.2 Layer
- 5.2.2.1.3 Other Poultry Birds
- 5.2.3 Ruminants
- 5.2.3.1 By Sub Animal
- 5.2.3.1.1 Beef Cattle
- 5.2.3.1.2 Dairy Cattle
- 5.2.3.1.3 Other Ruminants
- 5.2.4 Swine
- 5.2.5 Other Animals
- 5.2.1 Aquaculture
6 COMPETITIVE LANDSCAPE
- 6.1 Key Strategic Moves
- 6.2 Market Share Analysis
- 6.3 Company Landscape
- 6.4 Company Profiles (includes Global Level Overview, Market Level Overview, Core Business Segments, Financials, Headcount, Key Information, Market Rank, Market Share, Products and Services, and Analysis of Recent Developments).
- 6.4.1 Adisseo
- 6.4.2 Ajinomoto Co., Inc.
- 6.4.3 Alltech, Inc.
- 6.4.4 Archer Daniel Midland Co.
- 6.4.5 Evonik Industries AG
- 6.4.6 IFF(Danisco Animal Nutrition)
- 6.4.7 Kemin Industries
- 6.4.8 Land O'Lakes
- 6.4.9 Novus International, Inc.
- 6.4.10 SHV (Nutreco NV)
7 KEY STRATEGIC QUESTIONS FOR FEED ADDITIVE CEOS
8 APPENDIX
- 8.1 Global Overview
- 8.1.1 Overview
- 8.1.2 Porter's Five Forces Framework
- 8.1.3 Global Value Chain Analysis
- 8.1.4 Global Market Size and DROs
- 8.2 Sources & References
- 8.3 List of Tables & Figures
- 8.4 Primary Insights
- 8.5 Data Pack
- 8.6 Glossary of Terms

