
|
市場調査レポート
商品コード
1683152
欧州の飼料用アミノ酸市場-市場シェア分析、産業動向・統計、成長予測(2025年~2030年)Europe Feed Amino Acids - Market Share Analysis, Industry Trends & Statistics, Growth Forecasts (2025 - 2030) |
||||||
カスタマイズ可能
適宜更新あり
|
|||||||
| 欧州の飼料用アミノ酸市場-市場シェア分析、産業動向・統計、成長予測(2025年~2030年) |
|
出版日: 2025年03月18日
発行: Mordor Intelligence
ページ情報: 英文 235 Pages
納期: 2~3営業日
|

全表示
- 概要
- 目次
概要
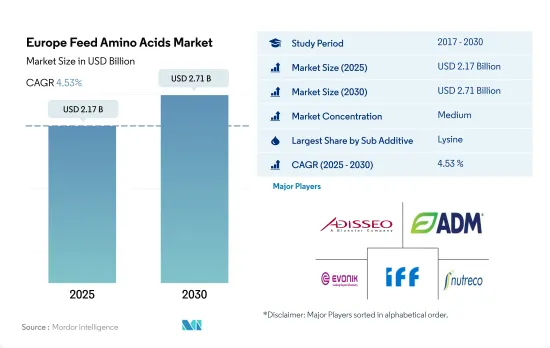
欧州の飼料用アミノ酸市場規模は2025年に21億7,000万米ドルと推定され、2030年には27億1,000万米ドルに達し、予測期間(2025~2030年)のCAGRは4.53%で成長すると予測されています。
- 飼料用アミノ酸は、主に動物の成長とタンパク質合成を促進する役割を果たすため、2022年の市場シェアは24.9%に達し、欧州の飼料添加物市場にとって不可欠な要素となっています。リジンとメチオニンは、動物の腸の健康や消化などの効率特性を改善する能力により、この地域では伝統的に最大の飼料アミノ酸副添加物となってきました。
- しかし、メチオニンとトリプトファンは、予測期間中のCAGRがそれぞれ4.8%と4.7%であり、この地域の飼料用アミノ酸の中で最も速い成長を記録すると予想されます。この成長は、食肉と食肉製品の需要が増加していることに加え、商業的農業において重要な属性として動物の成長を促進する添加物の使用に対する意識が高まっていることに起因しています。
- スペインはこの地域で最大の飼料用アミノ酸市場で、金額ベースで市場シェアの15.7%を占めました。フランス、ドイツ、ロシアが続き、2022年の市場シェアは金額ベースでそれぞれ14.4%、13.7%、11.3%でした。これらの国の市場シェアが高いのは、食肉と食肉製品の消費と生産に対する需要が高いためです。
- 2022年の飼料用アミノ酸市場に関しては、家禽類が最大の動物タイプであり、家禽肉と卵の需要増加により34.9%の市場シェアを占めます。
- 結論として、食肉と食肉製品の需要の増加と、動物の成長を促進する添加物の利点に対する意識の高まりが相まって、予測期間中CAGR 4.5%で欧州の飼料用アミノ酸市場を牽引すると予想されます。
- 2022年には、アミノ酸は欧州の飼料添加物市場で大きな割合を占め、総額の約5.3%、総量の1.1%を占めます。この成長は、動物由来のタンパク質に対する需要の増加と、アミノ酸が畜産物の品質と生産性を向上させる能力に起因しています。
- 欧州の飼料用アミノ酸市場はスペインが独占し、2022年の市場規模は2億9,990万米ドルで、予測期間中のCAGRは5.0%と予想されます。スペインで最も消費されているアミノ酸はリジンとメチオニンで、2022年の市場金額のそれぞれ31.4%と28.4%を占めています。
- 一方、フランスは飼料用アミノ酸の市場として古くから存在し、2022年には2億7,410万米ドルで欧州第2位のシェアを占めています。
- すべての動物タイプの中で、家禽類が最大の動物タイプであり、2022年の欧州における市場シェアの34.9%を占め、次いで豚が33.1%、反芻動物が28%を占めています。この動向は、この地域でより多くのアミノ酸を利用する飼料生産が増加していることと直接関係しています。
- 英国とロシアは欧州で最も急成長している市場で、予測期間中のCAGRはそれぞれ5.1%と5.0%でした。促進要因は、家畜と飼料生産率の増加です。例えば、ロシアの豚の頭数は2017~2020年の間に15.0%増加しました。
- 2017~2022年にかけて、欧州の飼料生産量は全体で1.9%増加しました。その結果、飼料生産と動物人口の増加に伴い、飼料用アミノ酸市場は予測期間中にCAGR 4.5%を記録すると予測されます。
欧州の飼料用アミノ酸市場動向
欧州は第3位の家禽肉輸出国であり、ブロイラー肉生産は家禽肉生産の82.6%を占めており、これが家禽肉生産の需要を促進すると予想されます。
- 欧州は世界的に鶏肉の主要な生産・輸出国であり、2021年の年間生産量は約1,340万トンと推定されます。同地域の食肉消費量は第2位で、1人当たりの年間消費量は26.9kgであるにもかかわらず、欧州の鶏肉生産量は世界の需要増に追いついていないです。ポーランドは同地域最大の鶏肉生産国で、生産量の19.2%、250万トンを占め、フランス(12.5%)、スペイン(12.3%)、ドイツ(12%)、イタリア(10.4%)がこれに続きます。
- ブロイラー肉の生産は、2021年のEUにおける家禽肉生産全体の大半(82.6%)を占め、次いで鴨肉が3.3%でした。2021年の欧州の鶏群数は約24億5,000万羽で、ロシア、フランス、オランダ、ウクライナ、ポーランド、英国が合計で50%以上を占めます。産卵鶏セグメントは、2017年の586万4,000トンから2021年には613万5,000トンに増加した卵消費量の増加により、欧州全域で成長を経験しています。
- 欧州は世界第4位の鶏肉輸入国であり、世界第3位の鶏肉輸出国です。2021年には、欧州連合はおよそ225万2,000トン(枝肉重量)の家禽肉を英国、ガーナ、ウクライナなど様々な国に輸出します。全体として、家禽類の生産量の増加、家禽製品の需要の高まり、卵の消費量の増加が、欧州における市場成長の主要促進要因になると予想されます。
82%を占める養魚用飼料の高い需要と水産物の輸入急増が養殖用配合飼料に悪影響を与えた
- 2022年には、欧州は世界の養殖用配合飼料の生産量において8.0%という大きなシェアを占め、その生産量は450万トンでした。配合飼料生産量は2018~2022年の間に15%の顕著な増加を確認したが、これは病気のリスクを低減し飼料効率を改善するための栄養バランスのとれた飼料に対する需要の高まりによるものです。しかし、水産養殖飼料生産は2018年に21.2%の減少を観測し、これは水産物の輸入急増と輸入水産物の相対的な低価格の影響を受けた可能性があり、2018年の配合飼料市場に影響を与えました。
- 欧州の主要水産飼料生産国は、トルコ、英国、オランダ、スペイン、イタリア、フランスです。この地域の2021年の水産養殖種の生産量は1,740万トンで、2018年から1.7%の伸びを示しています。この成長は、人口と一人当たりの魚介類消費量の増加に起因しており、これが同地域の養殖生産を牽引しています。このことが今度は配合飼料の需要を促進しており、予測期間中(2023~2029年)に18.2%増加する見込みです。
- 魚類飼料は水産飼料生産の大部分を占め、2022年には82%のシェアを占め、次いでエビ飼料が4.3%、その他の水生種飼料が13.7%のシェアを占めます。魚の餌はこの地域で最も消費される水生食品であり、他の水生種に比べて生産量が多いです。水産物と養殖製品に対する需要の高まりと、食肉の品質に関する意識の高まりに後押しされた養殖セクターの拡大が、調査対象市場の成長を増大させる主要要因です。
欧州の飼料用アミノ酸産業概要
欧州の飼料用アミノ酸市場は適度に統合されており、上位5社で51.25%を占めています。この市場の主要企業は、Adisseo、Archer Daniel Midland Co.、Evonik Industries AG、IFF(Danisco Animal Nutrition)、SHV(Nutreco NV)です。
その他の特典
- エクセル形式の市場予測(ME)シート
- 3ヶ月のアナリストサポート
目次
第1章 エグゼクティブサマリーと主要調査結果
第2章 レポートのオファー
第3章 イントロダクション
- 調査の前提条件と市場定義
- 調査範囲
- 調査手法
第4章 主要産業動向
- 動物頭数
- 家禽
- 反芻動物
- 豚
- 飼料生産
- 水産養殖
- 家禽
- 反芻動物
- 養豚
- 規制の枠組み
- フランス
- ドイツ
- イタリア
- オランダ
- ロシア
- スペイン
- トルコ
- 英国
- バリューチェーンと流通チャネル分析
第5章 市場セグメンテーション
- サブ添加物別
- リジン
- メチオニン
- スレオニン
- トリプトファン
- その他のアミノ酸
- 動物
- 水産養殖
- サブ動物別
- 魚類
- エビ
- その他の養殖種
- 家禽類
- サブ動物別
- ブロイラー
- レイヤー
- その他の鳥類
- 反芻動物
- サブ動物別
- 肉牛
- 乳牛
- その他の反芻動物
- 豚
- その他の動物
- 水産養殖
- 国名
- フランス
- ドイツ
- イタリア
- オランダ
- ロシア
- スペイン
- トルコ
- 英国
- その他の欧州
第6章 競合情勢
- 主要な戦略動向
- 市場シェア分析
- 企業情勢
- 企業プロファイル(世界レベル概要、市場レベル概要、主要な事業セグメント、財務、従業員数、主要情報、市場ランク、市場シェア、製品・サービス、最近の動向分析を含む)。
- Adisseo
- Ajinomoto Co., Inc.
- Alltech, Inc.
- Archer Daniel Midland Co.
- Dangschat T.O.H. GmbH & Co. KG
- Evonik Industries AG
- IFF(Danisco Animal Nutrition)
- Kemin Industries
- Lonza Group Ltd.
- SHV(Nutreco NV)
第7章 CEOへの主要戦略的質問
第8章 付録
- 世界概要
- 概要
- ファイブフォース分析フレームワーク
- 世界のバリューチェーン分析
- 世界市場規模とDRO
- 情報源と参考文献
- 図表リスト
- 主要洞察
- データパック
- 用語集
目次
Product Code: 54746
The Europe Feed Amino Acids Market size is estimated at 2.17 billion USD in 2025, and is expected to reach 2.71 billion USD by 2030, growing at a CAGR of 4.53% during the forecast period (2025-2030).
- Feed amino acids have become a vital component of the European feed additives market, with a market share of 24.9% in 2022, primarily due to their role in promoting animal growth and protein synthesis. Lysine and methionine have traditionally been the largest feed amino acid sub-additives in the region, owing to their ability to improve efficiency characteristics such as gut health and digestion in animals.
- However, methionine and tryptophan are expected to register the fastest growth among feed amino acids in the region, with CAGRs of 4.8% and 4.7%, respectively, during the forecast period. This growth can be attributed to the increasing demand for meat and meat products, coupled with a growing awareness of the usage of additives that promote animal growth as a crucial attribute in commercial farming.
- Spain was the largest market for feed amino acids in the region, accounting for 15.7% of the market share in terms of value. France, Germany, and Russia followed with market shares of 14.4%, 13.7%, and 11.3%, respectively, in terms of value in 2022. These countries have higher market shares due to the higher demand for meat and meat product consumption and production.
- Poultry birds are the largest animal type with respect to the feed amino acids market in 2022, accounting for a market share of 34.9% due to an increase in demand for poultry meat and eggs.
- In conclusion, the increasing demand for meat and meat products, combined with growing awareness of the benefits of additives that promote animal growth, is expected to drive the feed amino acids market in Europe at a CAGR of 4.5% during the forecast period.
- In 2022, amino acids represented a significant proportion of the European feed additives market, accounting for around 5.3% of its total value and 1.1% of its total volume. This growth is attributed to the increasing demand for animal-derived protein and the ability of amino acids to enhance the quality and productivity of animal products.
- Spain dominated the feed amino acids market in Europe, with a market value of USD 299.9 million in 2022, which is expected to register a CAGR of 5.0% during the forecast period. Lysine and methionine were Spain's most consumed amino acids, accounting for 31.4% and 28.4% of the market value, respectively, in 2022.
- On the other hand, France has a long-standing market for feed amino acids and accounted for the second-largest share in Europe in 2022, at USD 274.1 million.
- Among all the animal types, poultry birds were the largest animal type, accounting for 34.9% of the market share in 2022 in Europe, followed by swine and ruminants, which accounted for 33.1% and 28% of the market share, respectively. This trend is directly related to the increased feed production in the region utilizing more amino acids.
- The United Kingdom and Russia were the fastest-growing markets in Europe, with registered CAGRs of 5.1% and 5.0% during the forecast period, respectively. The driving factors are the growing livestock and feed production rates. For instance, the swine population in Russia increased by 15.0% between 2017 and 2020.
- Between 2017 and 2022, overall feed production in Europe increased by 1.9%. As a result, with feed production and animal population growth, the feed amino acids market is expected to register a CAGR of 4.5% during the forecast period.
Europe Feed Amino Acids Market Trends
Europe is 3rd largest exporter of poultry meat and broiler meat production accounted for 82.6% of poultry meat production which is expected to drive the demand for poultry production
- Europe was a major producer and exporter of poultry meat globally, with an estimated annual production of approximately 13.4 million metric tons in 2021. Despite being the second most consumed meat in the region, with a consumption rate of 26.9 kg per capita per year, poultry production in Europe has not kept pace with rising global demand. Poland is the largest producer of poultry meat in the region, accounting for 19.2% of production or 2.5 million metric tons, followed by France (12.5%), Spain (12.3%), Germany (12%), and Italy (10.4%).
- Broiler meat production constituted the majority (82.6%) of total poultry meat production in the European Union in 2021, followed by duck meat at 3.3%. Europe's poultry flock numbered approximately 2.45 billion birds in 2021, with Russia, France, the Netherlands, Ukraine, Poland, and the United Kingdom collectively comprising more than 50% of the population. The laying hen segment is experiencing growth across Europe due to increased egg consumption, which rose from 5,864 metric tons in 2017 to 6,135 thousand metric tons in 2021.
- Europe is the fourth-largest importer and the third-largest exporter of poultry meat globally. In 2021, the European Union exported roughly 2,252 thousand metric tons (carcass weight) of poultry meat to various countries, including the United Kingdom, Ghana, and Ukraine. Overall, the increasing production of poultry birds, rising demand for poultry products, and growing consumption of eggs are expected to be key drivers of market growth in the European region.
High demand for fish feed which accounted for 82% and surge in seafood imports had a negative impact on compound feed for aquaculture
- In 2022, Europe held a significant share of 8.0% in global aquaculture compound feed production, with a production volume of 4.5 million metric tons. The compounded feed production witnessed a notable increase of 15% between 2018 and 2022, driven by the growing demand for nutrient-balanced feed to reduce the risk of disease and improve feed efficiency. However, aquaculture feed production observed a decline of 21.2% in 2018, which may have been influenced by the surge in seafood imports and the relatively low prices of imported seafood, impacting the compound feed market in 2018.
- The major aqua feed producers in the European region are Turkey, the United Kingdom, the Netherlands, Spain, Italy, and France. The region produced 17.4 million metric tons of aquaculture species in 2021, indicating a growth of 1.7% since 2018. The growth is attributed to the rise in population and per capita consumption of seafood, which is driving aquaculture production in the region. This, in turn, is propelling the demand for compound feed, which is expected to increase by 18.2% during the forecast period (2023-2029).
- Fish feed dominates aqua feed production, accounting for an 82% share in 2022, followed by shrimp feed and other aquatic species feed, with a share of 4.3% and 13.7%, respectively, in the region. Fish food is the most consumed aquatic food across the region, and it is highly produced compared to other aquatic species. The expanding aquaculture sector, driven by the rising demand for seafood and aquaculture products and the growing awareness regarding quality meat, are the major factors augmenting the growth of the market studied.
Europe Feed Amino Acids Industry Overview
The Europe Feed Amino Acids Market is moderately consolidated, with the top five companies occupying 51.25%. The major players in this market are Adisseo, Archer Daniel Midland Co., Evonik Industries AG, IFF(Danisco Animal Nutrition) and SHV (Nutreco NV) (sorted alphabetically).
Additional Benefits:
- The market estimate (ME) sheet in Excel format
- 3 months of analyst support
TABLE OF CONTENTS
1 EXECUTIVE SUMMARY & KEY FINDINGS
2 REPORT OFFERS
3 INTRODUCTION
- 3.1 Study Assumptions & Market Definition
- 3.2 Scope of the Study
- 3.3 Research Methodology
4 KEY INDUSTRY TRENDS
- 4.1 Animal Headcount
- 4.1.1 Poultry
- 4.1.2 Ruminants
- 4.1.3 Swine
- 4.2 Feed Production
- 4.2.1 Aquaculture
- 4.2.2 Poultry
- 4.2.3 Ruminants
- 4.2.4 Swine
- 4.3 Regulatory Framework
- 4.3.1 France
- 4.3.2 Germany
- 4.3.3 Italy
- 4.3.4 Netherlands
- 4.3.5 Russia
- 4.3.6 Spain
- 4.3.7 Turkey
- 4.3.8 United Kingdom
- 4.4 Value Chain & Distribution Channel Analysis
5 MARKET SEGMENTATION (includes market size in Value in USD and Volume, Forecasts up to 2030 and analysis of growth prospects)
- 5.1 Sub Additive
- 5.1.1 Lysine
- 5.1.2 Methionine
- 5.1.3 Threonine
- 5.1.4 Tryptophan
- 5.1.5 Other Amino Acids
- 5.2 Animal
- 5.2.1 Aquaculture
- 5.2.1.1 By Sub Animal
- 5.2.1.1.1 Fish
- 5.2.1.1.2 Shrimp
- 5.2.1.1.3 Other Aquaculture Species
- 5.2.2 Poultry
- 5.2.2.1 By Sub Animal
- 5.2.2.1.1 Broiler
- 5.2.2.1.2 Layer
- 5.2.2.1.3 Other Poultry Birds
- 5.2.3 Ruminants
- 5.2.3.1 By Sub Animal
- 5.2.3.1.1 Beef Cattle
- 5.2.3.1.2 Dairy Cattle
- 5.2.3.1.3 Other Ruminants
- 5.2.4 Swine
- 5.2.5 Other Animals
- 5.2.1 Aquaculture
- 5.3 Country
- 5.3.1 France
- 5.3.2 Germany
- 5.3.3 Italy
- 5.3.4 Netherlands
- 5.3.5 Russia
- 5.3.6 Spain
- 5.3.7 Turkey
- 5.3.8 United Kingdom
- 5.3.9 Rest of Europe
6 COMPETITIVE LANDSCAPE
- 6.1 Key Strategic Moves
- 6.2 Market Share Analysis
- 6.3 Company Landscape
- 6.4 Company Profiles (includes Global Level Overview, Market Level Overview, Core Business Segments, Financials, Headcount, Key Information, Market Rank, Market Share, Products and Services, and Analysis of Recent Developments).
- 6.4.1 Adisseo
- 6.4.2 Ajinomoto Co., Inc.
- 6.4.3 Alltech, Inc.
- 6.4.4 Archer Daniel Midland Co.
- 6.4.5 Dangschat T.O.H. GmbH & Co. KG
- 6.4.6 Evonik Industries AG
- 6.4.7 IFF(Danisco Animal Nutrition)
- 6.4.8 Kemin Industries
- 6.4.9 Lonza Group Ltd.
- 6.4.10 SHV (Nutreco NV)
7 KEY STRATEGIC QUESTIONS FOR FEED ADDITIVE CEOS
8 APPENDIX
- 8.1 Global Overview
- 8.1.1 Overview
- 8.1.2 Porter's Five Forces Framework
- 8.1.3 Global Value Chain Analysis
- 8.1.4 Global Market Size and DROs
- 8.2 Sources & References
- 8.3 List of Tables & Figures
- 8.4 Primary Insights
- 8.5 Data Pack
- 8.6 Glossary of Terms
