
|
市場調査レポート
商品コード
1693590
ビジネスジェット機:市場シェア分析、産業動向・統計、成長予測(2025年~2030年)Business Jet - Market Share Analysis, Industry Trends & Statistics, Growth Forecasts (2025 - 2030) |
||||||
カスタマイズ可能
適宜更新あり
|
|||||||
| ビジネスジェット機:市場シェア分析、産業動向・統計、成長予測(2025年~2030年) |
|
出版日: 2025年03月18日
発行: Mordor Intelligence
ページ情報: 英文 322 Pages
納期: 2~3営業日
|

全表示
- 概要
- 目次
概要
ビジネスジェット機市場規模は2025年に256億9,000万米ドルと推定され、2030年には309億1,000万米ドルに達すると予測され、予測期間中(2025~2030年)のCAGRは3.77%で成長します。
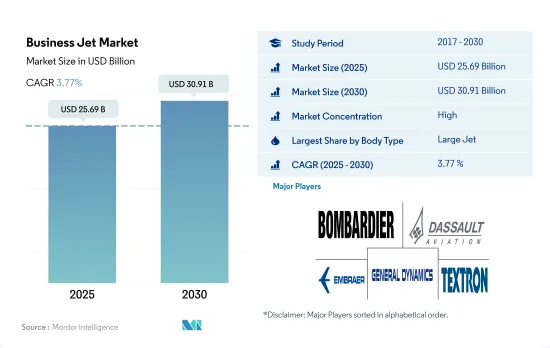
HNWI(富裕層)が長距離の大陸間移動に大型ジェットを好むため、大型ジェットが最大の市場シェアを占める
- ビジネスジェット機は、少人数を運ぶために設計されたプライベートジェット機です。また、その他の様々な目的にも使用できます。保有機数のうち、大型ジェット機が45%を占め、次いで大型ジェット機が41%、中型ジェット機が13%となっています。
- 企業旅行、観光、個人旅行、レジャー旅行の需要が高いため、大型ジェットは世界的にビジネスジェット機・セグメントの大半を占めています。大型ジェット機は、ビジネス目的で州をまたいで旅行する人に最も多く好まれています。最も多く納入されているジェット機には、課題350、ガルフストリームG280、G500、G600、G650ER、世界6000などがあります。
- 2022年12月現在、セスナ、ガルフストリーム・エアロスペース・コーポレーション、エンブラエル、ボンバルディア、シーラス・エアクラフトがビジネスジェット機市場を独占し、全世界のビジネスジェット機現役機数の76%を占めています。稼働中のビジネスジェット機全体のうち、86%は完全所有、12%は分数所有、残りは共有所有でした。
- 現在運航されているビジネスジェット機の約3分の1が10年以上経過しており、これがビジネスジェット機運航会社やチャーター・プロバイダーが機体近代化プログラムに投資し、機体の能力を強化する原動力となっています。この要因が市場の成長を後押しし、予測期間中に合計6,63機のジェット機が納入される見込みです。
- 北米は現在、同市場で最大のシェアを占めており、予測期間中もその優位性が続くと予想されます。この地域は、世界で最も多くのビジネスジェット機(約16,000機)を保有しており、米国がビジネスジェット機全体の69%を占めています。多くの富裕層や法人企業が存在するため、需要の大半は小型ジェット機と大型ジェット機です。
富裕層の増加とプライベート旅行志向の高まりがビジネスジェット機需要を後押し
- ビジネスジェット機分野全体の航空機納入は、COVID-19パンデミックの影響を受け、2019年から2021年の成長率は23%減少しました。経済活動の縮小と旅行制限により、同地域のビジネスジェット機の利用と調達に影響が出ました。しかし、パンデミック後、市場は安定し、2022年には世界全体で12%の成長を記録しました。2017年から2022年にかけて、北米がビジネスジェット機の大半を調達し、次いで欧州が74%、アジア太平洋が16%、南米が6%、中東・アフリカが4%、アフリカが3%を占めました。
- 2022年12月現在、セスナ機が世界で稼動しているビジネスジェット機のほとんどを運航しており、次いでガルフストリーム・エアロスペース・コーポレーションが32%、ダッソー・アビエーションが13%、ボンバルディアが9%、リアジェットが8%、そしてセスナ機が8%となっています。運航中のビジネスジェット機全体のうち、86%が完全所有、12%が分数所有、残りが共有となっています。市場は大型ジェット機が45%を占め、次いで小型ジェット機が41%、中型ジェット機が13%となっています。
- 2023年から2030年にかけて、世界中で約6,700機のビジネスジェット機が納入される見込みです。このうち、北米がビジネスジェット機の大半を調達し、4,027機近くを占めると予測されています。同地域の新興経済諸国における景気回復が、予測期間中の一般航空セクターの成長を後押しすると予想されます。
世界のビジネスジェット機市場動向
HNWI人口は活況を呈しており、市場の最大の成長促進要因になると予想されます。
- HNWIは100万米ドル以上の流動性金融資産を持っており、UHNWIは少なくとも3,000万米ドルの純資産を持っています。2017年から2022年にかけて、この地域のHNWI人口は約90%急増しました。2022年には、アジア太平洋地域のHNWI数は2020年比で2%増加します。
- 日本は2022年に15%の成長率を記録しました。主要国におけるHNWI人口の伸びの鈍化は、アジア太平洋全体の富の増加に影響を及ぼしています。中国では、平均的な富の増加により、億万長者の数が70%以上増加しました。アジア太平洋地域は、同地域における富の増加、HNWI人口の増加、財務アドバイスへのニーズによって、世界的にウェルスマネジメントとプライベートバンキングの主要な目的地として台頭しつつあります。
- 政治指導者の交代やパンデミック時の消費低迷といった要因が日本の株式市場(日経平均株価)に影響を与え、同国のHNWIの成長を阻害しました。インド、ベトナム、タイなどの新興諸国は、アジア太平洋の主要国と比べてHNWIの成長を示しました。202年、インドのHNWI人口は292%以上の伸びを示しました。タイとベトナムは、それぞれ約21%と13%の成長を示しました。中央銀行による高い流動性支援、支持的な国内政策、株式市場の安定が、これらの国々のHNWIの成長を後押ししました。アジア太平洋地域のHNWI人口の大半を占めた主なセクターは、テクノロジー、産業コングロマリット、エネルギー、不動産でした。
ビジネスジェット機業界の概要
ビジネスジェット機市場はかなり統合されており、上位5社で92.08%を占めています。この市場の主要企業は以下の通り。 Bombardier Inc., Dassault Aviation, Embraer, General Dynamics Corporation and Textron Inc.(アルファベット順)
その他の特典:
- エクセル形式の市場予測(ME)シート
- 3ヶ月のアナリスト・サポート
目次
第1章 エグゼクティブサマリーと主な調査結果
第2章 レポートのオファー
第3章 イントロダクション
- 調査の前提条件と市場定義
- 調査範囲
- 調査手法
第4章 主要産業動向
- 富裕層(hnwi)
- アジア太平洋地域
- 欧州
- 中東・アフリカ
- 北米
- 南米
- 規制の枠組み
- バリューチェーン分析
第5章 市場セグメンテーション
- ボディタイプ
- 大型ジェット
- 小型ジェット機
- 中型ジェット機
- 地域
- アジア太平洋
- オーストラリア
- 中国
- インド
- インドネシア
- 日本
- マレーシア
- フィリピン
- シンガポール
- 韓国
- タイ
- その他アジア太平洋地域
- 欧州
- フランス
- ドイツ
- イタリア
- オランダ
- ロシア
- スペイン
- トルコ
- 英国
- その他欧州
- 中東・アフリカ
- アルジェリア
- エジプト
- カタール
- サウジアラビア
- 南アフリカ
- アラブ首長国連邦
- その他中東とアフリカ
- 北米
- カナダ
- メキシコ
- 米国
- その他北米地域
- 南米
- ブラジル
- チリ
- コロンビア
- その他南米
- アジア太平洋
第6章 競合情勢
- 主要な戦略的動き
- 市場シェア分析
- 企業情勢
- 企業プロファイル
- Airbus SE
- Bombardier Inc.
- Cirrus Design Corporation
- Dassault Aviation
- Embraer
- General Dynamics Corporation
- Honda Motor Co., Ltd.
- Pilatus Aircraft Ltd
- Textron Inc.
- The Boeing Company
第7章 CEOへの主な戦略的質問
第8章 付録
- 世界概要
- 概要
- ファイブフォース分析フレームワーク
- 世界のバリューチェーン分析
- 市場力学(DROs)
- 情報源と参考文献
- 図表一覧
- 主要洞察
- データパック
- 用語集
目次
Product Code: 92740
The Business Jet Market size is estimated at 25.69 billion USD in 2025, and is expected to reach 30.91 billion USD by 2030, growing at a CAGR of 3.77% during the forecast period (2025-2030).
Large jets occupy the largest market share as HNWIs prefer large jets for long intercontinental travel
- Business jets are private jets designed to carry small groups of people. They can also be used for various other purposes. Out of the total fleet, the large jet segment accounted for 45%, followed by large jets and mid-size jets with 41% and 13%, respectively.
- Due to the high demand for corporate travel, tourism, and personal and leisure travel, large jets dominate the business jet segment globally. Large jets are most frequently preferred by those who travel interstate for business purposes. Some of the most delivered jets are Challenger 350, Gulfstream G280, G500, G600, G650ER, and Global 6000.
- As of December 2022, Cessna, Gulfstream Aerospace Corporation, Embraer, Bombardier, and Cirrus Aircraft dominated the business jet market, holding 76% of the total business jet active fleet globally. Out of the total operational business jets, 86% were wholly owned, 12% were fractional ownership, and the remaining were shared ownership.
- Approximately one-third of the business jet fleets currently in operation are over 10 years old, which is driving the business jet operators and charter providers to invest in fleet modernization programs and enhance their fleet's capabilities. This factor is expected to boost the market's growth, and during the forecast period, a total of 6,63 jets are expected to be delivered.
- North America currently has the largest share of the market and is expected to continue its dominance during the forecast period. The region holds the most extensive operating business jet fleet (about 16,000 aircraft) in the world, with the United States accounting for 69% of total business jets. Due to the presence of many high-net-worth individuals and corporate companies, the majority of the demand is for light jets and large jets.
The Demand For Business Jets Is Being Fueled By The Growing Number Of HNWIs And Their Increasing Inclination Toward Private Travel
- The overall aircraft deliveries in the business jet sector were affected during the COVID-19 pandemic, and the growth between 2019 and 2021 decreased by 23%. The reduction in economic activities and travel restrictions impacted the utilization and procurement of business jets in the region. However, after the pandemic, the market stabilized, and in 2022, a growth of 12% was recorded globally. From 2017 to 2022, North America procured most of the business jets, followed by Europe, Asia-Pacific, South America, and the Middle East & Africa, accounting for 74%, 16%, 6%, 4%, and 3%, respectively.
- As of December 2022, Cessna operated most of the global active business jets, followed by Gulfstream Aerospace Corporation, Dassault Aviation, Bombardier, and Learjet, accounting for 32%, 13%, 9%, 8%, and 8%, respectively. Of the total operational business jets, 86% are wholly owned, 12% are fractional ownership, and the remaining are shared ownership. The larger jet segment dominated the market with 45%, followed by light jets with 41% and mid-size jets with 13%.
- During 2023-2030, approximately 6,700 business jets are expected to be delivered globally. Of this, North America is projected to procure most of the business jets, accounting for nearly 4,027 jets. The economic recovery in the developing economies in the region is expected to boost growth in the general aviation sector during the forecast period.
Global Business Jet Market Trends
The HNWI population is booming and is expected to be the biggest growth driver for the market
- HNWIs have over USD 1 million in liquid financial assets, while UHNWIs have a net worth of at least USD 30 million. From 2017 to 2022, there was a surge of around 90% in the HNWI population in the region. In 2022, the number of HNWIs in Asia-Pacific increased by 2% compared to 2020.
- Japan witnessed a growth rate of 15% in 2022. The slow growth of the HNWI population in major countries has affected the overall wealth growth in Asia-Pacific. In China, the increase in average wealth led to more than 70% in the number of millionaires. Asia-Pacific is emerging as the leading destination for wealth management and private banking globally, driven by the growing wealth in the region, the increasing HNWI population, and its need for financial advice.
- Factors such as a change in political leadership and low consumption during the pandemic impacted the Japanese Stock market, Nikkei 225, and hampered the growth of HNWIs in the country. Developing countries such as India, Vietnam, and Thailand witnessed growth in HNWIs compared to the leading Asia-Pacific countries. In 202, India witnessed a growth of over 292% in its HNWI population. Thailand and Vietnam witnessed a growth of around 21% and 13%, respectively. High liquidity support by central banks, supportive domestic policy, and stability in the stock markets aided the growth of HNWIs in these countries. Technology, industrial conglomerates, energy, and real estate were the major sectors that accounted for most of the Asia-Pacific HNWI population.
Business Jet Industry Overview
The Business Jet Market is fairly consolidated, with the top five companies occupying 92.08%. The major players in this market are Bombardier Inc., Dassault Aviation, Embraer, General Dynamics Corporation and Textron Inc. (sorted alphabetically).
Additional Benefits:
- The market estimate (ME) sheet in Excel format
- 3 months of analyst support
TABLE OF CONTENTS
1 EXECUTIVE SUMMARY & KEY FINDINGS
2 REPORT OFFERS
3 INTRODUCTION
- 3.1 Study Assumptions & Market Definition
- 3.2 Scope of the Study
- 3.3 Research Methodology
4 KEY INDUSTRY TRENDS
- 4.1 High-net-worth Individual (hnwi)
- 4.1.1 Asia-Pacific
- 4.1.2 Europe
- 4.1.3 Middle East and Africa
- 4.1.4 North America
- 4.1.5 South America
- 4.2 Regulatory Framework
- 4.3 Value Chain Analysis
5 MARKET SEGMENTATION (includes market size in Value in USD and Volume, Forecasts up to 2030 and analysis of growth prospects)
- 5.1 Body Type
- 5.1.1 Large Jet
- 5.1.2 Light Jet
- 5.1.3 Mid-Size Jet
- 5.2 Region
- 5.2.1 Asia-Pacific
- 5.2.1.1 Australia
- 5.2.1.2 China
- 5.2.1.3 India
- 5.2.1.4 Indonesia
- 5.2.1.5 Japan
- 5.2.1.6 Malaysia
- 5.2.1.7 Philippines
- 5.2.1.8 Singapore
- 5.2.1.9 South Korea
- 5.2.1.10 Thailand
- 5.2.1.11 Rest of Asia-Pacific
- 5.2.2 Europe
- 5.2.2.1 France
- 5.2.2.2 Germany
- 5.2.2.3 Italy
- 5.2.2.4 Netherlands
- 5.2.2.5 Russia
- 5.2.2.6 Spain
- 5.2.2.7 Turkey
- 5.2.2.8 UK
- 5.2.2.9 Rest of Europe
- 5.2.3 Middle East and Africa
- 5.2.3.1 Algeria
- 5.2.3.2 Egypt
- 5.2.3.3 Qatar
- 5.2.3.4 Saudi Arabia
- 5.2.3.5 South Africa
- 5.2.3.6 United Arab Emirates
- 5.2.3.7 Rest of Middle East and Africa
- 5.2.4 North America
- 5.2.4.1 Canada
- 5.2.4.2 Mexico
- 5.2.4.3 United States
- 5.2.4.4 Rest of North America
- 5.2.5 South America
- 5.2.5.1 Brazil
- 5.2.5.2 Chile
- 5.2.5.3 Colombia
- 5.2.5.4 Rest of South America
- 5.2.1 Asia-Pacific
6 COMPETITIVE LANDSCAPE
- 6.1 Key Strategic Moves
- 6.2 Market Share Analysis
- 6.3 Company Landscape
- 6.4 Company Profiles
- 6.4.1 Airbus SE
- 6.4.2 Bombardier Inc.
- 6.4.3 Cirrus Design Corporation
- 6.4.4 Dassault Aviation
- 6.4.5 Embraer
- 6.4.6 General Dynamics Corporation
- 6.4.7 Honda Motor Co., Ltd.
- 6.4.8 Pilatus Aircraft Ltd
- 6.4.9 Textron Inc.
- 6.4.10 The Boeing Company
7 KEY STRATEGIC QUESTIONS FOR AVIATION CEOS
8 APPENDIX
- 8.1 Global Overview
- 8.1.1 Overview
- 8.1.2 Porter's Five Forces Framework
- 8.1.3 Global Value Chain Analysis
- 8.1.4 Market Dynamics (DROs)
- 8.2 Sources & References
- 8.3 List of Tables & Figures
- 8.4 Primary Insights
- 8.5 Data Pack
- 8.6 Glossary of Terms

