
|
市場調査レポート
商品コード
1693535
アジア太平洋地域の放出制御肥料:市場シェア分析、産業動向・統計、成長予測(2025年~2030年)Asia-Pacific Controlled Release Fertilizer - Market Share Analysis, Industry Trends & Statistics, Growth Forecasts (2025 - 2030) |
||||||
カスタマイズ可能
適宜更新あり
|
|||||||
| アジア太平洋地域の放出制御肥料:市場シェア分析、産業動向・統計、成長予測(2025年~2030年) |
|
出版日: 2025年03月18日
発行: Mordor Intelligence
ページ情報: 英文 190 Pages
納期: 2~3営業日
|

全表示
- 概要
- 目次
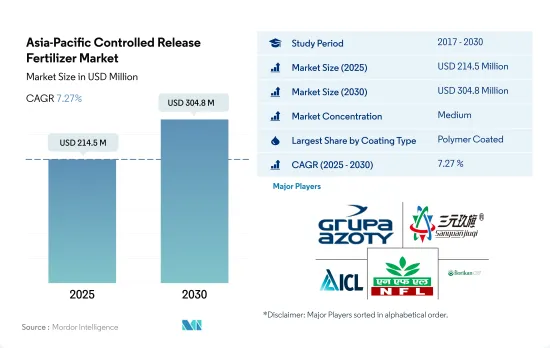
アジア太平洋地域の放出制御肥料市場規模は2025年に2億1,450万米ドルと推定され、2030年には3億480万米ドルに達すると予測され、予測期間(2025-2030年)のCAGRは7.27%で成長する見込みです。
中国とインドがアジア太平洋地域の放出制御肥料市場を独占
- 調査期間中、ポリマー被覆放出制御肥料市場は顕著な成長を遂げました。2022年までに、これらの肥料はアジア太平洋地域の放出制御肥料(CRF)市場全体で76.0%という大きなシェアを占めました。この地域では生態学的に安全な肥料を重視する傾向が強まっており、これが新しい放出制御肥料の需要急増の主な要因となっています。
- トウモロコシ、大豆、菜種などの穀物や油糧種子の栽培拡大が、ポリ硫黄コーティング尿素市場を促進しています。さらに、土壌中の過剰な尿素蓄積は枯渇を招き、ポリ硫黄被覆放出制御肥料の需要を煽っています。さらに、ポリ硫黄被覆CRFの市場は、高効率で環境に優しい製品に対する需要の高まりなどの要因によって成長する態勢にあります。この地域の2023~2030年のCAGRは6.8%と予測されます。
- 2022年には、中国がその他のタイプの被覆放出制御肥料市場を独占し、CRF市場で42.3%の金額シェアを占めました。これらの肥料のうち、約69.6%が畑作物に利用され、園芸作物もそれに続いた。
- 化学肥料の使用は、土壌pHの変化、微生物成長の阻害、過剰な窒素施用による温室効果ガスの放出など、有害な影響を及ぼします。このような環境問題への懸念は、栄養損失の増大と相まって、代替肥料の需要に拍車をかけています。その結果、市場は2023年から2030年にかけて金額ベースでCAGR 6.2%を記録すると予測されています。
中国がアジア太平洋地域の放出制御肥料市場を独占
- アジア太平洋地域の人口の約70.0%は、生活の一次基盤を農業に直接依存しています。しかし、この地域の農業セクターは生産性の低さという点で多くの問題に直面しています。
- 中国はアジア太平洋地域の放出制御肥料市場を独占しており、2022年の市場価値シェアの43.8%を占めています。ポリマー被覆肥料が放出制御肥料市場で最大のシェアを占め、ポリマー硫黄被覆肥料がそれに続きます。ポリマー被覆肥料セグメントは2017年に1,790万米ドルと評価され、主にCRFの採用による肥料消費量の削減によってNUEが増加するため、2030年には5,800万米ドルに達すると予測されています。
- インドはこの地域で放出制御肥料の第2位の市場であり、2022年には16.6%を占める。放出制御型尿素は、インドで最も一般的に使用されているCRFです。窒素損失は稲作農家が直面する主な問題のひとつであり、米の窒素利用効率はしばしば不十分です。これは、揮発、浸出、脱窒による窒素の損失が大きいためです。窒素利用効率を向上させる1つの方法は、放出制御型尿素を使用することです。放出制御型尿素は一般に、窒素損失の低減、植物成長の促進、窒素濃度の増加において粒状尿素肥料を上回る。
- 2017年、中国国際植物栄養研究所は湖北省で放出制御型尿素肥料施用プログラムを実施しました。CRU肥料を一貫して使用することで、米やナスなどの主要作物の収量と収益性の向上に役立つことが証明されました。従って、この市場は今後成長すると予想されます。
アジア太平洋地域の放出制御肥料の市場動向
主要成長作物の栽培の大幅な拡大が市場の成長を後押しすると予想されます。
- 畑作物の栽培がこの地域を支配しており、総栽培面積の95%以上を占めています。米、小麦、トウモロコシがこの地域で生産される主要な畑作作物であり、2022年には合計で作物総面積の約38%を占める。耕作面積の増加は、同国の肥料需要を増加させると予想されます。
- 中国、インド、パキスタン、オーストラリアを含むアジア太平洋地域は、世界最大の小麦生産国のひとつです。中国とインドは世界最大の小麦生産国であり消費国でもあります。小麦の需要と消費の増加は、小麦がこの地域の主要な主食の1つであることに起因しており、面積は調査期間中にパーセンテージ・ポイント増加しました。2022年、中国は1億3,800万トンの小麦生産を占め、世界最大の小麦生産国となり、インドの小麦生産量は1億300万トンでした。
- コメはこの地域で最大の畑作作物です。その栽培だけで2022年の全農地面積の約16.44%を占めています。コメはアジアと太平洋地域のほとんどの地域で主食となっています。中国は2022年に1億4,700万トンの米を生産し、インドは1億2,400万トンの米を収穫すると予測されています。インドは1億900万トンを消費する一方、世界最多の1,950万トンを輸出すると予想されました。
- 畑作物に対する国内外の需要の急増は、畑作物専用の耕作面積の拡大を促しています。この耕作地の大幅な増加は、2023年から2030年にかけてアジア太平洋地域のCRF市場に直接的かつプラスの影響を与えると予想されます。
世界の農地からの亜酸化窒素排出量の約28%は中国の農地によるものです。
- 畑作物では、同国の一次養分(窒素、カリウム、リン)の平均施用量は2022年に129.1kg/haでした。窒素は58.5%、カリウムは25.3%、リンは16.1%でした。ほとんどの一次養分は土壌施用法で施用されています。2022年の一次多量栄養素肥料市場全体の69.2%は、従来型の土壌ベースの一次多量栄養素肥料でした。
- アジアでは一次栄養素の投入量が多く、特に窒素肥料とカリ肥料が多いです。しかし、国土面積と人口で世界最大の地域であるアジア太平洋地域は、世界の全地域の中で最大の農薬生産・消費地域でもあります。世界の農地からの亜酸化窒素排出量の約28%は、中国の農地から排出されています。
- 畑作物では、小麦の平均一次養分施用量は214.9 kg/haで、2022年の畑作物の中で最も多くなりました。一次養分では、窒素が448.5 kg/haの平均施用量で第1位を占めています。窒素は植物の代謝に大量に必要とされるからです。また、葉緑素やアミノ酸の主要成分でもあります。
- 窒素とリンによる地表水と地下水の汚染は、肥料の施用率や作物の大規模化に関する農家へのアドバイスが不十分だった結果と考えられてきました。しかし、動向は高効率肥料へとシフトしています。
アジア太平洋地域の放出制御肥料産業の概要
アジア太平洋地域の放出制御肥料市場は適度に統合されており、上位5社で61.40%を占めています。この市場の主要企業は以下の通りです。 Grupa Azoty S.A.(Compo Expert), Hebei Sanyuanjiuqi Fertilizer, ICL Group Ltd, National Fertilizers Ltd and New Mountain Capital(Florikan)(アルファベット順)
その他の特典
- エクセル形式の市場予測(ME)シート
- 3ヶ月のアナリストサポート
目次
第1章 エグゼクティブサマリーと主な調査結果
第2章 レポートのオファー
第3章 イントロダクション
- 調査の前提条件と市場定義
- 調査範囲
- 調査手法
第4章 主要産業動向
- 主要作物の作付面積
- 畑作物
- 園芸作物
- 平均養分施用率
- 主要養分
- 畑作物
- 園芸作物
- 主要養分
- 規制の枠組み
- バリューチェーンと流通チャネル分析
第5章 市場セグメンテーション
- コーティングタイプ
- ポリマー・コーティング
- ポリマー・硫黄コーティング
- その他
- 作物タイプ
- 畑作物
- 園芸作物
- 芝・観賞用
- 生産国
- オーストラリア
- バングラデシュ
- 中国
- インド
- インドネシア
- 日本
- パキスタン
- フィリピン
- タイ
- ベトナム
- その他アジア太平洋地域
第6章 競合情勢
- 主要な戦略動向
- 市場シェア分析
- 企業情勢
- 企業プロファイル
- Grupa Azoty S.A.(Compo Expert)
- Haifa Group
- Hebei Sanyuanjiuqi Fertilizer Co., Ltd.
- Hebei Woze Wufeng Biological Technology Co., Ltd
- ICL Group Ltd
- National Fertilizers Ltd
- New Mountain Capital(Florikan)
- Zhongchuang xingyuan chemical technology co.ltd
第7章 CEOへの主な戦略的質問
第8章 付録
- 世界概要
- 概要
- ファイブフォース分析フレームワーク
- 世界のバリューチェーン分析
- 市場力学(DROs)
- 情報源と参考文献
- 図表一覧
- 主要洞察
- データパック
- 用語集
The Asia-Pacific Controlled Release Fertilizer Market size is estimated at 214.5 million USD in 2025, and is expected to reach 304.8 million USD by 2030, growing at a CAGR of 7.27% during the forecast period (2025-2030).
China and India dominate the Asia-Pacific controlled-release fertilizers market
- During the study period, the market for polymer-coated controlled-release fertilizers experienced notable growth. By 2022, these fertilizers held a significant share of 76.0% in the overall controlled-release fertilizer (CRF) market in Asia-Pacific. The region's increasing emphasis on ecologically safe fertilizers is a key driver behind the surge in demand for new controlled-release options.
- The cultivation expansion of cereal and oilseeds, including corn, soybeans, and rapeseed, is propelling the market for poly-sulfur-coated urea. Moreover, excessive urea accumulation in soils has led to depletion, fueling the demand for poly-sulfur-coated controlled-release fertilizers. In addition, the market for poly-sulfur-coated CRFs is poised for growth, driven by factors like the rising demand for highly efficient and eco-friendly products. It is projected to achieve a value CAGR of 6.8% in the region between 2023-2030.
- In 2022, China dominated the market for other types of coated controlled-release fertilizers, commanding a 42.3% value share in the CRF market. Of these fertilizers, approximately 69.6% were utilized in field crops, with horticultural crops following suit.
- The use of chemical fertilizers has detrimental effects, including soil pH alteration, inhibition of microbial growth, and the release of greenhouse gases from excessive nitrogen application. These environmental concerns, coupled with escalating nutrient losses, are fueling the demand for alternative fertilizers. As a result, the market is projected to witness a CAGR of 6.2% in value during the period spanning from 2023 to 2030.
China dominates the APAC controlled-release fertilizer market
- Approximately 70.0% of the population in the Asia-Pacific region depends directly on agriculture as the primary source of their livelihood. However, the region's agriculture sector is facing many issues in terms of low productivity.
- China dominates the APAC controlled-release fertilizer market, accounting for 43.8% of the market value share in 2022. Polymer-coated fertilizers accounted for the largest share of the controlled-release fertilizer market, followed by polymer sulfur-coated fertilizers. The polymer-coated fertilizer segment was valued at USD 17.9 million in 2017, and it is anticipated to reach USD 58.0 million by 2030, mainly due to increasing NUE by reducing fertilizer consumption by adopting CRFs.
- India is the region's second-largest market for controlled-release fertilizers, accounting for 16.6% in 2022. Controlled-release urea is the most commonly used form of CRF in India. Nitrogen loss is one of the main problems faced by rice farmers, and the efficiency of nitrogen utilization in rice is often inadequate. This is due to the large loss of nitrogen due to volatilization, leaching, and denitrification. One way to improve nitrogen efficiency is to use controlled-release urea. Controlled-release urea generally outperforms granular urea fertilizers in reducing nitrogen loss, stimulating plant growth, and increasing nitrogen concentration.
- In 2017, the International Plant Nutrition Institute of China conducted a controlled-release urea fertilizer Application Program in Hubei province. It was proven that the consistent use of CRU fertilizer helps improve the yield and profitability of major crops, such as rice and eggplant. Hence, the market is expected to grow in the future.
Asia-Pacific Controlled Release Fertilizer Market Trends
The significant expansion of cultivation of major growing crops is anticipated to boost the growth of the market
- Field crop cultivation dominates the region, accounting for more than 95% of the total crop area. Rice, wheat, and corn are the major field crops produced in the region, together accounting for about 38% of the total crop area in 2022. The rising area under cultivation is expected to increase the demand for fertilizer usage in the country.
- The Asia-Pacific region, which includes China, India, Pakistan, and Australia, is among the world's largest wheat producers. China and India are also the world's largest wheat producers and consumers. The increase in demand and consumption of wheat is due to wheat being one of the major staple foods of this region, and the area increased by a percentage point during the study period. In 2022, China accounted for the production of 138 million metric tons of wheat, making it the largest wheat producer in the world, and India had a wheat production of 103 million metric tons.
- Rice is the largest cultivated field crop in the region. Its cultivation alone accounted for about 16.44% of the total agricultural land in 2022. Rice is the staple food of Asia and most parts of the Pacific region. China was projected to produce 147 million tons of rice, and India was expected to harvest 124 million tons of rice in 2022. India was expected to consume 109 million tons while exporting a world-leading 19.5 million tons.
- The surge in both domestic and international demand for field crops has prompted an expansion in the cultivation area dedicated to these crops. This significant increase in cultivated land is expected to have a direct and positive impact on the Asia-Pacific CRF market from 2023 to 2030.
About 28% of nitrous oxide emissions from croplands in the world are from China's agricultural lands
- In field crops, the average primary nutrient (nitrogen, potassium, and phosphorus) application rate in the country was 129.1 kg/ha in 2022. Nitrogen accounted for 58.5%, potassium for 25.3%, and phosphorus for 16.1% of the average primary nutrient application for field crops. Most primary nutrients were applied through the soil application method. Conventional soil-based primary macronutrient fertilizers accounted for 69.2% of the total primary macronutrient fertilizer market in 2022.
- In Asia, the primary nutrient input is high, particularly for nitrogenous and potassic fertilizers, because most soils in the region are deficient in nitrogen and potassic nutrients. However, Asia-Pacific, which is the largest region in the world in terms of land area and population, is also the largest producer and consumer of agrochemicals among all the regions worldwide. About 28% of nitrous oxide emissions from croplands worldwide are from China's agricultural lands.
- In field crops, wheat had an average primary nutrient application rate of 214.9 kg/ha, the highest among field crops in 2022. In primary nutrients, nitrogen occupies the first place with an average application rate of 448.5 kg/ha, as nitrogen is required in large amounts for plant metabolism. It is also a major component of chlorophyll and amino acids.
- The contamination of surface and groundwater with nitrogen and phosphorus has been considered a result of inadequate advice given to farmers regarding fertilizer application rates and a possible larger crop. However, the trend is shifting toward highly efficient fertilizers.
Asia-Pacific Controlled Release Fertilizer Industry Overview
The Asia-Pacific Controlled Release Fertilizer Market is moderately consolidated, with the top five companies occupying 61.40%. The major players in this market are Grupa Azoty S.A. (Compo Expert), Hebei Sanyuanjiuqi Fertilizer Co., Ltd., ICL Group Ltd, National Fertilizers Ltd and New Mountain Capital (Florikan) (sorted alphabetically).
Additional Benefits:
- The market estimate (ME) sheet in Excel format
- 3 months of analyst support
TABLE OF CONTENTS
1 EXECUTIVE SUMMARY & KEY FINDINGS
2 REPORT OFFERS
3 INTRODUCTION
- 3.1 Study Assumptions & Market Definition
- 3.2 Scope of the Study
- 3.3 Research Methodology
4 KEY INDUSTRY TRENDS
- 4.1 Acreage Of Major Crop Types
- 4.1.1 Field Crops
- 4.1.2 Horticultural Crops
- 4.2 Average Nutrient Application Rates
- 4.2.1 Primary Nutrients
- 4.2.1.1 Field Crops
- 4.2.1.2 Horticultural Crops
- 4.2.1 Primary Nutrients
- 4.3 Regulatory Framework
- 4.4 Value Chain & Distribution Channel Analysis
5 MARKET SEGMENTATION (includes market size in Value in USD and Volume, Forecasts up to 2030 and analysis of growth prospects)
- 5.1 Coating Type
- 5.1.1 Polymer Coated
- 5.1.2 Polymer-Sulfur Coated
- 5.1.3 Others
- 5.2 Crop Type
- 5.2.1 Field Crops
- 5.2.2 Horticultural Crops
- 5.2.3 Turf & Ornamental
- 5.3 Country
- 5.3.1 Australia
- 5.3.2 Bangladesh
- 5.3.3 China
- 5.3.4 India
- 5.3.5 Indonesia
- 5.3.6 Japan
- 5.3.7 Pakistan
- 5.3.8 Philippines
- 5.3.9 Thailand
- 5.3.10 Vietnam
- 5.3.11 Rest of Asia-Pacific
6 COMPETITIVE LANDSCAPE
- 6.1 Key Strategic Moves
- 6.2 Market Share Analysis
- 6.3 Company Landscape
- 6.4 Company Profiles
- 6.4.1 Grupa Azoty S.A. (Compo Expert)
- 6.4.2 Haifa Group
- 6.4.3 Hebei Sanyuanjiuqi Fertilizer Co., Ltd.
- 6.4.4 Hebei Woze Wufeng Biological Technology Co., Ltd
- 6.4.5 ICL Group Ltd
- 6.4.6 National Fertilizers Ltd
- 6.4.7 New Mountain Capital (Florikan)
- 6.4.8 Zhongchuang xingyuan chemical technology co.ltd
7 KEY STRATEGIC QUESTIONS FOR FERTILIZER CEOS
8 APPENDIX
- 8.1 Global Overview
- 8.1.1 Overview
- 8.1.2 Porter's Five Forces Framework
- 8.1.3 Global Value Chain Analysis
- 8.1.4 Market Dynamics (DROs)
- 8.2 Sources & References
- 8.3 List of Tables & Figures
- 8.4 Primary Insights
- 8.5 Data Pack
- 8.6 Glossary of Terms
