
|
市場調査レポート
商品コード
1911702
エビ:市場シェア分析、業界動向と統計、成長予測(2026年~2031年)Shrimp - Market Share Analysis, Industry Trends & Statistics, Growth Forecasts (2026 - 2031) |
||||||
カスタマイズ可能
適宜更新あり
|
|||||||
| エビ:市場シェア分析、業界動向と統計、成長予測(2026年~2031年) |
|
出版日: 2026年01月12日
発行: Mordor Intelligence
ページ情報: 英文 391 Pages
納期: 2~3営業日
|

概要
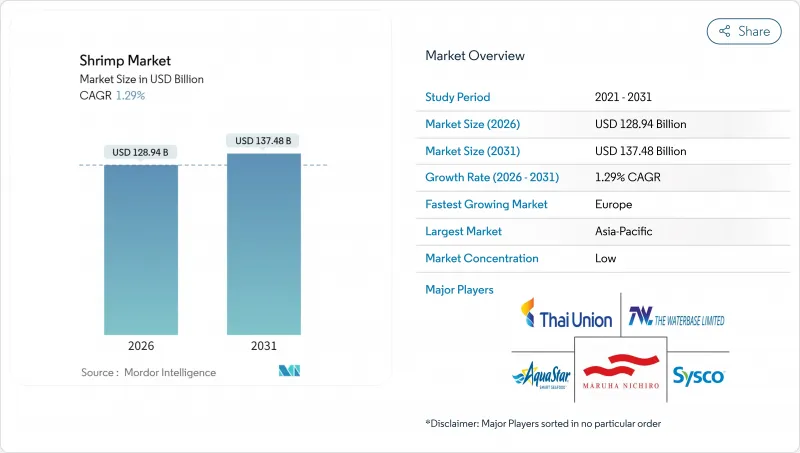
エビ市場は、2025年の1,273億米ドルから2026年には1,289億4,000万米ドルへ成長し、2026年から2031年にかけてCAGR1.29%で推移し、2031年までに1,374億8,000万米ドルに達すると予測されています。
気候変動や疾病発生が従来の開放式養殖の信頼性を脅かす中、陸上循環式養殖システムが注目を集めております。垂直統合企業は、原料調達・加工・流通を含むバリューチェーン全体を管理することで業務効率化を進めております。特に欧州における持続可能性重視の調達方針が、世界の貿易パターンに影響を与えております。品種別では、ピンクエビが現在市場を独占しておりますが、養殖技術の革新によりタイガーエビが有力な競合として台頭してまいりました。製品形態では冷凍エビが市場をリードしていますが、缶詰エビも顕著な成長を見せています。供給源に関しては養殖エビの生産が拡大を続けていますが、天然エビは品質の高さが評価され、プレミアムな地位を維持しています。流通チャネルにおいては、従来は外食産業向け販売が主流でしたが、エビ業界全体で小売チャネルの成長が加速しています。エビ市場は依然として高度に分散化されており、生産は多数の小規模養殖池経営者、協同組合、加工業者に分散しています。
世界のエビ市場の動向と洞察
タンパク質豊富な食品に対する消費者需要の高まり
消費者がタンパク質摂取を重視する傾向が強まり、エビ市場の成長を牽引しております。健康的でバランスの取れた食生活への移行に伴い、栄養価が高く調理が容易なエビは人気の選択肢となっております。国際食品情報評議会(IFIC)の「2024年食品と健康に関する調査」によれば、アメリカ人の71%が積極的にタンパク質摂取量の増加を目指しており、タンパク質豊富な食事の世界の動向が浮き彫りとなっています。この需要は、英国王立化学協会が健康な女性に対して1日45グラム、健康な男性に対して55グラムのタンパク質摂取を推奨していることと一致しています。2024年のMedical News Todayによれば、調理済みエビ100グラムあたり約24グラムのタンパク質を含むため、エビはこれらの要件を満たす優れた選択肢です。エビは手頃な価格で調理が簡単、かつ多様な調理法に対応できるため、牛肉や鶏肉などの高価なタンパク源に代わる実用的な選択肢となっています。これらの要因が相まって、エビは世界のタンパク質消費動向における重要な構成要素としての地位を確固たるものにしています。
養殖能力の拡大
養殖能力の拡大は、政府主導の施策と民間セクターの投資の両方によって支えられ、市場成長を牽引する主要因です。インドでは、プラダン・マントリ・マツヤ・サンパダ・ヨジャナ(PMMSY)により、2020年から2025年にかけて、アンドラ・プラデシュ州における先進的な養殖池システムや循環式システムを含む養殖インフラ整備に2,398.72カロールインドルピーが割り当てられています。このうち中央政府の補助金は559.10カロールインドルピーに上ります。インド政府によれば、同州は6万8,000件以上の養殖サービス接続に対して4,095.17カロールインドルピーの電力補助金を支給し、エビ養殖業者を支援するため電気料金の割引を提供しています。同様に、サウジアラビアの国立養殖グループ(Naqua)は、同国の「ビジョン2030」食料安全保障目標に沿い、2030年までにエビ生産能力を年間25万トンに拡大する取り組みを進めています。エビ養殖能力の拡大、インフラの改善、生産コスト削減に向けた努力は、世界のサプライチェーンの強化において重要な役割を果たしています。
飼料価格の高騰と養殖場における疾病発生
飼料コストの上昇と頻繁な疾病発生は、収益性と生産安定性の両方に重大な影響を与える市場の主要課題です。養殖業における飼料費は総コストの約3分の2を占め、この分野は商品価格の変動に対して非常に脆弱な立場にあります。例えば2024年には、ブラジルの干ばつが大豆価格の急騰を引き起こし、アジア全域で生産コストが大幅に上昇しました。養殖業者はこうしたコスト上昇に対応するため飼料配合を調整せざるを得ませんでしたが、その影響は既に顕在化しています。早期死亡症候群(EMS)や白点病などの疾病は依然として養殖場に深刻な打撃を与えており、米国海洋大気庁(NOAA)漁業局の報告によれば、深刻な発生時には養殖場によっては最大80%の死亡率を記録した事例もあります。これらの疾病が一般的な治療法に対する耐性を強めているため、養殖業者は改良された通気システム、水交換技術、疾病管理ソリューションなどの予防策への投資を迫られています。
セグメント分析
ピンクエビは2025年に市場シェアの45.62%という大きな割合を占めました。これは主に、幅広い消費者への訴求力、効率的な加工システム、年間を通じた安定した供給が要因です。その人気は、信頼できる品質、調理の容易さ、様々な料理への適応性によるもので、家庭やレストラン双方で好まれる選択肢となっています。さらに、殻むき・背わた取り済みなどの付加価値製品の提供が需要を後押ししています。ピンクエビは確立された貿易ネットワークと規模の経済の恩恵を受けており、世界のエビ消費における主要な貢献者として地位を固めています。
一方、タイガーエビは2031年までにCAGR2.33%と、より速いペースでの成長が見込まれています。この成長は特定病原体フリー(SPF)遺伝学の進歩に牽引されており、生存率の向上と大型サイズの生産を可能にし、グルメ市場やレストラン市場で高価格での販売を実現しています。タイガーシュリンプは、特に北米、欧州、アジアの一部地域など、高級外食産業や輸出市場で注目を集めています。遺伝学の進歩、専門的な養殖技術、そして高級シーフードに対する消費者需要の高まりが相まって、タイガーシュリンプは市場において急成長するセグメントとしての地位を確立しつつあります。
冷凍エビは2025年においても世界市場をリードし続け、64.10%のシェアを占めています。この優位性は主に個別急速冷凍(IQF)技術の進歩によるもので、エビの食感、風味、鮮度を維持するのに役立っています。冷凍エビは、その利便性、長い保存期間、安定した品質から高く評価されており、消費者と小売業者の双方にとって最良の選択肢となっています。強力なコールドチェーンインフラの存在が、スーパーマーケット、外食産業、国際市場への流通を支えています。冷凍倉庫と物流への継続的な投資が、冷凍エビの新たな地域への進出を助け、その成長をさらに促進しています。
缶詰エビは着実に人気を集めており、2031年までCAGR3.62%で拡大が見込まれます。その主な利点は保存性に優れている点にあり、冷蔵設備が限られている、あるいは不安定な地域に適しています。消費者は、缶詰エビの利便性と汎用性にますます惹かれています。これは、調理不要の食事、スナック、様々なレシピに使用できるためです。この形態は、食習慣の変化や水産物へのアクセス拡大が進む新興市場において特に魅力的です。保存が容易で調理不要のタンパク源への需要が高まる中、缶詰エビはエビ産業において重要なニッチ市場を切り開いています。
エビ市場レポートは、種別(ピンクシュリンプ、タイガーシュリンプなど)、形態(缶詰、生鮮/冷蔵など)、供給源(養殖・天然)、流通経路(小売・外食)、地域(北米、欧州、アジア太平洋、南米、中東・アフリカ)ごとに分析されています。市場予測は、金額(米ドル)および数量(トン)で提供されます。
地域別分析
2025年、アジア太平洋地域はエビ市場収益の52.10%を占めました。これは、インド、ベトナム、タイなどの国々における低労働コスト、広大な海岸線、強力な輸出インフラに牽引されたものです。政府による曝気装置や親エビ輸入への補助金などの支援が、同地域の競争優位性をさらに強化しています。しかしながら、疾病発生や人件費上昇といった課題により、収益性維持のため自動給餌システムや循環式養殖システム(RAS)の導入を進める生産者も増加しています。中国やインドネシアなどにおける国内需要の高まりは、特に国際輸送費が上昇する状況下で、生産者が低利益率の輸出よりも国内市場を優先することを可能にしております。
欧州は最も成長が著しい地域であり、2031年までCAGR2.15%が見込まれています。この成長は主に、持続可能な水産物を促進する厳格な規制によって牽引されており、認証製品の需要増加につながっています。例えばドイツやオランダでは、ASC認証エビのみを販売する小売プログラムを実施しており、非認証輸入品と比較して高価格での販売を可能にしています。一方、英国やデンマークでは陸上養殖のスタートアップ企業が再生可能エネルギーを活用し、地域密着型かつ持続可能な生産を推進しています。これらの事業規模はまだ小さいもの、エビ産業におけるカーボンフットプリント削減を目指す外食チェーンが持続可能性を重要視する中、市場の変化の可能性を示唆しています。
北米は依然として規制の厳しい輸入市場であり、強固なコールドチェーンシステム、分量管理された包装、厳格な食品安全基準などの要素が供給業者の適格性を決定します。インドやベトナム産エビに対する反ダンピング関税などの最近の貿易措置は、エクアドルやホンジュラスからの輸出業者に機会をもたらしました。こうした動きは、フロリダ州、テキサス州、マサチューセッツ州などの米国における内陸型RAS養殖場の成長を促進しています。南米では、エクアドルが深水港と通年生産体制を背景に市場をリードしております。中東・アフリカ地域では、食料安全保障への投資と温度管理型小売インフラの拡充が、従来のサプライチェーン制約を克服する一助となり、エビ市場は発展途上にあります。
その他の特典:
- エクセル形式の市場予測(ME)シート
- アナリストによる3ヶ月間のサポート
よくあるご質問
目次
第1章 イントロダクション
- 調査の前提条件と市場の定義
- 調査範囲
第2章 調査手法
第3章 エグゼクティブサマリー
第4章 市場情勢
- 市場概要
- 市場促進要因
- タンパク質豊富な食品に対する消費者需要の高まり
- 技術と農業の革新
- 世界の水産物貿易と輸出機会の拡大
- 持続可能で認証済み、倫理的かつトレーサブルなエビに対する消費者需要の高まり
- 外食産業およびエスニック料理の需要
- 養殖業の拡大
- 市場抑制要因
- 労働力とインフラの課題
- 飼料価格の上昇と生産農場における疾病発生
- 厳格な規制および品質基準
- 気候変動と水質塩分濃度問題
- 規制の見通し
- 消費者行動分析
- ポーターのファイブフォース
- 新規参入業者の脅威
- 買い手の交渉力
- 供給企業の交渉力
- 代替品の脅威
- 競争企業間の敵対関係
第5章 市場規模と成長予測(金額と数量)
- 種属別
- ピンクシュリンプ
- タイガーシュリンプ
- ロックシュリンプ
- その他
- 形態別
- 缶詰
- 生鮮・冷蔵
- 冷凍
- 乾燥
- 由来別
- 養殖
- 天然
- 流通チャネル別
- オフトレード
- スーパーマーケット/ハイパーマーケット
- オンライン小売店
- コンビニエンスストア
- その他
- オントレード
- オフトレード
- 地域別
- 北米
- 米国
- カナダ
- メキシコ
- その他北米地域
- 南米
- ブラジル
- コロンビア
- チリ
- ペルー
- アルゼンチン
- その他南米
- 欧州
- 英国
- ドイツ
- フランス
- イタリア
- スペイン
- ポーランド
- ベルギー
- スウェーデン
- その他欧州地域
- アジア太平洋地域
- 中国
- 日本
- インド
- オーストラリア
- インドネシア
- 韓国
- タイ
- シンガポール
- その他アジア太平洋地域
- 中東・アフリカ
- 南アフリカ
- サウジアラビア
- アラブ首長国連邦
- ナイジェリア
- エジプト
- モロッコ
- トルコ
- その他中東・アフリカ地域
- 北米
第6章 競合情勢
- 市場集中度
- 戦略的動向
- 市場シェア分析
- 企業プロファイル
- Mazzetta Company, LLC
- Aqua Star Corp
- Trident Seafoods Corp.
- Sahlman Seafoods, Inc.
- The Waterbase Limited
- The Bumble Bee Seafood Company
- Thai Union(Chicken of the Sea)
- Avanti Feeds Limited
- Dulcich Inc.
- Premium Brands Holdings Corporation
- Ocean Garden Products Inc.(Central Seaway Company)
- Biloxi Freezing & Processing, Inc
- Apex Frozen Foods Ltd
- Maruha Nichiro Corp.(Umios Corp.)
- Sun Shrimp
- Beaver Street Fisheries
- Woods Fisheries
- Sysco Corporation
- Inland Shrimp Company
- High Liner Foods Inc.

