
|
市場調査レポート
商品コード
1692063
米国のエビ:市場シェア分析、産業動向、成長予測(2025年~2030年)United States Shrimp - Market Share Analysis, Industry Trends & Statistics, Growth Forecasts (2025 - 2030) |
||||||
カスタマイズ可能
適宜更新あり
|
|||||||
| 米国のエビ:市場シェア分析、産業動向、成長予測(2025年~2030年) |
|
出版日: 2025年03月18日
発行: Mordor Intelligence
ページ情報: 英文 180 Pages
納期: 2~3営業日
|

全表示
- 概要
- 目次
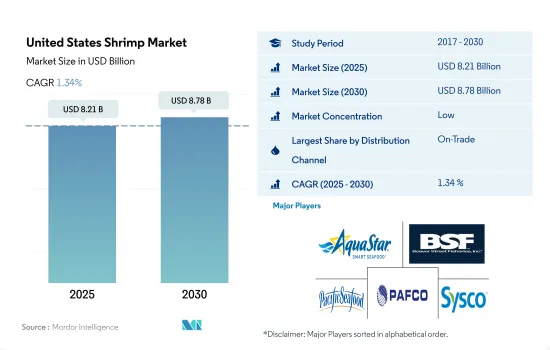
米国のエビ市場規模は2025年に82億1,000万米ドルと推定され、2030年には87億8,000万米ドルに達すると予測され、予測期間中(2025年~2030年)のCAGRは1.34%で成長する見込みです。
水産物への消費支出の増加が売上を押し上げる
- 全体として、オン・トレード・チャネルを通じたエビ製品の売上は2020~2022年の間に5.26%増加しました。そのいくつかの健康上の利点により、米国での消費が増加しています。学生人口の増加が需要に拍車をかけています。例えば、米国では2021年に1,866万人の大学生が手頃な価格の選択肢を探しており、エビ加工品の販売増につながっています。
- 米国人はエビを含むシーフードを食べるために、その約65%をレストランで消費するため、オン・トレード・チャネルがエビ販売の主要チャネルとなっています。この成長の背景には、スマートフォンユーザーの増加があります。これにより、同国ではオンライン・デリバリー・アプリの利用が増加しており、2020年から2021年の間に1,100万人増加しました。人口の約45%がモバイル端末を通じてオンラインサイトを閲覧しています。2021年には都市人口が約83.1%と高いため、同国のオンライン水産物注文の消費者基盤は高いです。
- 非売品部門では、店頭で売られているエビのほとんどが冷凍品であるため、消費者はスーパーマーケットやハイパーマーケットでエビを購入することを好みます。スーパーマーケットで大量に買い物をすると割引券がもらえます。米国では2018年から2020年にかけて、スーパーマーケットでのエビの販売額が65%増加しました。国内には約6万2,000の小売店があり、そのうち70%から75%がエビを扱っています。コンビニエンスストアは販売額ベースで8.7%の成長を記録しました。調理済み食品やコンビニエンス・フードの需要は、女性の労働力率の上昇と都市人口の高さ(2022年には56%)により増加しています。2022年の約2万7,000店舗は、KrogerやPublixのように、1店舗あたりより幅広い客層を対象としています。
米国のエビ市場動向
エビ生産者不足が成長鈍化の原因
- 米国の商業エビ生産は、成長率は遅いが一貫しており、2017年から2022年までのCAGRは0.51%を記録しました。エビの大半は冷凍状態で全米に出荷されるか、加工工場に運ばれ、そこで無菌処理され、保存期間を延ばすために缶詰にされます。ルイジアナ州の2021年のエビの水揚げ量は33,554MTで、国内最大の生産者となり、次いでテキサス州(比較生産量29,410MT)、オレゴン州(21,171MT)、アラバマ州(11,137MT)、東フロリダ州(10,403MT)と続きます。
- エビ生産者の不足が、この国の成長鈍化の主な原因のひとつです。テキサス州のエビ生産者は現在6~7社程度であるが、これはエビの輸入価格が手ごろでないため、多くの生産者がエビの養殖からヒレ科魚類の養殖に切り替えざるを得なかったためです。2020年にエビの飼料価格が下がったことで、エビ養殖業者は生産により投資するようになり、その結果、最終製品の価格が下がりました。しかし、パンデミック後の高運賃、海上燃料費の上昇、物流の混乱がエビ価格を押し上げました。そのため、2022年の平均エビ価格は2021年比で7%上昇し、15米ドル/kgとなりました。
- 飼料はエビの生産コストのほぼ40%を占める。米国でエビの飼料製造施設を設立・所有するにはコストがかかるため、飼料のほとんどはアジアから輸入されています。国内の養殖施設の投資コストは、1ヘクタールあたり約6万4,000米ドル、年間収量は1ヘクタールあたり約2,270kgとされています。エビの飼料はインドなどから輸入されており、施設設立費用は1ヘクタール当たり400米ドル程度で、年間収量は1ヘクタール当たり600キロです。しかし、国内のエビ飼料メーカーは、中国から原材料を輸入して国内で製造する傾向にあります。
海上燃料費の高騰と物流の混乱が価格上昇につながった
- 運賃の高騰、海上燃料費の高騰、米国や欧州における港湾のボトルネックや物流労働者の不足などの物流の混乱が、国内のエビの卸売価格を押し上げる可能性があります。エビの需要は東欧、西欧、米国で急成長が見込まれます。物流費の増加がこの高騰の主な要因になると予想されます。2021年9月から2022年9月にかけて、アジアから北米への国際運賃は20フィートコンテナで500%、40フィートコンテナで700%(それぞれ1万3,000米ドル、2万米ドル)上昇したが、これはサプライチェーンの混乱によるものです。この上昇により、2017年から2022年にかけてエビの小売価格は15.6%上昇しました。
- 米国では多くのレストランがテイクアウト、オンラインデリバリー、出前サービスに転換したため、エビの売上は近年増加しています。米国におけるエビのオンライン販売は、2020年に167%、2021年に42%、2022年に30%増加しており、サブセグメントの成長を示しています。しかし、米国による貿易緊張と水産物への関税賦課が影響し、2022年の価格上昇は2021年比で12%でした。2022年1月から6月までの米国の輸入総額は、生製品の需要が減少したため、ほぼ3.8%増と緩やかに増加しました。レストランでよく使われるむきエビの消費者需要は特に低調でした。加工エビの輸入は2021年に前年比29.79%増加しました。米国は過去最高のエビ輸入量を記録し、輸出国の出荷量が過去最高であったにもかかわらず、ほぼすべての品種で高値水準となりました。米国の2022年1月のエビ輸入量は7万8,716トンで、2021年の6万9,653トンに対し、kgあたり単価は5.1米ドルでした。
米国のエビ産業概要
米国のエビ市場は細分化されており、上位5社で10.77%を占めています。この市場の主要企業は以下の通りです。 Admiralty Island Fisheries Inc., Beaver Street Fisheries, Dulcich Inc., Pacific American Fish Company Inc. and Sysco Corporation(sorted alphabetically).
その他の特典
- エクセル形式の市場予測(ME)シート
- 3ヶ月のアナリストサポート
目次
第1章 エグゼクティブサマリーと主な調査結果
第2章 イントロダクション
- 調査の前提条件と市場定義
- 調査範囲
- 調査手法
第3章 主要産業動向
- 価格動向
- エビ
- 生産動向
- エビ
- 規制の枠組み
- 米国
- バリューチェーンと流通チャネル分析
第4章 市場セグメンテーション
- 形態
- 缶詰
- 生鮮/冷蔵
- 冷凍
- 加工
- 流通チャネル
- オフ・トレード
- コンビニエンスストア
- オンライン・チャネル
- スーパーマーケットとハイパーマーケット
- その他
- オン・トレード
- オフ・トレード
第5章 競合情勢
- 主要な戦略動向
- 市場シェア分析
- 企業情勢
- 企業プロファイル
- Admiralty Island Fisheries Inc.
- Beaver Street Fisheries
- Dulcich Inc.
- Gulf Shrimp Co. LLC
- Millennium Ocean Star Corporation
- NaturalShrimp Inc.
- Pacific American Fish Company Inc.
- Paul Piazza & Son Inc.
- Sysco Corporation
- The American Shrimp Company
第6章 CEOへの主な戦略的質問
第7章 付録
- 世界概要
- 概要
- ファイブフォース分析フレームワーク
- 世界のバリューチェーン分析
- 市場力学(DROs)
- 情報源と参考文献
- 図表一覧
- 主要洞察
- データパック
- 用語集
The United States Shrimp Market size is estimated at 8.21 billion USD in 2025, and is expected to reach 8.78 billion USD by 2030, growing at a CAGR of 1.34% during the forecast period (2025-2030).
Increased consumer spending on seafood is boosting sales
- Overall, the sales of shrimp products through the on-trade channel increased by 5.26% during 2020-2022. Its several health advantages have led to increased consumption in the United States. The rise in student population is fueling the demand. For instance, 18.66 million college students in the United States in 2021 were looking for affordable options, thus leading to increased processed shrimp sales.
- The on-trade channel is the major channel for shrimp sales, as Americans spend around 65% of their money in restaurants to eat seafood, including shrimp. This growth is due to the increasing number of smartphone users. This is increasing the use of online delivery apps in the country, which increased by 11 million between 2020 and 2021. Around 45% of the population browse online websites through mobile devices. Due to the high urban population of around 83.1% in 2021, the country's consumer base for online seafood orders is high.
- In the off-trade segment, consumers prefer buying shrimp from supermarkets/hypermarkets, as most of the shrimp sold in stores are frozen. People get discount coupons for bulk shopping in supermarkets. Supermarket sales for shrimp grew by 65% in value from 2018 to 2020 in the United States. There are around 62,000 retail stores in the country, out of which 70% to 75% offer shrimp with a separate section so that consumers can choose the product of their choice. Convenience stores recorded growth of 8.7% in terms of sales value. The demand for ready-to-cook and convenience food is increasing due to the rising female labor force rate and high urban population, which was 56% in 2022. Around 27,000 stores in 2022 catered to a wider audience per store, like Kroger and Publix.
United States Shrimp Market Trends
The lack of shrimp producers is the reason for slow growth
- Commercial shrimp production in the United States saw a slow but consistent growth rate, registering a CAGR of 0.51% from 2017 to 2022. Most of the shrimp is shipped in frozen form across the country or to processing plants where it is aseptically processed and canned to prolong shelf life. Louisiana had 33,554 MT of shrimp in landings in 2021, becoming the country's largest producer, followed by Texas, with a comparative production volume of 29,410 MT, Oregon (21,171 MT), Alabama (11,137 MT), and East Florida (10,403 MT).
- The lack of shrimp producers is one of the main reasons for this slow growth in the country. Texas currently has about six or seven shrimp producers, as unaffordable shrimp imports forced many of them to switch from shrimp cultivation to finfish farming. Lower shrimp feed prices in 2020 encouraged shrimp farmers to invest more in production, resulting in lower prices for the end product. However, post-pandemic, high freight rates, rising marine fuel costs, and logistical disruptions pushed shrimp prices higher. Thus, the average shrimp price in 2022 increased by 7% compared to 2021, to USD 15/kg.
- Feed represents almost 40% of the shrimp production costs. Feed is mostly imported from Asia, as it is costly to set up and own a shrimp feed manufacturing facility in the United States. Investment costs for grow-out facilities in the country have been cited at about USD 64,000 per hectare, with a yield of approximately 2,270 kg per hectare per year. Shrimp feed is imported from countries like India, where the cost of setting up a facility is only around USD 400 per hectare, with an annual yield of 600 kg per hectare. However, shrimp feed manufacturers in the country tend to import raw materials from China to manufacture domestically.
The rising cost of marine fuels and logistical disruptions led to higher prices
- High freight rates, the rising cost of marine fuels, and logistical disruptions, including bottlenecks at seaports and shortages of logistic workers in the United States and Europe, may boost the wholesale prices of shrimps in the country. The demand for shrimp is anticipated to grow rapidly in Eastern and Western Europe and the United States. Rising logistic expenditures are expected to be the main drivers of this spike. Between September 2021 and September 2022, international freight costs from Asia to North America for 20-foot and 40-foot containers rose by 500% and 700% (at USD 13,000 and USD 20,000), respectively, due to supply chain disruptions. This rise resulted in a 15.6% increase in retail prices of shrimps from 2017 to 2022.
- Shrimp sales have increased in recent years, as many restaurants in the United States converted to take-out, online deliveries, and delivery services. Online shrimp sales in the United States increased by 167% in 2020, 42% in 2021, and 30% in 2022, thus showing the growth of the sub-segment. However, trade tensions and tariffs imposed on seafood products by the United States impacted the price increase by 12% in 2022 compared to 2021. Total US imports increased moderately by almost 3.8% from January to June 2022 as the demand for raw products declined. Consumer demand for peeled shrimp, which is commonly used in restaurants, was particularly low. Imports of processed shrimp increased by 29.79% in 2021 compared to the previous year. The United States imported record volumes of shrimp, and almost all varieties witnessed high price levels, even with record volumes being shipped by exporting countries. The United States imported 78,716 tons of shrimp in January 2022, as opposed to 69,653 tons in 2021, for a unit value of USD 5.1 per kg.
United States Shrimp Industry Overview
The United States Shrimp Market is fragmented, with the top five companies occupying 10.77%. The major players in this market are Admiralty Island Fisheries Inc., Beaver Street Fisheries, Dulcich Inc., Pacific American Fish Company Inc. and Sysco Corporation (sorted alphabetically).
Additional Benefits:
- The market estimate (ME) sheet in Excel format
- 3 months of analyst support
TABLE OF CONTENTS
1 EXECUTIVE SUMMARY & KEY FINDINGS
2 INTRODUCTION
- 2.1 Study Assumptions & Market Definition
- 2.2 Scope of the Study
- 2.3 Research Methodology
3 KEY INDUSTRY TRENDS
- 3.1 Price Trends
- 3.1.1 Shrimp
- 3.2 Production Trends
- 3.2.1 Shrimp
- 3.3 Regulatory Framework
- 3.3.1 United States
- 3.4 Value Chain & Distribution Channel Analysis
4 MARKET SEGMENTATION (includes market size in Value in USD, Forecasts up to 2030 and analysis of growth prospects)
- 4.1 Form
- 4.1.1 Canned
- 4.1.2 Fresh / Chilled
- 4.1.3 Frozen
- 4.1.4 Processed
- 4.2 Distribution Channel
- 4.2.1 Off-Trade
- 4.2.1.1 Convenience Stores
- 4.2.1.2 Online Channel
- 4.2.1.3 Supermarkets and Hypermarkets
- 4.2.1.4 Others
- 4.2.2 On-Trade
- 4.2.1 Off-Trade
5 COMPETITIVE LANDSCAPE
- 5.1 Key Strategic Moves
- 5.2 Market Share Analysis
- 5.3 Company Landscape
- 5.4 Company Profiles (includes Global level Overview, Market level overview, Core Business Segments, Financials, Headcount, Key Information, Market Rank, Market Share, Products and Services, and analysis of Recent Developments)
- 5.4.1 Admiralty Island Fisheries Inc.
- 5.4.2 Beaver Street Fisheries
- 5.4.3 Dulcich Inc.
- 5.4.4 Gulf Shrimp Co. LLC
- 5.4.5 Millennium Ocean Star Corporation
- 5.4.6 NaturalShrimp Inc.
- 5.4.7 Pacific American Fish Company Inc.
- 5.4.8 Paul Piazza & Son Inc.
- 5.4.9 Sysco Corporation
- 5.4.10 The American Shrimp Company
6 KEY STRATEGIC QUESTIONS FOR SEAFOOD INDUSTRY CEOS
7 APPENDIX
- 7.1 Global Overview
- 7.1.1 Overview
- 7.1.2 Porter's Five Forces Framework
- 7.1.3 Global Value Chain Analysis
- 7.1.4 Market Dynamics (DROs)
- 7.2 Sources & References
- 7.3 List of Tables & Figures
- 7.4 Primary Insights
- 7.5 Data Pack
- 7.6 Glossary of Terms

