
|
市場調査レポート
商品コード
1685798
中国の貨物・ロジスティクス-市場シェア分析、産業動向と統計、成長予測(2025年~2030年)China Freight and Logistics - Market Share Analysis, Industry Trends & Statistics, Growth Forecasts (2025 - 2030) |
||||||
カスタマイズ可能
適宜更新あり
|
|||||||
| 中国の貨物・ロジスティクス-市場シェア分析、産業動向と統計、成長予測(2025年~2030年) |
|
出版日: 2025年03月18日
発行: Mordor Intelligence
ページ情報: 英文 339 Pages
納期: 2~3営業日
|

全表示
- 概要
- 目次
概要
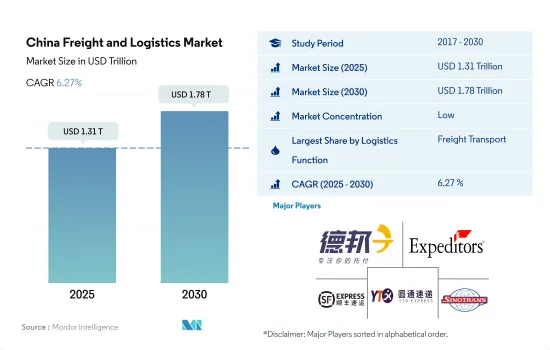
中国の貨物・ロジスティクス市場規模は2025年に1兆3,100億米ドルと推定・予測され、2030年には1兆7,800億米ドルに達し、予測期間(2025年~2030年)のCAGRは6.27%で成長すると予測されます。
業界の旺盛な需要と緩やかな供給による自社物流サービスの採用増加
- 2022年、都市内速達便の累計取扱量は1,280億件に達しました。宅配便部門は、2022年の最初の11ヵ月間に前年比1.6%の増収を記録しました。この増収は、消費者が日用必需品でさえもオンライン・ショッピングを利用するようになったため、ロックダウン中の宅配便サービスへの依存度が高まったことによる。このeコマースの急増は、宅配便・エクスプレス・小包(CEP)サービスの国内需要と取扱量を押し上げました。2023年6月、Cainiao GroupはAliExpressと協力し、国境を越えた小包配送を迅速化する計画を発表しました。
- 中国は物流部門を強化し、シームレスなサプライチェーンを確保するため、インフラへの投資を積極的に行っています。2022年だけでも、道路交通インフラの改善に34億米ドル以上を割り当てています。将来を見据えて、国家開発改革委員会は交通運輸省とともに、道路拡張の野心的な目標を設定しています。2035年までに、全国の道路網を高速道路29万9,000キロメートル、高速道路16万2,000キロメートルまで拡張することを目指しています。
中国の貨物・ロジスティクス市場の動向
第14次5ヵ年計画の下、クリーンエネルギー・インフラの開発と運輸部門への投資が成長を牽引します。
- 2023年、中国のクリーンエネルギー部門は同国の経済拡大に大きく貢献しました。エネルギー・アンド・クリーン・エア(CREA)によると、中国の再生可能エネルギー・インフラへの投資額は8,900億米ドルに達し、同年の化石燃料供給への世界投資額にほぼ匹敵しました。再生可能エネルギー源、原子力、電力網、エネルギー貯蔵、電気自動車(EV)、鉄道を含むクリーンエネルギーは、2023年には中国のGDPの9.0%を占め、前年比7.2%から増加します。EVの生産台数は2023年に前年比36%増加しました。
- 第14次5ヵ年計画(2021年~2025年)において、中国は交通網拡大の目標を明らかにしました。2025年までに、高速鉄道は2020年の38,000kmから50,000kmに拡大し、人口50万人以上の都市の95%を250kmの路線でカバーします。2025年までに、鉄道を165,000km、民間空港を270以上、都市部の地下鉄を10,000km、高速道路を190,000km、高水準内陸水路を18,500kmに増やすことを目標としています。2025年までに総合的な開発を達成することが第一の目標であり、交通システムの変革とGDPへの貢献の進展を重視しています。
ロシア・ウクライナ戦争の中、中国のディーゼル・ガソリン小売価格は歴史的な高水準に高騰しました。
- 2023年、中国の原油輸入量は2022年比11%増の5億6,399万トン、1日当たり1,128万バレルとなりました。この急増は、ロシア・ウクライナ戦争の中で世界の原油価格が上昇し、中国の燃料価格が歴史的な高値に達したためです。2024年1-2月期の原油輸入量は前年同期比5.1%増の8,831万トンに達しました。この増加は、先に安い価格で原油を購入したことによる。ブレント先物は2023年9月に97.69米ドルでピークを迎え、12月には72.29米ドルまで下落し、2024年3月には84.05米ドルまで上昇しました。2024年3月にOPEC+グループが減産を6月末まで延長すると決定したことで、原油価格はさらに上昇しました。同グループは世界需要の6%近くを減産するため、この動きは世界の石油需要に対する懸念を高めています。最近の原油価格の上昇は、2024年下半期からの中国の輸入にも水を差す可能性があります。
- 中国は、最近の世界の原油価格の変動に合わせて、ガソリンと軽油の小売価格を調整する予定です。今回の値上げは、世界の供給逼迫と需要見通しの好転を反映したものです。NDRCによると、中国のガソリンとディーゼルの価格は2024年にトン当たり28米ドル上昇します。燃料需要の減少が予想されるもの、2035年まで石油ベースの燃料が主要な選択肢であり続けると思われます。
中国の貨物・ロジスティクス産業の概要
中国の貨物・ロジスティクス市場は断片化されており、この市場の主要企業は、デッポン・ロジスティクス、エクスペディターズ・インターナショナル・オブ・ワシントン、SFエクスプレス(KEX-SF)、上海YTOエクスプレス(ロジスティクス)、SINOTRANSの5社である(アルファベット順)。
その他の特典:
- エクセル形式の市場予測(ME)シート
- 3ヶ月間のアナリスト・サポート
目次
第1章 エグゼクティブサマリーと主な調査結果
第2章 レポートのオファー
第3章 イントロダクション
- 調査の前提条件と市場定義
- 調査範囲
- 調査手法
第4章 主要産業動向
- 人口動態
- 経済活動別GDP分布
- 経済活動別GDP成長率
- インフレ率
- 経済パフォーマンスとプロファイル
- eコマース産業の動向
- 製造業の動向
- 運輸・倉庫業のGDP
- 輸出動向
- 輸入動向
- 燃料価格
- トラック輸送コスト
- タイプ別トラック保有台数
- 物流実績
- 主要トラックサプライヤー
- モーダルシェア
- 海上貨物輸送能力
- 定期船の接続性
- 寄港地とパフォーマンス
- 運賃動向
- 貨物トン数の動向
- インフラ
- 規制の枠組み(道路と鉄道)
- 中国
- 規制の枠組み(海上・航空)
- 中国
- バリューチェーンと流通チャネル分析
第5章 市場セグメンテーション
- エンドユーザー産業
- 農業、漁業、林業
- 建設業
- 製造業
- 石油・ガス、鉱業、採石業
- 卸売・小売業
- その他
- 物流機能
- クーリエ、エクスプレス、小包(CEP)
- 仕向地別
- 国内
- 国際
- 貨物輸送
- 輸送モード別
- 航空
- 海上・内水道
- その他
- 貨物輸送
- 輸送手段別
- 航空
- パイプライン
- 鉄道
- 道路
- 海上・内陸水路
- 倉庫保管
- 温度管理
- 温度管理なし
- 温度管理
- その他のサービス
- クーリエ、エクスプレス、小包(CEP)
第6章 競合情勢
- 主要な戦略動向
- 市場シェア分析
- 企業情勢
- 企業プロファイル.
- Deppon Logistics Co., Ltd.
- Deutsche Bahn AG(including DB Schenker)
- DHL Group
- Dimerco
- DSV A/S(De Sammensluttede Vognmaend af Air and Sea)
- Expeditors International of Washington, Inc.
- Kuehne+Nagel
- SF Express(KEX-SF)
- Shanghai YTO Express(Logistics)Co., Ltd.
- SINOTRANS
- United Parcel Service of America, Inc.(UPS)
第7章 CEOへの主な戦略的質問
第8章 付録
- 世界概要
- 概要
- ファイブフォース分析フレームワーク
- 世界のバリューチェーン分析
- 市場力学(市場促進要因、抑制要因、機会)
- 技術の進歩
- 情報源と参考文献
- 図表リスト
- 主要洞察
- データパック
- 用語集
- 為替レート
目次
Product Code: 47655
The China Freight and Logistics Market size is estimated at 1.31 trillion USD in 2025, and is expected to reach 1.78 trillion USD by 2030, growing at a CAGR of 6.27% during the forecast period (2025-2030).
Rising adoption of in-house logistics services owing to booming demand and moderate supply in the industry
- In 2022, intra-city express deliveries reached a cumulative volume of 128 billion. The parcel delivery sector saw a 1.6% Y-o-Y revenue increase in the first 11 months of 2022. This uptick was driven by heightened reliance on parcel services during lockdowns, as consumers increasingly turned to online shopping, even for daily essentials. This surge in e-commerce bolstered domestic demand and volume for courier, express, and parcel (CEP) services. In June 2023, Cainiao Group, in collaboration with AliExpress, announced plans to expedite cross-border parcel deliveries, aiming to cut delivery times to five working days, a 30% acceleration from the industry average.
- China is actively investing in infrastructure to bolster its logistics sector and ensure a seamless supply chain. In 2022 alone, the country allocated over USD 3.4 billion for road transport infrastructure improvements. Looking ahead, the National Development and Reform Commission, along with the Ministry of Transport, has set ambitious goals for road expansion. By 2035, they aim to extend the national road network to 299,000 kilometers of highways and 162,000 kilometers of expressways.
China Freight and Logistics Market Trends
Rising focus on developing clean energy infrastructure and transport sector investment under 14th Five-Year Plan driving growth
- In 2023, China's clean energy sector significantly contributed to the country's economic expansion. According to Energy and Clean Air (CREA), China's investment in renewable energy infrastructure amounted to USD 890 billion, almost matching global investments in fossil fuel supply for the same year. Clean energy, including renewable energy sources, nuclear power, electricity grids, energy storage, electric vehicles (EVs), and railways, constituted 9.0% of China's GDP in 2023, up from 7.2% YoY. EV production grew by 36% YoY in 2023.
- In the 14th Five-Year Plan (2021-2025), China revealed goals for expanding its transportation network. By 2025, high-speed railways will extend to 50,000 kms, up from 38,000 kms in 2020, with 95% of cities with populations above 500,000 covered by 250-km lines. The country aims to increase its railway length to 165,000 kms, civil airports to over 270, subway lines in cities to 10,000 kms, expressways to 190,000 kms, and high-level inland waterways to 18,500 kms by 2025. The primary objective is to achieve integrated development by 2025, emphasizing advancements in the transformation of the transportation system and its contribution to GDP.
China's retail diesel and gasoline prices were soared to historically high levels amid the Russia-Ukraine War
- In 2023, China imported 11% more crude oil than in 2022, totaling 563.99 mn metric tons (MMT), or 11.28 mn barrels per day. This surge was due to increased global crude oil prices amid the Russia-Ukraine War, causing fuel prices in China to reach historic highs. In Jan-Feb 2024, crude oil imports rose by 5.1% YoY, reaching 88.31 MMT. This increase was driven by purchasing crude oil at lower prices earlier. Brent futures peaked at USD 97.69 in September 2023, fell to USD 72.29 in December, and rose to USD 84.05 by March 2024. The decision made by the OPEC+ group in March 2024 to extend output cuts until the end of June has further boosted crude prices. This move has raised concerns about global oil demand, as the group is reducing production by nearly 6% of world demand. The recent increase in crude prices may also dampen China's imports starting from H2 2024.
- China plans to adjust retail prices for gasoline and diesel to align with recent shifts in global crude oil prices. The price hike reflects a tightening of global supply and a positive forecast for demand. According to NDRC, gasoline and diesel prices in China will increase by USD 28 per ton in 2024. Although there's expectation of declining demand for fuels, oil-based fuels will remain the primary choice until 2035.
China Freight and Logistics Industry Overview
The China Freight and Logistics Market is fragmented, with the major five players in this market being Deppon Logistics Co., Ltd., Expeditors International of Washington, Inc., SF Express (KEX-SF), Shanghai YTO Express (Logistics) Co., Ltd. and SINOTRANS (sorted alphabetically).
Additional Benefits:
- The market estimate (ME) sheet in Excel format
- 3 months of analyst support
TABLE OF CONTENTS
1 EXECUTIVE SUMMARY & KEY FINDINGS
2 REPORT OFFERS
3 INTRODUCTION
- 3.1 Study Assumptions & Market Definition
- 3.2 Scope of the Study
- 3.3 Research Methodology
4 KEY INDUSTRY TRENDS
- 4.1 Demographics
- 4.2 GDP Distribution By Economic Activity
- 4.3 GDP Growth By Economic Activity
- 4.4 Inflation
- 4.5 Economic Performance And Profile
- 4.5.1 Trends in E-Commerce Industry
- 4.5.2 Trends in Manufacturing Industry
- 4.6 Transport And Storage Sector GDP
- 4.7 Export Trends
- 4.8 Import Trends
- 4.9 Fuel Price
- 4.10 Trucking Operational Costs
- 4.11 Trucking Fleet Size By Type
- 4.12 Logistics Performance
- 4.13 Major Truck Suppliers
- 4.14 Modal Share
- 4.15 Maritime Fleet Load Carrying Capacity
- 4.16 Liner Shipping Connectivity
- 4.17 Port Calls And Performance
- 4.18 Freight Pricing Trends
- 4.19 Freight Tonnage Trends
- 4.20 Infrastructure
- 4.21 Regulatory Framework (Road and Rail)
- 4.21.1 China
- 4.22 Regulatory Framework (Sea and Air)
- 4.22.1 China
- 4.23 Value Chain & Distribution Channel Analysis
5 MARKET SEGMENTATION (includes 1. Market value in USD for all segments 2. Market volume for select segments viz. freight transport, CEP (courier, express, and parcel) and warehousing & storage 3. Forecasts up to 2030 and analysis of growth prospects)
- 5.1 End User Industry
- 5.1.1 Agriculture, Fishing, and Forestry
- 5.1.2 Construction
- 5.1.3 Manufacturing
- 5.1.4 Oil and Gas, Mining and Quarrying
- 5.1.5 Wholesale and Retail Trade
- 5.1.6 Others
- 5.2 Logistics Function
- 5.2.1 Courier, Express, and Parcel (CEP)
- 5.2.1.1 By Destination Type
- 5.2.1.1.1 Domestic
- 5.2.1.1.2 International
- 5.2.2 Freight Forwarding
- 5.2.2.1 By Mode Of Transport
- 5.2.2.1.1 Air
- 5.2.2.1.2 Sea and Inland Waterways
- 5.2.2.1.3 Others
- 5.2.3 Freight Transport
- 5.2.3.1 By Mode Of Transport
- 5.2.3.1.1 Air
- 5.2.3.1.2 Pipelines
- 5.2.3.1.3 Rail
- 5.2.3.1.4 Road
- 5.2.3.1.5 Sea and Inland Waterways
- 5.2.4 Warehousing and Storage
- 5.2.4.1 By Temperature Control
- 5.2.4.1.1 Non-Temperature Controlled
- 5.2.4.1.2 Temperature Controlled
- 5.2.5 Other Services
- 5.2.1 Courier, Express, and Parcel (CEP)
6 COMPETITIVE LANDSCAPE
- 6.1 Key Strategic Moves
- 6.2 Market Share Analysis
- 6.3 Company Landscape
- 6.4 Company Profiles (includes Global Level Overview, Market Level Overview, Core Business Segments, Financials, Headcount, Key Information, Market Rank, Market Share, Products and Services, and Analysis of Recent Developments).
- 6.4.1 Deppon Logistics Co., Ltd.
- 6.4.2 Deutsche Bahn AG (including DB Schenker)
- 6.4.3 DHL Group
- 6.4.4 Dimerco
- 6.4.5 DSV A/S (De Sammensluttede Vognmaend af Air and Sea)
- 6.4.6 Expeditors International of Washington, Inc.
- 6.4.7 Kuehne+Nagel
- 6.4.8 SF Express (KEX-SF)
- 6.4.9 Shanghai YTO Express (Logistics) Co., Ltd.
- 6.4.10 SINOTRANS
- 6.4.11 United Parcel Service of America, Inc. (UPS)
7 KEY STRATEGIC QUESTIONS FOR FREIGHT AND LOGISTICS CEOS
8 APPENDIX
- 8.1 Global Overview
- 8.1.1 Overview
- 8.1.2 Porter's Five Forces Framework
- 8.1.3 Global Value Chain Analysis
- 8.1.4 Market Dynamics (Market Drivers, Restraints & Opportunities)
- 8.1.5 Technological Advancements
- 8.2 Sources & References
- 8.3 List of Tables & Figures
- 8.4 Primary Insights
- 8.5 Data Pack
- 8.6 Glossary of Terms
- 8.7 Currency Exchange Rate

