
炭酸飲料:市場シェア分析、業界動向と統計、成長予測(2026年~2031年)
Carbonated Beverages - Market Share Analysis, Industry Trends & Statistics, Growth Forecasts (2026 - 2031)- 発行日
- ページ情報
- 英文 391 Pages
- 納期
- 2~3営業日
- 商品コード
- 1937434
- カスタマイズ可能 お客様のご希望に応じて、既存データの加工や未掲載情報(例:国別セグメント)の追加などの対応が可能です。詳細はお問い合わせください。
- 適宜更新あり 本レポートは最新情報反映のため適宜更新し、内容構成変更を行う場合があります。ご検討の際はお問い合わせください。
- 翻訳ツール提供対象 PDF対応AI翻訳ツールの無料貸し出しサービスのご利用が可能です
炭酸飲料市場は2025年に5,524億1,000万米ドルと評価され、2026年の5,896億6,000万米ドルから2031年までに8,167億2,000万米ドルに達すると予測されています。
予測期間(2026年~2031年)におけるCAGRは6.74%と見込まれます。
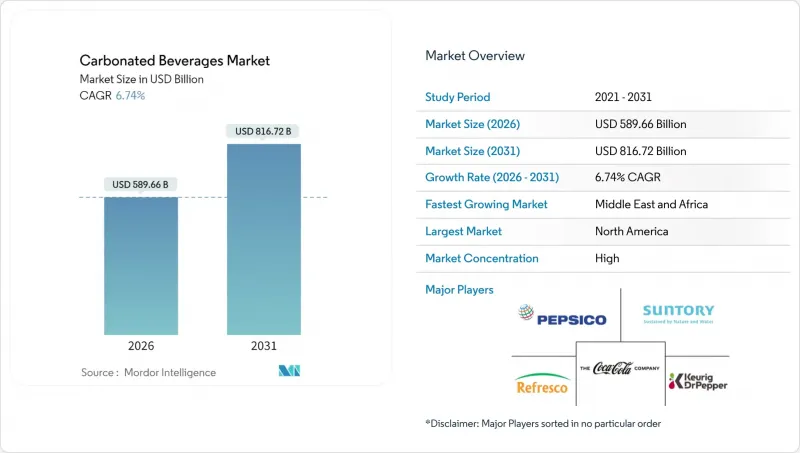
健康への懸念が高まる中でも、市場は拡大を続けております。この成長は、プレミアム製品、機能性製品、職人技による製品といった高価格帯商品が牽引しており、従来型コーラ飲料の売上停滞を相殺しております。カフェインと電解質を含む炭酸スポーツ飲料およびエナジードリンクは、アクティブなライフスタイルを送る消費者に支持され、市場をリードしております。無菌包装技術も、カーボンフットプリントの削減と地方部でのアクセス向上により成長に寄与しております。さらに、消費者直販モデルがサプライチェーンの簡素化を促進しています。大手企業は、無糖製品の導入や中小企業の買収により市場シェアを維持しています。一方、新興企業は、植物由来甘味料や本物の果実を用いた炭酸化といった革新的な技術で成功を収めています。
世界の炭酸飲料市場の動向と洞察
風味と形態における製品革新
従来のコーラやレモンライム風味に飽きた消費者層を惹きつけるため、フレーバーの多様化が進んでいます。2024年2月には、コカ・コーラ社がラズベリーとスパイスをブレンドした「コカ・コーラスパイスド」を発売し、ユニークな選択肢を求める若年層をターゲットとしました。同様にペプシコ社は、機能性リフレッシュメント市場での競争力を高めるため、カフェイン入り商品を追加し「バブリーバースト」ラインを拡充しました。新興ブランドは健康志向製品に注力しています。NO CAP!は1缶あたり5gの食物繊維を含むプレバイオティクスソーダを、Bloom Popは肌健康を促進するコラーゲン配合飲料を、Mighty Popはストレス管理に役立つアシュワガンダなどのアダプトゲンを含む製品をそれぞれ発売しました。これらの製品は通常のソーダより30~50%高価ですが、単なる飲料ではなく機能性サプリメントと捉える消費者に支持されています。日本のコカ・コーラプラスは、消化されないデキストリン繊維を強化しており、健康表示の規制承認が競争の激しい市場で製品を差別化する一例を示しています。ソーダストリームやアーキーなどの家庭用炭酸水生成システムの普及は、カスタマイズ可能なフレーバーへの移行と使い捨て包装の削減を示しており、環境意識の高い世帯に支持されています。
健康志向の配合の台頭
添加糖と代謝障害の関連性を示す証拠が増える中、ゼロ糖質・低カロリーオプションはブランドの存続に不可欠です。世界保健機関(WHO)は自由糖摂取量を総エネルギー摂取量の10%未満に抑えるよう推奨しており、多くのブランドが製品の再設計を進めています。北米ではステビアを甘味料に用いるゼビアが小売市場で急成長を遂げています。同様に中国では、血糖値に影響を与えない甘味を提供するエリスリトールベースの製品で「チフォレスト」が市場シェアを拡大しています。ただし天然甘味料には課題もあります。ステビアには甘草のような後味が残り、エリスリトールは清涼感を生じさせるため、マスキング剤の使用や他の非栄養甘味料とのブレンドが必要となるケースが少なくありません。こうした課題はあるもの、味のプロファイル改善が進み、消費者の受容度が高まっています。さらに、スポーツドリンクには電解質、腸内環境改善のためのプロバイオティクス、免疫力向上のためのビタミンなど、機能性成分を配合するブランドが増えています。こうした特徴により、製品は「嗜好品」ではなく「健康志向」として位置付けられ、ブランドはプレミアム価格を設定し、砂糖税の影響を軽減することが可能となっています。
健康意識と砂糖忌避傾向
過剰な糖分摂取が肥満、2型糖尿病、心臓病と関連しているという証拠が増えています。その結果、より多くの消費者が栄養表示を確認し、余分なカロリーを控えるようになっています。公衆衛生キャンペーンやメディア報道により、添加糖分への意識が高まり、フレーバー付き炭酸水やコンブチャなど、無糖または低糖の選択肢を選ぶ人が増えています。この動向は、フィットネス愛好家、幼い子供を持つ親、慢性疾患を抱える個人など、健康志向の強い層で特に顕著です。彼らは従来のソフトドリンクを自身の健康目標にそぐわないと捉えています。この需要に応えるため、各ブランドは無糖製品のラインアップを拡大しています。ただし、甘味飲料の味を再現することは、一部の製品にとって依然として課題となっています。さらに、アスパルテームやスクラロースなどの人工甘味料は2024年に米国食品医薬品局(FDA)および欧州食品安全機関(EFSA)により承認されましたが、多くの消費者は依然としてこれらに対して懐疑的です。企業はまた、消費者の嗜好の多様性による課題にも直面しています。カロリー削減を重視する人、天然素材を好む人、その両方を求める人など様々です。これにより企業は複数の製品バリエーションを管理せざるを得ず、生産・在庫管理システムにさらなる負荷がかかっています。
セグメント分析
2025年、炭酸飲料は市場シェアの59.62%を占め、コカ・コーラ社とペプシコ社が牽引しました。これらの老舗ブランドは、200カ国以上に及ぶ広範な流通網と、世代を超えて築かれた強い消費者ロイヤルティの恩恵を受けています。しかしながら、先進国市場における健康意識の高まりにより、一人当たりの消費量は減少傾向にあります。この課題に対応するため、各ブランドはゼロシュガー製品の強化に注力しており、コーラ売上におけるその割合は拡大を続けています。英国ではソフトドリンク産業課税の導入により、炭酸飲料の糖分含有量が40%削減されました。これは政府政策が製品の再設計を促し、消費者の嗜好を低カロリー製品へ転換させる効果を示す好例です。日本では、消化されないデキストリン繊維を含み、規制当局から健康強調表示の承認を得た「コカ・コーラプラス」が、差別化が不可欠な成熟市場において、機能性成分が従来のコーラ製品を刷新できることを示しています。
炭酸スポーツドリンクおよびエナジードリンクは、2031年までにCAGR7.62%で拡大し、最も成長が速い製品カテゴリーとなる見込みです。消費者はこれらの飲料を、単なる嗜好品ではなくパフォーマンス向上剤として捉える傾向が強まっています。現在では、朝の通勤時のコーヒー代替品として、フィットネス愛好家のワークアウト前、学生の深夜の勉強時間中など、新たな場面で消費されるようになっています。この用途の拡大は収益源の多様化に寄与し、季節的な売上変動を緩和します。各ブランドは標準タイプ、高濃度タイプ、ゼロシュガータイプ、パフォーマンス向けタイプなど多様な選択肢を提供し、消費者の多様なニーズや嗜好に対応しています。一部地域では若年層のカフェイン摂取に関する懸念から年齢確認ルールが導入されましたが、主要市場では施行状況にばらつきがあるもの、売上成長に大きな影響は生じていません。
2025年には、手頃な価格が重要な新興市場におけるコスト意識の高い消費者層に牽引され、大衆向けセグメントが市場の74.55%を占めました。1杯あたり1米ドル未満の炭酸飲料は、手頃な価格の嗜好品として人気を博しています。このセグメントはコンビニエンスストア、スーパーマーケット、自動販売機で特に好調で、衝動買いやリピート購入を促す「1本購入で1本無料」や複数パック割引などのプロモーションが支えとなっています。プライベートブランドは、特にアルディやリドルといった欧州チェーンにおいて、ナショナルブランドより30~40%安い製品を提供することで地歩を固めています。この変化により、価格に敏感な消費者のブランド忠誠心が弱まっています。先進国市場では健康動向や砂糖税により成長が制限されていますが、アジア太平洋、中東・アフリカの新興地域では、所得の増加と小売アクセス改善により販売数量の伸びが継続しています。各ブランドは、コスト削減のための現地生産、棚位置確保のための積極的なマーケティング、異なる所得層に対応する多様な製品ポートフォリオを通じて、自社の地位を守っています。
プレミアム製品は、北米、西欧、アジア太平洋地域の富裕層都市消費者を原動力に、2031年までCAGR7.18%で拡大しています。これらの消費者は炭酸飲料を基本的な清涼飲料ではなく、ライフスタイル製品と捉えています。1本2米ドル超の価格帯で展開するフィーバーツリーのようなブランドは、コンゴ民主共和国産のキニーネやナイジェリア産の生姜など、特定地域産の天然原料を使用することで差別化を図っています。プレミアムセグメントは、バーやレストランの回復から恩恵を受けており、クラフトソーダやミキサーはカクテルに使用され、200%から300%の価格上乗せが一般的です。フェンティマンズやQミキサーズといったブランドは、サトウキビ糖や天然香料といった高品質な原料を重視し、職人技に価値を見出す消費者層をターゲットとしています。このセグメントは価格感度が低いため、景気後退の影響を受けにくい特徴があります。また、プレミアム製品は専門店や高級飲食店での棚スペースを拡大しており、厳選された品揃えを求める需要に応えています。
地域別分析
2025年時点で北米は市場シェアの46.90%を占めており、強い消費習慣、先進的なコールドチェーンシステム、利便性飲料への高い支出に支えられています。しかし、米国とカナダにおける健康意識の高まりや砂糖税の議論により、成長は鈍化傾向にあります。同地域はイノベーションを牽引しており、各ブランドは新フレーバー、機能性飲料、持続可能な包装を世界展開前に現地で試験導入しています。メキシコでは、ソーダ税が導入されているにもかかわらず、消費量は依然として高く、予想よりも価格感応度が低いことが示されています。この税制により税収は増加し、一部の消費者は小容量パッケージへ移行しました。規制面での課題も増加しており、カリフォルニア州のボトルデポジット制度やニューヨーク州で提案されている生産者責任法がコンプライアンスを複雑化させています。また、FDAによる人工甘味料やエナジードリンクのカフェイン含有量への監視強化により、製品の再調整が必要となる可能性もあります。オントレードチャネルはパンデミック後の回復基調にあり、クラフトソーダやプレミアムミキサーが、地元産・職人技の素材を用いたカクテルで人気を集めています。
中東・アフリカ地域は2031年までCAGR8.98%で成長し、世界最速の伸びが見込まれます。これはGCC諸国やナイジェリア・ケニア・南アフリカの都市部における所得向上、小売業の近代化、若年層人口に牽引されるものです。サウジアラビアとUAEにおける炭酸飲料への課税は価格上昇をもたらしましたが、無糖飲料や機能性飲料の需要を増加させました。インフラ整備の進展、スーパーマーケットの拡大、EC物流の改善により、ブランドは地方や都市周辺地域への進出を加速しています。しかしながら、政治的不安定、通貨変動、アルミ缶や甘味料などの輸入原材料への依存がリスク要因となっており、現地パートナーシップやヘッジ戦略が求められます。同地域の温暖な気候は冷飲の安定した需要を保証し、ラマダンによる季節的な消費急増はサプライチェーンに負荷をかける一方、機敏なブランドには収益機会をもたらします。
アジア太平洋市場は多様性に富んでおります。中国の即飲飲料市場は、都市化、所得向上、主要都市におけるコンビニエンスストアや自動販売機の拡大により成長を続けております。インドでは40%の物品サービス税が手頃な価格を制限しておりますが、富裕層が輸入飲料や機能性飲料を好む都市部ではプレミアム化が顕著です。日本では、コカ・コーラプラスなど、食物繊維を強化し健康表示が認められた製品がイノベーションをリードし、健康志向の高齢層に支持されています。タイ、インドネシア、ベトナムを含む東南アジアでは、小売業の急速な成長と中産階級の拡大が進み、現地生産・流通に投資するブランドにとって機会が生まれています。欧州では、ドイツ、フランス、スペインでプレミアムクラフトソーダやボタニカルスパークリングウォーターへの移行が進む一方、東欧では価格感度が高く数量重視の傾向が続いています。南米では、アルゼンチンとブラジルの経済課題が成長を鈍化させていますが、コロンビアとチリにおける都市化と小売業の近代化が、地域に根差した戦略の機会を生み出しています。
その他の特典:
- エクセル形式の市場予測(ME)シート
- アナリストによる3ヶ月間のサポート
よくあるご質問
目次
第1章 イントロダクション
- 調査の前提条件と市場の定義
- 調査範囲
第2章 調査手法
第3章 エグゼクティブサマリー
第4章 市場情勢
- 市場概要
- 市場促進要因
- フレーバーと形態における製品革新
- 健康志向の製品開発の増加
- 都市部の生活ペースが加速する中、手軽で携帯可能な飲料への需要が高まっています
- プレミアム化と職人技による製品提供
- 電子商取引、コンビニエンスストア、組織化された小売業の拡大
- 積極的なキャンペーン、ソーシャルメディアへの関与、著名人による推奨
- 市場抑制要因
- 健康志向と砂糖離れ
- 厳格な砂糖規制と課税
- より健康的な飲料からの激しい競合
- 原材料のサプライチェーン混乱
- サプライチェーン分析
- 規制情勢
- テクノロジーの展望
- ポーターのファイブフォース分析
- 新規参入業者の脅威
- 買い手の交渉力
- 供給企業の交渉力
- 代替品の脅威
- 競争企業間の敵対関係
第5章 市場規模と成長予測
- 製品タイプ別
- 炭酸飲料
- 炭酸水
- 炭酸入りスポーツドリンクおよびエナジードリンク
- その他
- 階層別
- マス
- プレミアム
- パッケージングタイプ別
- ペットボトル
- ガラス瓶
- 金属缶
- 無菌包装(テトラパック、カートン、パウチ)
- 流通チャネル別
- オントレード
- オフトレード
- スーパーマーケット/ハイパーマーケット
- コンビニエンスストア
- 専門店
- オンライン小売
- その他流通チャネル
- 地域別
- 北米
- 米国
- カナダ
- メキシコ
- その他北米地域
- 欧州
- ドイツ
- 英国
- イタリア
- フランス
- スペイン
- オランダ
- ポーランド
- ベルギー
- スウェーデン
- その他欧州地域
- アジア太平洋地域
- 中国
- インド
- 日本
- オーストラリア
- インドネシア
- 韓国
- タイ
- シンガポール
- その他アジア太平洋地域
- 南米
- ブラジル
- アルゼンチン
- コロンビア
- チリ
- ペルー
- その他南米
- 中東・アフリカ
- 南アフリカ
- サウジアラビア
- アラブ首長国連邦
- ナイジェリア
- エジプト
- モロッコ
- トルコ
- その他中東・アフリカ地域
- 北米
第6章 競合情勢
- 市場集中度
- 戦略的動向
- 市場シェア分析
- 企業プロファイル
- The Coca-Cola Company
- PepsiCo, Inc.
- Keurig Dr Pepper Inc.
- National Beverage Corp.
- Refresco Group B.V.
- Suntory Beverage & Food Limited
- Asahi Group Holdings, Ltd.
- Britvic PLC
- A.G. Barr
- Red Bull GmbH
- Monster Beverage Corporation
- Fraser and Neave, Limited
- Parle Agro Pvt. Ltd.
- Grupo Jumex, S.A. de C.V.
- Arca Continental, S.A.B. de C.V.
- Jones Soda Co.
- Spindrift Beverage Co., Inc.
- Zevia PBC
- Polar Beverages, Inc.
- Reed's Inc.
第7章 市場機会と将来の展望
- 発行日
- 発行
- Mordor Intelligence
- ページ情報
- 英文 391 Pages
- 納期
- 2~3営業日