|
|
市場調査レポート
商品コード
1715224
アジア太平洋の炭酸飲料市場:2031年までの予測 - 地域別分析 - フレーバータイプ別、カテゴリー別、包装タイプ別、エンドユーザー別Asia Pacific Carbonated Soft Drinks Market Forecast to 2031 - Regional Analysis - by Flavor Type, Category, Packaging Type, and End User |
||||||

|
|||||||
|
|||||||

| アジア太平洋の炭酸飲料市場:2031年までの予測 - 地域別分析 - フレーバータイプ別、カテゴリー別、包装タイプ別、エンドユーザー別 |
|
出版日: 2025年02月11日
発行: The Insight Partners
ページ情報: 英文 101 Pages
納期: 即納可能
|

全表示
- 概要
- 図表
- 目次
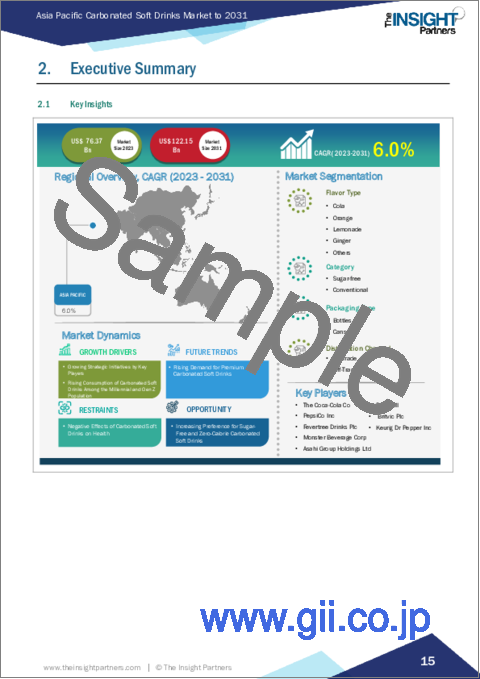
アジア太平洋の炭酸飲料市場は、2023年に763億7,209万米ドルと評価され、2031年までには1,221億5,113万米ドルに達すると予測され、2023年から2031年までのCAGRは6.0%と推定されます。
無糖・ゼロカロリー炭酸飲料への選好の高まりがアジア太平洋の炭酸飲料市場を押し上げる
世界中の消費者にとって健康が最優先事項となっており、機能性製品の需要が急増しています。砂糖の大量摂取に伴う健康リスクに対する認識が高まる中、消費者は健康目標を損なうことなく炭酸飲料を満喫できる代替品を積極的に求めています。シュガーフリーやゼロカロリーの炭酸飲料は、砂糖の摂取量を減らしたい人やカロリー消費を管理したい人に、罪悪感のない選択肢を提供します。これらの飲料は、アスパルテーム、スクラロース、ステビアなどの人工甘味料で甘味をつけ、糖分を加えることなく従来のソーダの親しみやすい甘味を提供しています。さらに、健康志向の消費者や、ケト食や低炭水化物食など特定の食事動向に従う消費者の台頭が、無糖やカロリーゼロの選択肢に対する需要を煽っています。こうした消費者は、炭酸やフレーバーへの欲求を満たしながら、食生活の選好に沿った飲料を積極的に求めています。このような需要の高まりを受けて、炭酸飲料市場の多くの企業は、無糖やゼロカロリーの選択肢を幅広く取り揃えるようポートフォリオを拡大しています。これらの製品は多くの場合、さまざまなフレーバーがあり、多様な消費者の選好に対応し、これまで以上に幅広い選択肢を提供しています。例えば、2023年10月、The Coca-Cola Companyは、コカ・コーラ・クリエーションズ・プラットフォームの下で、糖質ゼロと完全糖質バージョンの限定品「コカ・コーラY3000」を発売しました。さらに、2021年4月には、Dr Pepperが、同社の代表的な23種類のフレーバーをブレンドした糖質ゼロのソーダ、ドクターペッパー・ゼロシュガーを発売しました。さらに、飲料技術の進歩により、メーカー各社は無糖炭酸飲料やゼロカロリー炭酸飲料の味や質感を向上させることができるようになり、以前の製品では敬遠されがちだった消費者にとっても魅力的なものとなっています。
このように、政府の厳しい基準や、糖分ゼロやカロリーゼロの炭酸飲料に対する消費者の健康意識の高まりは、メーカーに新製品の開発を促し、市場の技術革新を後押ししています。この動向は、炭酸飲料市場に成長機会をもたらすと期待されています。
アジア太平洋の炭酸飲料市場概要
中国、インド、東南アジア(SEA)などの新興国を含むこの地域の大規模で多様な人口は、炭酸飲料の膨大な消費者基盤を示しています。可処分所得の増加、都市化、ライフスタイルの変化が、炭酸飲料を含む簡便食品・飲料の消費拡大に寄与しています。さらに、活動的なライフスタイルの必要性に関する意識の高まりや、生活習慣病の罹患率の上昇が、健康志向の消費者が無糖炭酸飲料を選ぶきっかけとなっています。無糖飲料市場は、同市場で事業を展開する様々なメーカーによる販促・広告戦略の増加によっても成長すると予測されています。国際糖尿病連合(IDF)によると、SEAにおける糖尿病患者数は68%増加し、2045年には1億5,200万人に達すると予想され、糖尿病有病率は30%増加し、2045年には11.3%に達します。アジアでは糖尿病が非常に多いため、消費者は健康的な食生活と活動的なライフスタイルの重要性をますます認識するようになっています。ステビアを含む天然甘味料は、消費者に飲料に好まれています。PepsiCo, Inc.やCoca-Cola Companyなどの企業は、人工添加物を排除し、製品に含まれる砂糖の量を減らすことを約束しています。このようなメーカーの取り組みが、アジア太平洋の消費者の炭酸飲料需要を押し上げています。炭酸飲料の入手しやすさと入手可能性も、アジア太平洋市場の成長を後押ししています。スーパーマーケット、コンビニエンスストア、オンラインプラットフォームなどの近代的な小売チャネルの拡大により、これらの飲料は都市部でも農村部でも消費者が簡単に入手できるようになっています。さらに、公共スペースに設置された自動販売機や飲料ディスペンサーは、炭酸飲料の認知度と流通を高めています。
アジア太平洋の炭酸飲料市場の収益と2031年までの予測(金額)
アジア太平洋の炭酸飲料市場のセグメンテーション
アジア太平洋の炭酸飲料市場は、フレーバータイプ、カテゴリー、包装タイプ、エンドユーザー、国に分類されます。
フレーバータイプに基づき、アジア太平洋の炭酸飲料市場はコーラ、オレンジ、レモネード、ジンジャー、その他に区分されます。コーラセグメントは2023年にアジア太平洋の炭酸飲料市場で最大のシェアを占めました。
カテゴリー別では、アジア太平洋の炭酸飲料市場は無糖と従来型に二分されます。2023年には、従来型セグメントがアジア太平洋の炭酸飲料市場でより大きなシェアを占めました。
包装タイプ別では、アジア太平洋の炭酸飲料市場はボトルと缶に二分されます。2023年のアジア太平洋の炭酸飲料市場は、ボトル市場がより大きなシェアを占めました。
エンドユーザーに基づき、アジア太平洋の炭酸飲料市場はオントレードとオフトレードに分類されます。2023年にはオントレード部門がアジア太平洋の炭酸飲料市場でより大きなシェアを占めました。
国別では、アジア太平洋の炭酸飲料市場はオーストラリア、中国、日本、インド、韓国、その他アジア太平洋に分類されます。その他アジア太平洋は、2023年のアジア太平洋の炭酸飲料市場シェアを独占しました。
The Coca-Cola Co、PepsiCo Inc、Red Bull、Fevertree Drinks Plc、Monster Beverage Corp、Britvic Plc、Keurig Dr Pepper Inc、Asahi Group Holdings Ltd、Refresco Groupは、アジア太平洋の炭酸飲料市場で事業を展開する主要企業です。
目次
第1章 イントロダクション
第2章 エグゼクティブサマリー
- 主要洞察
- 市場の魅力
第3章 調査手法
- 2次調査
- 1次調査
- 仮説の策定
- マクロ経済要因分析
- ファンデーション数値の開発
- データの三角測量
- 国レベルのデータ
第4章 アジア太平洋の炭酸飲料市場情勢
- ポーターのファイブフォース分析
- 供給企業の交渉力
- 買い手の交渉力
- 新規参入業者の脅威
- 競争企業間の敵対関係
- 代替品の脅威
- エコシステム分析
- 原材料サプライヤー
- メーカー
- ディストリビューター/サプライヤー
- エンドユーザー
- バリューチェーンのベンダー一覧
第5章 アジア太平洋の炭酸飲料市場:主要市場力学
- 市場促進要因
- ミレニアル世代とZ世代における炭酸飲料消費の増加
- 戦略的イニシアチブの高まり:主要企業別
- 市場抑制要因
- 炭酸飲料の健康への悪影響
- 市場機会
- 無糖・ゼロカロリー炭酸飲料への選好の高まり
- 今後の動向
- プレミアム炭酸飲料への需要の高まり
- 影響分析
第6章 炭酸飲料市場:アジア太平洋市場分析
- アジア太平洋の炭酸飲料市場の収益、2021年~2031年
- アジア太平洋の炭酸飲料市場の予測分析
第7章 アジア太平洋の炭酸飲料市場分析-フレーバータイプ別
- コーラ
- オレンジ
- レモネード
- ジンジャー
- その他
第8章 アジア太平洋の炭酸飲料市場分析-カテゴリー別
- 無糖
- 従来型
第9章 アジア太平洋の炭酸飲料市場分析-包装タイプ別
- ボトル
- 缶
第10章 アジア太平洋の炭酸飲料市場分析-エンドユーザー別
- オントレード
- オフトレード
第11章 アジア太平洋の炭酸飲料市場-国別分析
- アジア太平洋
- オーストラリア
- 中国
- インド
- 日本
- 韓国
- その他アジア太平洋
第12章 競合情勢
- ヒートマップ分析:主要企業別
- 企業のポジショニングと集中度
第13章 業界情勢
- 市場イニシアティブ
- 合併と買収
第14章 企業プロファイル
- The Coca-Cola Co
- PepsiCo Inc
- Red Bull
- Fevertree Drinks Plc
- Monster Beverage Corp
- Britvic Plc
- Keurig Dr Pepper Inc
- Asahi Group Holdings Ltd
- Refresco Group
第15章 付録
List Of Tables
- Table 1. Asia Pacific Carbonated Soft Drinks Market Segmentation
- Table 2. List of Vendors
- Table 3. Asia Pacific Carbonated Soft Drinks Market - Revenue and Forecast to 2031 (US$ Billion)
- Table 4. Asia Pacific Carbonated Soft Drinks Market - Revenue and Forecast to 2031 (US$ Billion) - by Flavor Type
- Table 5. Asia Pacific Carbonated Soft Drinks Market - Revenue and Forecast to 2031 (US$ Billion) - by Category
- Table 6. Asia Pacific Carbonated Soft Drinks Market - Revenue and Forecast to 2031 (US$ Billion) - by Packaging Type
- Table 7. Asia Pacific Carbonated Soft Drinks Market - Revenue and Forecast to 2031 (US$ Billion) - by End User
- Table 8. Asia Pacific: Carbonated Soft Drinks Market - Revenue and Forecast to 2031 (US$ Billion) - by Country
- Table 9. Australia: Carbonated Soft Drinks Market - Revenue and Forecast to 2031 (US$ Billion) - by Flavor Type
- Table 10. Australia: Carbonated Soft Drinks Market - Revenue and Forecast to 2031 (US$ Billion) - by Category
- Table 11. Australia: Carbonated Soft Drinks Market - Revenue and Forecast to 2031 (US$ Billion) - by Packaging Type
- Table 12. Australia: Carbonated Soft Drinks Market - Revenue and Forecast to 2031 (US$ Billion) - by End User
- Table 13. China: Carbonated Soft Drinks Market - Revenue and Forecast to 2031 (US$ Billion) - by Flavor Type
- Table 14. China: Carbonated Soft Drinks Market - Revenue and Forecast to 2031 (US$ Billion) - by Category
- Table 15. China: Carbonated Soft Drinks Market - Revenue and Forecast to 2031 (US$ Billion) - by Packaging Type
- Table 16. China: Carbonated Soft Drinks Market - Revenue and Forecast to 2031 (US$ Billion) - by End User
- Table 17. India: Carbonated Soft Drinks Market - Revenue and Forecast to 2031 (US$ Billion) - by Flavor Type
- Table 18. India: Carbonated Soft Drinks Market - Revenue and Forecast to 2031 (US$ Billion) - by Category
- Table 19. India: Carbonated Soft Drinks Market - Revenue and Forecast to 2031 (US$ Billion) - by Packaging Type
- Table 20. India: Carbonated Soft Drinks Market - Revenue and Forecast to 2031 (US$ Billion) - by End User
- Table 21. Japan: Carbonated Soft Drinks Market - Revenue and Forecast to 2031 (US$ Billion) - by Flavor Type
- Table 22. Japan: Carbonated Soft Drinks Market - Revenue and Forecast to 2031 (US$ Billion) - by Category
- Table 23. Japan: Carbonated Soft Drinks Market - Revenue and Forecast to 2031 (US$ Billion) - by Packaging Type
- Table 24. Japan: Carbonated Soft Drinks Market - Revenue and Forecast to 2031 (US$ Billion) - by End User
- Table 25. South Korea: Carbonated Soft Drinks Market - Revenue and Forecast to 2031 (US$ Billion) - by Flavor Type
- Table 26. South Korea: Carbonated Soft Drinks Market - Revenue and Forecast to 2031 (US$ Billion) - by Category
- Table 27. South Korea: Carbonated Soft Drinks Market - Revenue and Forecast to 2031 (US$ Billion) - by Packaging Type
- Table 28. South Korea: Carbonated Soft Drinks Market - Revenue and Forecast to 2031 (US$ Billion) - by End User
- Table 29. Rest of Asia Pacific: Carbonated Soft Drinks Market - Revenue and Forecast to 2031 (US$ Billion) - by Flavor Type
- Table 30. Rest of Asia Pacific: Carbonated Soft Drinks Market - Revenue and Forecast to 2031 (US$ Billion) - by Category
- Table 31. Rest of Asia Pacific: Carbonated Soft Drinks Market - Revenue and Forecast to 2031 (US$ Billion) - by Packaging Type
- Table 32. Rest of Asia Pacific: Carbonated Soft Drinks Market - Revenue and Forecast to 2031 (US$ Billion) - by End User
List Of Figures
- Figure 1. Asia Pacific Carbonated Soft Drinks Market Segmentation, by Country
- Figure 2. Carbonated Soft Drinks Market-Porter's Analysis
- Figure 3. Ecosystem: Asia Pacific Carbonated Soft Drinks Market
- Figure 4. Asia Pacific Carbonated Soft Drinks Market - Key Market Dynamics
- Figure 5. Impact Analysis of Drivers and Restraints
- Figure 6. Asia Pacific Carbonated Soft Drinks Market Revenue (US$ Billion), 2021-2031
- Figure 7. Asia Pacific Carbonated Soft Drinks Market Share (%) - by Flavor Type (2023 and 2031)
- Figure 8. Cola: Carbonated Soft Drinks Market - Revenue and Forecast to 2031 (US$ Billion)
- Figure 9. Orange: Carbonated Soft Drinks Market - Revenue and Forecast to 2031 (US$ Billion)
- Figure 10. Lemonade: Carbonated Soft Drinks Market - Revenue and Forecast to 2031 (US$ Billion)
- Figure 11. Ginger: Carbonated Soft Drinks Market - Revenue and Forecast to 2031 (US$ Billion)
- Figure 12. Others: Carbonated Soft Drinks Market - Revenue and Forecast to 2031 (US$ Billion)
- Figure 13. Asia Pacific Carbonated Soft Drinks Market Share (%) - by Category (2023 and 2031)
- Figure 14. Sugar-free: Carbonated Soft Drinks Market - Revenue and Forecast to 2031 (US$ Billion)
- Figure 15. Conventional: Carbonated Soft Drinks Market - Revenue and Forecast to 2031 (US$ Billion)
- Figure 16. Asia Pacific Carbonated Soft Drinks Market Share (%) - by Packaging Type (2023 and 2031)
- Figure 17. Bottles: Carbonated Soft Drinks Market - Revenue and Forecast to 2031 (US$ Billion)
- Figure 18. Cans: Carbonated Soft Drinks Market - Revenue and Forecast to 2031 (US$ Billion)
- Figure 19. Asia Pacific Carbonated Soft Drinks Market Share (%) - by End User (2023 and 2031)
- Figure 20. On-Trade: Carbonated Soft Drinks Market - Revenue and Forecast to 2031 (US$ Billion)
- Figure 21. Off-Trade: Carbonated Soft Drinks Market - Revenue and Forecast to 2031 (US$ Billion)
- Figure 22. Asia Pacific: Carbonated Soft Drinks Market Revenue, by Key Countries, (2023) (US$ Bn)
- Figure 23. Asia Pacific: Carbonated Soft Drinks Market Breakdown, by Key Countries, 2023 and 2031 (%)
- Figure 24. Australia: Carbonated Soft Drinks Market - Revenue and Forecast to 2031 (US$ Billion)
- Figure 25. China: Carbonated Soft Drinks Market - Revenue and Forecast to 2031 (US$ Billion)
- Figure 26. India: Carbonated Soft Drinks Market - Revenue and Forecast to 2031 (US$ Billion)
- Figure 27. Japan: Carbonated Soft Drinks Market - Revenue and Forecast to 2031 (US$ Billion)
- Figure 28. South Korea: Carbonated Soft Drinks Market - Revenue and Forecast to 2031 (US$ Billion)
- Figure 29. Rest of Asia Pacific: Carbonated Soft Drinks Market - Revenue and Forecast to 2031 (US$ Billion)
- Figure 30. Heat Map Analysis by Key Players
- Figure 31. Company Positioning & Concentration
The Asia Pacific carbonated soft drinks market was valued at US$ 76,372.09 million in 2023 and is expected to reach US$ 1,22,151.13 million by 2031; it is estimated to register a CAGR of 6.0% from 2023 to 2031.
Increasing Preference for Sugar-Free and Zero-Calorie Carbonated Soft Drinks Boosts Asia Pacific Carbonated Soft Drinks Market
Health has become a top priority for consumers across the globe, leading to a boom in demand for functional products. With increasing awareness of the health risks associated with high sugar intake, consumers are actively seeking out alternatives that allow them to indulge in carbonated beverages without compromising their health goals. Sugar-free and zero-calorie carbonated soft drinks offer a guilt-free option for those looking to reduce their sugar intake or manage their calorie consumption. These beverages are sweetened with artificial sweeteners such as aspartame, sucralose, or stevia, providing the familiar sweetness of traditional sodas without the added sugars. Moreover, the rise of health-conscious consumers and those following specific dietary trends, such as keto or low-carb diets, has fueled the demand for sugar-free and zero-calorie options. These consumers actively seek beverages that align with their dietary preferences while satisfying their cravings for carbonation and flavors. In response to this growing demand, many companies in the carbonated soft drinks market are expanding their portfolios to include a wider range of sugar-free and zero-calorie options. These products often come in a variety of flavors, catering to diverse consumer preferences and offering a wider selection than ever before. For instance, in October 2023, The Coca-Cola Company launched Coca-Cola Y3000 under its Coca-Cola Creations platform, the limited-edition zero sugar and a full-sugar version. In addition, in April 2021, Dr Pepper launched Dr Pepper Zero Sugar, with the blend of its signature 23 flavors in a zero-sugar soda. Additionally, advancements in beverage technology have enabled manufacturers to improve the taste and texture of sugar-free, and zero-calorie carbonated soft drinks, making them more appealing to consumers who previous iterations may have deterred.
Thus, stringent government norms and growing health awareness among consumers toward zero-sugar and zero-calorie carbonated soft drinks is encouraging manufacturers to develop new products and boost innovation in the market. This trend is expected to provide growth opportunities to the carbonated soft drinks market.
Asia Pacific Carbonated Soft Drinks Market Overview
The region's large and diverse population, including emerging economies such as China, India, and Southeast Asian (SEA) countries, presents a vast consumer base for carbonated beverages. Rising disposable incomes, urbanization, and changing lifestyles contribute to increased consumption of convenience foods and beverages, including carbonated soft drinks. Further, growing awareness regarding the need for an active lifestyle and the rising rates of lifestyle diseases inspire health-oriented consumers to opt for sugar-free carbonated soft drinks. The sugar-free beverages market is also projected to grow due to increased promotional and advertisement strategies by various manufacturers operating in the market. According to the International Diabetes Federation (IDF), the number of people with diabetes in SEA is anticipated to increase by 68%, reaching 152 million by 2045, and the prevalence of diabetes will increase by 30%, reaching 11.3% in 2045. Consumers are becoming increasingly aware of the importance of a healthy diet and an active lifestyle due to the extreme occurrence of diabetes in Asia. Natural sweeteners, including stevia, are preferred by consumers in their beverages. Companies such as PepsiCo, Inc. and the Coca-Cola Company have pledged to eliminate artificial additives and lower the amount of sugar in their products. Thus, such initiatives taken by manufacturers boost the demand for carbonated soft drinks among consumers in Asia Pacific. The accessibility and availability of carbonated soft drinks are also driving market growth in Asia Pacific. The expansion of modern retail channels, including supermarkets, convenience stores, and online platforms, makes these beverages easily available to consumers across urban and rural areas. Additionally, vending machines and beverage dispensers in public spaces enhance the visibility and distribution of carbonated soft drinks.
Asia Pacific Carbonated Soft Drinks Market Revenue and Forecast to 2031 (US$ Million)
Asia Pacific Carbonated Soft Drinks Market Segmentation
The Asia Pacific carbonated soft drinks market is categorized into flavor type, category, packaging type, end user, and country.
Based on flavor type, the Asia Pacific carbonated soft drinks market is segmented into cola, orange, lemonade, ginger, and others. The cola segment held the largest Asia Pacific carbonated soft drinks market share in 2023.
In terms of category, the Asia Pacific carbonated soft drinks market is bifurcated into sugar-free and conventional. The conventional segment held a larger Asia Pacific carbonated soft drinks market share in 2023.
By packaging type, the Asia Pacific carbonated soft drinks market is bifurcated into bottles and cans. The bottles segment held a larger Asia Pacific carbonated soft drinks market share in 2023.
Based on end user, the Asia Pacific carbonated soft drinks market is categorized into on-trade and off-trade. The on-trade segment held a larger Asia Pacific carbonated soft drinks market share in 2023.
Based on country, the Asia Pacific carbonated soft drinks market is categorized into Australia, China, Japan, India, South Korea, and the Rest of Asia Pacific. The Rest of Asia Pacific dominated the Asia Pacific carbonated soft drinks market share in 2023.
The Coca-Cola Co, PepsiCo Inc, Red Bull, Fevertree Drinks Plc, Monster Beverage Corp, Britvic Plc, Keurig Dr Pepper Inc, Asahi Group Holdings Ltd, and Refresco Group are some of the leading companies operating in the Asia Pacific carbonated soft drinks market.
Table Of Contents
1. Introduction
- 1.1 The Insight Partners Research Report Guidance
- 1.2 Market Segmentation
2. Executive Summary
- 2.1 Key Insights
- 2.2 Market Attractiveness
3. Research Methodology
- 3.1 Secondary Research
- 3.2 Primary Research
- 3.2.1 Hypothesis formulation:
- 3.2.2 Macro-economic factor analysis:
- 3.2.3 Developing base number:
- 3.2.4 Data Triangulation:
- 3.2.5 Country level data:
4. Asia Pacific Carbonated Soft Drinks Market Landscape
- 4.1 Overview
- 4.2 Porters Five Forces Analysis
- 4.2.1 Bargaining Power of Suppliers
- 4.2.2 Bargaining Power of Buyers
- 4.2.3 Threat of New Entrants
- 4.2.4 Competitive Rivalry
- 4.2.5 Threat of Substitutes
- 4.3 Ecosystem Analysis
- 4.3.1 Raw Material Suppliers
- 4.3.2 Manufacturers
- 4.3.3 Distributors/Suppliers
- 4.3.4 End Users
- 4.3.5 List of Vendors in the Value Chain
5. Asia Pacific Carbonated Soft Drinks Market - Key Market Dynamics
- 5.1 Market Drivers
- 5.1.1 Rising Consumption of Carbonated Soft Drinks Among the Millennial and Gen Z Population
- 5.1.2 Growing Strategic Initiatives by Key Players
- 5.2 Market Restraints
- 5.2.1 Negative Effects of Carbonated Soft Drinks on Health
- 5.3 Market Opportunities
- 5.3.1 Increasing Preference for Sugar-Free and Zero-Calorie Carbonated Soft Drinks
- 5.4 Future Trends
- 5.4.1 Rising Demand for Premium Carbonated Soft Drinks
- 5.5 Impact Analysis
6. Carbonated Soft Drinks Market - Asia Pacific Market Analysis
- 6.1 Asia Pacific Carbonated Soft Drinks Market Revenue (US$ Billion), 2021-2031
- 6.2 Asia Pacific Carbonated Soft Drinks Market Forecast Analysis
7. Asia Pacific Carbonated Soft Drinks Market Analysis - by Flavor Type
- 7.1 Cola
- 7.1.1 Overview
- 7.1.2 Cola: Carbonated Soft Drinks Market - Revenue and Forecast to 2031 (US$ Billion)
- 7.2 Orange
- 7.2.1 Overview
- 7.2.2 Orange: Carbonated Soft Drinks Market - Revenue and Forecast to 2031 (US$ Billion)
- 7.3 Lemonade
- 7.3.1 Overview
- 7.3.2 Lemonade: Carbonated Soft Drinks Market - Revenue and Forecast to 2031 (US$ Billion)
- 7.4 Ginger
- 7.4.1 Overview
- 7.4.2 Ginger: Carbonated Soft Drinks Market - Revenue and Forecast to 2031 (US$ Billion)
- 7.5 Others
- 7.5.1 Overview
- 7.5.2 Others: Carbonated Soft Drinks Market - Revenue and Forecast to 2031 (US$ Billion)
8. Asia Pacific Carbonated Soft Drinks Market Analysis - by Category
- 8.1 Sugar-free
- 8.1.1 Overview
- 8.1.2 Sugar-free: Carbonated Soft Drinks Market - Revenue and Forecast to 2031 (US$ Billion)
- 8.2 Conventional
- 8.2.1 Overview
- 8.2.2 Conventional: Carbonated Soft Drinks Market - Revenue and Forecast to 2031 (US$ Billion)
9. Asia Pacific Carbonated Soft Drinks Market Analysis - by Packaging Type
- 9.1 Bottles
- 9.1.1 Overview
- 9.1.2 Bottles: Carbonated Soft Drinks Market - Revenue and Forecast to 2031 (US$ Billion)
- 9.2 Cans
- 9.2.1 Overview
- 9.2.2 Cans: Carbonated Soft Drinks Market - Revenue and Forecast to 2031 (US$ Billion)
10. Asia Pacific Carbonated Soft Drinks Market Analysis - by End User
- 10.1 On-Trade
- 10.1.1 Overview
- 10.1.2 On-Trade: Carbonated Soft Drinks Market - Revenue and Forecast to 2031 (US$ Billion)
- 10.2 Off-Trade
- 10.2.1 Overview
- 10.2.2 Off-Trade: Carbonated Soft Drinks Market - Revenue and Forecast to 2031 (US$ Billion)
11. Asia Pacific Carbonated Soft Drinks Market - Country Analysis
- 11.1 Asia Pacific
- 11.1.1 Asia Pacific: Carbonated Soft Drinks Market - Revenue and Forecast Analysis - by Country
- 11.1.1.1 Asia Pacific: Carbonated Soft Drinks Market - Revenue and Forecast Analysis - by Country
- 11.1.1.2 Australia: Carbonated Soft Drinks Market - Revenue and Forecast to 2031 (US$ Billion)
- 11.1.1.2.1 Australia: Carbonated Soft Drinks Market Breakdown, by Flavor Type
- 11.1.1.2.2 Australia: Carbonated Soft Drinks Market Breakdown, by Category
- 11.1.1.2.3 Australia: Carbonated Soft Drinks Market Breakdown, by Packaging Type
- 11.1.1.2.4 Australia: Carbonated Soft Drinks Market Breakdown, by End User
- 11.1.1.3 China: Carbonated Soft Drinks Market - Revenue and Forecast to 2031 (US$ Billion)
- 11.1.1.3.1 China: Carbonated Soft Drinks Market Breakdown, by Flavor Type
- 11.1.1.3.2 China: Carbonated Soft Drinks Market Breakdown, by Category
- 11.1.1.3.3 China: Carbonated Soft Drinks Market Breakdown, by Packaging Type
- 11.1.1.3.4 China: Carbonated Soft Drinks Market Breakdown, by End User
- 11.1.1.4 India: Carbonated Soft Drinks Market - Revenue and Forecast to 2031 (US$ Billion)
- 11.1.1.4.1 India: Carbonated Soft Drinks Market Breakdown, by Flavor Type
- 11.1.1.4.2 India: Carbonated Soft Drinks Market Breakdown, by Category
- 11.1.1.4.3 India: Carbonated Soft Drinks Market Breakdown, by Packaging Type
- 11.1.1.4.4 India: Carbonated Soft Drinks Market Breakdown, by End User
- 11.1.1.5 Japan: Carbonated Soft Drinks Market - Revenue and Forecast to 2031 (US$ Billion)
- 11.1.1.5.1 Japan: Carbonated Soft Drinks Market Breakdown, by Flavor Type
- 11.1.1.5.2 Japan: Carbonated Soft Drinks Market Breakdown, by Category
- 11.1.1.5.3 Japan: Carbonated Soft Drinks Market Breakdown, by Packaging Type
- 11.1.1.5.4 Japan: Carbonated Soft Drinks Market Breakdown, by End User
- 11.1.1.6 South Korea: Carbonated Soft Drinks Market - Revenue and Forecast to 2031 (US$ Billion)
- 11.1.1.6.1 South Korea: Carbonated Soft Drinks Market Breakdown, by Flavor Type
- 11.1.1.6.2 South Korea: Carbonated Soft Drinks Market Breakdown, by Category
- 11.1.1.6.3 South Korea: Carbonated Soft Drinks Market Breakdown, by Packaging Type
- 11.1.1.6.4 South Korea: Carbonated Soft Drinks Market Breakdown, by End User
- 11.1.1.7 Rest of Asia Pacific: Carbonated Soft Drinks Market - Revenue and Forecast to 2031 (US$ Billion)
- 11.1.1.7.1 Rest of Asia Pacific: Carbonated Soft Drinks Market Breakdown, by Flavor Type
- 11.1.1.7.2 Rest of Asia Pacific: Carbonated Soft Drinks Market Breakdown, by Category
- 11.1.1.7.3 Rest of Asia Pacific: Carbonated Soft Drinks Market Breakdown, by Packaging Type
- 11.1.1.7.4 Rest of Asia Pacific: Carbonated Soft Drinks Market Breakdown, by End User
- 11.1.1 Asia Pacific: Carbonated Soft Drinks Market - Revenue and Forecast Analysis - by Country
12. Competitive Landscape
- 12.1 Heat Map Analysis by Key Players
- 12.2 Company Positioning & Concentration
13. Industry Landscape
- 13.1 Overview
- 13.2 Market Initiative
- 13.3 Merger and Acquisition
14. Company Profiles
- 14.1 The Coca-Cola Co
- 14.1.1 Key Facts
- 14.1.2 Business Description
- 14.1.3 Products and Services
- 14.1.4 Financial Overview
- 14.1.5 SWOT Analysis
- 14.1.6 Key Developments
- 14.2 PepsiCo Inc
- 14.2.1 Key Facts
- 14.2.2 Business Description
- 14.2.3 Products and Services
- 14.2.4 Financial Overview
- 14.2.5 SWOT Analysis
- 14.2.6 Key Developments
- 14.3 Red Bull
- 14.3.1 Key Facts
- 14.3.2 Business Description
- 14.3.3 Products and Services
- 14.3.4 Financial Overview
- 14.3.5 SWOT Analysis
- 14.3.6 Key Developments
- 14.4 Fevertree Drinks Plc
- 14.4.1 Key Facts
- 14.4.2 Business Description
- 14.4.3 Products and Services
- 14.4.4 Financial Overview
- 14.4.5 SWOT Analysis
- 14.4.6 Key Developments
- 14.5 Monster Beverage Corp
- 14.5.1 Key Facts
- 14.5.2 Business Description
- 14.5.3 Products and Services
- 14.5.4 Financial Overview
- 14.5.5 SWOT Analysis
- 14.5.6 Key Developments
- 14.6 Britvic Plc
- 14.6.1 Key Facts
- 14.6.2 Business Description
- 14.6.3 Products and Services
- 14.6.4 Financial Overview
- 14.6.5 SWOT Analysis
- 14.6.6 Key Developments
- 14.7 Keurig Dr Pepper Inc
- 14.7.1 Key Facts
- 14.7.2 Business Description
- 14.7.3 Products and Services
- 14.7.4 Financial Overview
- 14.7.5 SWOT Analysis
- 14.7.6 Key Developments
- 14.8 Asahi Group Holdings Ltd
- 14.8.1 Key Facts
- 14.8.2 Business Description
- 14.8.3 Products and Services
- 14.8.4 Financial Overview
- 14.8.5 SWOT Analysis
- 14.8.6 Key Developments
- 14.9 Refresco Group
- 14.9.1 Key Facts
- 14.9.2 Business Description
- 14.9.3 Products and Services
- 14.9.4 Financial Overview
- 14.9.5 SWOT Analysis
- 14.9.6 Key Developments
15. Appendix
- 15.1 About The Insight Partners
