|
|
市場調査レポート
商品コード
1701552
炭酸飲料の市場規模、シェア、動向分析レポート:製品別、フレーバー別、流通チャネル別、地域別、セグメント予測、2025年~2030年Carbonated Beverages Market Size, Share & Trends Analysis Report By Product (Carbonated Soft Drinks, Carbonated Water), By Flavor (Cola, Fruit Based), By Distribution Channel, By Region And Segment Forecasts, 2025 - 2030 |
||||||
|
|||||||
カスタマイズ可能
|
|||||||

| 炭酸飲料の市場規模、シェア、動向分析レポート:製品別、フレーバー別、流通チャネル別、地域別、セグメント予測、2025年~2030年 |
|
出版日: 2025年03月05日
発行: Grand View Research
ページ情報: 英文 80 Pages
納期: 2~10営業日
|

全表示
- 概要
- 図表
- 目次
炭酸飲料市場の成長と動向
Grand View Research, Inc.の最新レポートによると、世界の炭酸飲料市場規模は2025~2030年にかけてCAGR 6.4%で拡大し、2030年には8億9,520万米ドルに達すると推定されます。
新興経済諸国における経済指標の改善と相まって、プレミアム飲料の需要開拓が市場成長を促進すると予想されます。さらに、炭酸飲料メーカーによる支出の増加は、世界レベルでの産業の動きにおいて重要な役割を果たしています。こうしたイノベーションは、製品、包装、流通、その他ビジネスの様々な面でもたらされています。2020年6月、ペプシコはソーダ・ストリームを職場、大学、空港、その他多くの人々が交流する専門的な場所など、家庭から離れた環境に拡大するイニシアティブを取りました。
さらに、ソーダストリーム・プロフェッショナル・ハイドレーションプラットフォームを使用することで、製品を簡単に調節することができます。モバイル対応アプリケーションにより、人々は飲料をパーソナライズしたり、水の摂取量をデジタルで追跡したりすることができます。この製品は、ペットボトル廃棄物の削減にも重要な役割を果たしています。
同様に、製品の発売も市場成長に重要な役割を果たしています。2020年4月、大正製薬ホールディングスは炭酸入りエナジードリンクを「Raizin」ブランドで発売しました。ジンジャー味とミックスフルーツ味の2種類があります。この飲料はノンカフェインで、スポーツ栄養、減量、認知ケアに好影響を与えることで知られるショウガ植物エキス「enXtra」が配合されています。また、イチョウ葉エキス、脱タンパクローヤルゼリー、ビタミンB2&B6、ヒスチジン、イソロイシン、イノシトールなどのアミノ酸も含まれています。小売価格は190円。
2019年10月、Coca Colaはレギュラー味とチェリー味のエナジードリンクを発売しました。このゼロカロリー製品は25の国際市場で販売されています。12オンスで114ミリグラムのカフェインが含まれており、これは天然由来です。また、ガラナエキスやビタミンB群も含まれています。
2020年1月、Celsius Holdings, Inc.は、ジャックフルーツ風味の炭酸パフォーマンスエナジードリンク「CELSIUS HEAT」を発売しました。L-シトルリン2,000mg、カフェイン300mg、独自ブレンドを配合。缶には"PROVEN PERFORMANCE "のタグが付いており、ブランドの構造と機能を強化しています。
炭酸飲料市場レポートのハイライト
- 製品別では、清涼飲料が2024年に49.8%以上のシェアで市場を独占しました。これは先行者利益によるものです。
- 2025~2030年のCAGRは7.4%で、スポーツドリンクとエナジードリンクセグメントが最も急成長が見込まれます。この成長は、あらゆる世代の人々の間で健康的なライフスタイルに対する意識が高まっていることに起因しています。
- フレーバー別では、自然で健康的な選択肢に対する消費者の嗜好の高まりにより、フルーツベースのフレーバーセグメントが予測期間中に最も速いCAGRを記録すると予測されます。多種多様な果物の入手可能性と、より多くの天然成分を含むという選択肢が、急速な成長をもたらしています。
- 北米の炭酸飲料市場は2024年に32.1%の最大シェアを占め、その爽やかな品質と低カロリーによるスパークリングウォーターの人気に後押しされました。
目次
第1章 調査手法と範囲
第2章 エグゼクティブサマリー
第3章 炭酸飲料市場の変数、動向、範囲
- 市場系統の展望
- 親市場の展望
- 関連市場展望
- 産業バリューチェーン分析
- 市場力学
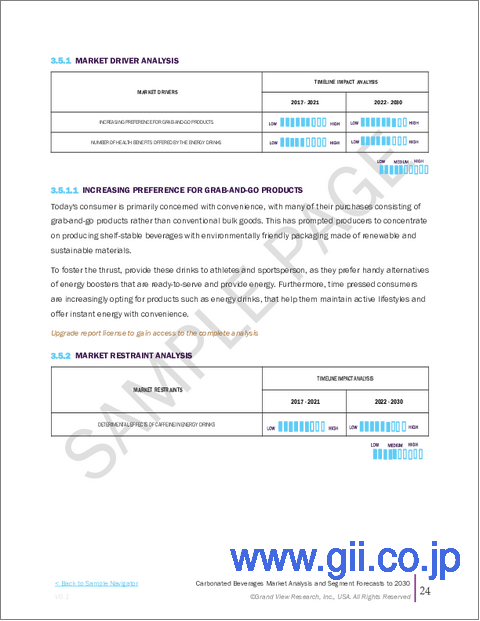
- 市場促進要因分析
- 市場抑制要因分析
- 産業分析ツール
- ポーターのファイブフォース分析
- 市場参入戦略
第4章 消費者行動分析
- 人口統計分析
- 消費者の動向と嗜好
- 購入決定に影響を与える要因
- 消費者製品の採用
- 観察と推奨事項
第5章 炭酸飲料市場:製品別、推定・動向分析
- 炭酸飲料市場、製品別:主要ポイント
- 製品変動分析と市場シェア、2024年と2030年
- 製品別、2018~2030年
- 炭酸飲料
- 炭酸水
- 炭酸スポーツドリンクとエナジードリンク
- その他
第6章 炭酸飲料市場:フレーバー別、推定・動向分析
- 炭酸飲料市場、フレーバー別:主要ポイント
- フレーバー変動分析と市場シェア、2024年と2030年
- フレーバー別、2018~2030年
- コーラ
- フルーツベース
- その他
第7章 炭酸飲料市場:流通チャネル別、推定・動向分析
- 炭酸飲料市場、流通チャネル別:主要ポイント
- 流通チャネル変動分析と市場シェア、2024年と2030年
- 流通チャネル別、2018~2030年
- ハイパーマーケットとスーパーマーケット
- コンビニエンスストア
- 食品サービス店
- 輸送ターミナル
- オンラインストアとD2C
第8章 炭酸飲料市場:地域別、推定・動向分析
- 炭酸飲料市場:地域別展望
- 地域市場:主要ポイント
- 地域別、2018~2030年
- 北米
- 欧州
- アジア太平洋
- ラテンアメリカ
- 中東・アフリカ
第9章 炭酸飲料市場:競合分析
- 主要市場参入企業による最近の動向と影響分析
- 企業分類
- 参入企業概要
- 企業市場シェア分析、2024年(%)
- 企業ヒートマップ分析
- 戦略マッピング
- 企業プロファイル
- Anadolu Group
- Danone
- JONES
- Keurig Dr Pepper
- Monster Energy Company
- National Beverage Corp.
- PepsiCo
- Refresco Group
- SodaStream Inc.
- SUNTORY BEVERAGE & FOOD LIMITED.
- The Coca-Cola Company.
List of Tables
- Table 1. Global Carbonated Beverages Market: Key Market Driver Analysis
- Table 2. Global Carbonated Beverages Market: Key Market Restraint Analysis
- Table 3. Global Carbonated Beverages Market Estimates & Forecast, By Product (USD Million)
- Table 4. Global Carbonated Beverages Market Estimates & Forecast, By Flavor (USD Million)
- Table 5. Global Carbonated Beverages Market Estimates & Forecast, By Distribution Channel (USD Million)
- Table 6. Global Carbonated Beverages Market Estimates & Forecast, By Region (USD Million)
- Table 7. North America Carbonated Beverages Market Estimates and Forecast, By Country, 2018 - 2030 (USD Million)
- Table 8. North America Carbonated Beverages Market Estimates and Forecast, By Product, 2018 - 2030 (USD Million)
- Table 9. North America Carbonated Beverages Market Estimates and Forecast, By Flavor, 2018 - 2030 (USD Million)
- Table 10. North America Carbonated Beverages Market Estimates and Forecast, By Distribution Channel, 2018 - 2030 (USD Million)
- Table 11. U.S. Macro-Economic Outlay
- Table 12. U.S. Carbonated Beverages Market Estimates and Forecast, By Product, 2018 - 2030 (USD Million)
- Table 13. U.S. Carbonated Beverages Market Estimates and Forecast, By Flavor, 2018 - 2030 (USD Million)
- Table 14. U.S. Carbonated Beverages Market Estimates and Forecast, By Distribution Channel, 2018 - 2030 (USD Million)
- Table 15. Canada Macro-Economic Outlay
- Table 16. Canada Carbonated Beverages Market Estimates and Forecast, By Product, 2018 - 2030 (USD Million)
- Table 17. Canada Carbonated Beverages Market Estimates and Forecast, By Flavor, 2018 - 2030 (USD Million)
- Table 18. Canada Carbonated Beverages Market Estimates and Forecast, By Distribution Channel, 2018 - 2030 (USD Million)
- Table 19. Mexico Macro-Economic Outlay
- Table 20. Mexico Carbonated Beverages Market Estimates and Forecast, By Product, 2018 - 2030 (USD Million)
- Table 21. Mexico Carbonated Beverages Market Estimates and Forecast, By Flavor, 2018 - 2030 (USD Million)
- Table 22. Mexico Carbonated Beverages Market Estimates and Forecast, By Distribution Channel, 2018 - 2030 (USD Million)
- Table 23. Europe Carbonated Beverages Market Estimates and Forecast, By Country, 2018 - 2030 (USD Million)
- Table 24. Europe Carbonated Beverages Market Estimates and Forecast, By Product, 2018 - 2030 (USD Million)
- Table 25. Europe Carbonated Beverages Market Estimates and Forecast, By Flavor, 2018 - 2030 (USD Million)
- Table 26. Europe Carbonated Beverages Market Estimates and Forecast, By Distribution Channel, 2018 - 2030 (USD Million)
- Table 27. Germany Macro-Economic Outlay
- Table 28. Germany Carbonated Beverages Market Estimates and Forecast, By Product, 2018 - 2030 (USD Million)
- Table 29. Germany Carbonated Beverages Market Estimates and Forecast, By Flavor, 2018 - 2030 (USD Million)
- Table 30. Germany Carbonated Beverages Market Estimates and Forecast, By Distribution Channel, 2018 - 2030 (USD Million)
- Table 31. U.K. Macro-Economic Outlay
- Table 32. U.K. Carbonated Beverages Market Estimates and Forecast, By Product, 2018 - 2030 (USD Million)
- Table 33. U.K. Carbonated Beverages Market Estimates and Forecast, By Flavor, 2018 - 2030 (USD Million)
- Table 34. U.K. Carbonated Beverages Market Estimates and Forecast, By Distribution Channel, 2018 - 2030 (USD Million)
- Table 35. France Macro-Economic Outlay
- Table 36. France Carbonated Beverages Market Estimates and Forecast, By Product, 2018 - 2030 (USD Million)
- Table 37. France Carbonated Beverages Market Estimates and Forecast, By Flavor, 2018 - 2030 (USD Million)
- Table 38. France Carbonated Beverages Market Estimates and Forecast, By Distribution Channel, 2018 - 2030 (USD Million)
- Table 39. Spain Macro-Economic Outlay
- Table 40. Spain Carbonated Beverages Market Estimates and Forecast, By Product, 2018 - 2030 (USD Million)
- Table 41. Spain Carbonated Beverages Market Estimates and Forecast, By Flavor, 2018 - 2030 (USD Million)
- Table 42. Spain Carbonated Beverages Market Estimates and Forecast, By Distribution Channel, 2018 - 2030 (USD Million)
- Table 43. Italy Macro-Economic Outlay
- Table 44. Italy Carbonated Beverages Market Estimates and Forecast, By Product, 2018 - 2030 (USD Million)
- Table 45. Italy Carbonated Beverages Market Estimates and Forecast, By Flavor, 2018 - 2030 (USD Million)
- Table 46. Italy Carbonated Beverages Market Estimates and Forecast, By Distribution Channel, 2018 - 2030 (USD Million)
- Table 47. Asia Pacific Carbonated Beverages Market Estimates and Forecast, By Country, 2018 - 2030 (USD Million)
- Table 48. Asia Pacific Carbonated Beverages Market Estimates and Forecast, By Product, 2018 - 2030 (USD Million)
- Table 49. Asia Pacific Carbonated Beverages Market Estimates and Forecast, By Flavor, 2018 - 2030 (USD Million)
- Table 50. Asia Pacific Carbonated Beverages Market Estimates and Forecast, By Distribution Channel, 2018 - 2030 (USD Million)
- Table 51. China Macro-Economic Outlay
- Table 52. China Carbonated Beverages Market Estimates and Forecast, By Product, 2018 - 2030 (USD Million)
- Table 53. China Carbonated Beverages Market Estimates and Forecast, By Flavor, 2018 - 2030 (USD Million)
- Table 54. China Carbonated Beverages Market Estimates and Forecast, By Distribution Channel, 2018 - 2030 (USD Million)
- Table 55. Japan Macro-Economic Outlay
- Table 56. Japan Carbonated Beverages Market Estimates and Forecast, By Product, 2018 - 2030 (USD Million)
- Table 57. Japan Carbonated Beverages Market Estimates and Forecast, By Flavor, 2018 - 2030 (USD Million)
- Table 58. Japan Carbonated Beverages Market Estimates and Forecast, By Distribution Channel, 2018 - 2030 (USD Million)
- Table 59. India Macro-Economic Outlay
- Table 60. India Carbonated Beverages Market Estimates and Forecast, By Product, 2018 - 2030 (USD Million)
- Table 61. India Carbonated Beverages Market Estimates and Forecast, By Flavor, 2018 - 2030 (USD Million)
- Table 62. India Carbonated Beverages Market Estimates and Forecast, By Distribution Channel, 2018 - 2030 (USD Million)
- Table 63. South Korea Macro-Economic Outlay
- Table 64. South Korea Carbonated Beverages Market Estimates and Forecast, By Product, 2018 - 2030 (USD Million)
- Table 65. South Korea Carbonated Beverages Market Estimates and Forecast, By Flavor, 2018 - 2030 (USD Million)
- Table 66. South Korea Carbonated Beverages Market Estimates and Forecast, By Distribution Channel, 2018 - 2030 (USD Million)
- Table 67. Australia Macro-Economic Outlay
- Table 68. Australia Carbonated Beverages Market Estimates and Forecast, By Product, 2018 - 2030 (USD Million)
- Table 69. Australia Carbonated Beverages Market Estimates and Forecast, By Flavor, 2018 - 2030 (USD Million)
- Table 70. Australia Carbonated Beverages Market Estimates and Forecast, By Distribution Channel, 2018 - 2030 (USD Million)
- Table 71. Latin America Carbonated Beverages Market Estimates and Forecast, By Country, 2018 - 2030 (USD Million)
- Table 72. Latin America Carbonated Beverages Market Estimates and Forecast, By Product, 2018 - 2030 (USD Million)
- Table 73. Latin America Carbonated Beverages Market Estimates and Forecast, By Flavor, 2018 - 2030 (USD Million)
- Table 74. Latin America Carbonated Beverages Market Estimates and Forecast, By Distribution Channel, 2018 - 2030 (USD Million)
- Table 75. Brazil Macro-Economic Outlay
- Table 76. Brazil Carbonated Beverages Market Estimates and Forecast, By Product, 2018 - 2030 (USD Million)
- Table 77. Brazil Carbonated Beverages Market Estimates and Forecast, By Flavor, 2018 - 2030 (USD Million)
- Table 78. Brazil Carbonated Beverages Market Estimates and Forecast, By Distribution Channel, 2018 - 2030 (USD Million)
- Table 79. Middle East & Africa Carbonated Beverages Market Estimates and Forecast, By Country, 2018 - 2030 (USD Million)
- Table 80. Middle East & Africa Carbonated Beverages Market Estimates and Forecast, By Product, 2018 - 2030 (USD Million)
- Table 81. Middle East & Africa Carbonated Beverages Market Estimates and Forecast, By Flavor, 2018 - 2030 (USD Million)
- Table 82. Middle East & Africa Carbonated Beverages Market Estimates and Forecast, By Distribution Channel, 2018 - 2030 (USD Million)
- Table 83. South Africa Macro-Economic Outlay
- Table 84. South Africa Carbonated Beverages Market Estimates and Forecast, By Product, 2018 - 2030 (USD Million)
- Table 85. South Africa Carbonated Beverages Market Estimates and Forecast, By Flavor, 2018 - 2030 (USD Million)
- Table 86. South Africa Carbonated Beverages Market Estimates and Forecast, By Distribution Channel, 2018 - 2030 (USD Million)
- Table 87. Recent Developments & Impact Analysis, By Key Market Participants
- Table 88. Company Market Share, 2024 (%)
- Table 89. Company Heat Map Analysis, 2024
- Table 90. Companies Implementing Key Strategies
List of Figures
- Fig. 1 Carbonated Beverages Market Segmentation
- Fig. 2 Information Procurement
- Fig. 3 Primary Research Pattern
- Fig. 4 Primary Research Approaches
- Fig. 5 Primary Research Process
- Fig. 6 Market Snapshot
- Fig. 7 Segment Snapshot
- Fig. 8 Regional Snapshot
- Fig. 9 Competitive Landscape Snapshot
- Fig. 10 Global Parent Industry and Carbonated Beverages Size (USD Million)
- Fig. 11 Global Carbonated Beverages Size, 2018 to 2030 (USD Million)
- Fig. 12 Carbonated Beverages Market: Penetration & Growth Prospect Mapping
- Fig. 13 Carbonated Beverages Market: Value Chain Analysis
- Fig. 14 Carbonated Beverages Market: Dynamics
- Fig. 15 Carbonated Beverages Market: Porter's Five Forces Analysis
- Fig. 16 Carbonated Beverages Market Estimates & Forecast, By Product (USD Million)
- Fig. 17 Carbonated Soft Drinks Market Estimates & Forecasts, 2018 - 2030 (USD Million)
- Fig. 18 Carbonated Water Market Estimates & Forecasts, 2018 - 2030 (USD Million)
- Fig. 19 Carbonated Sports & Energy Drinks Market Estimates & Forecasts, 2018 - 2030 (USD Million)
- Fig. 20 Other Market Estimates & Forecasts, 2018 - 2030 (USD Million)
- Fig. 21 Carbonated Beverages Market Estimates & Forecast, By Flavor (USD Million)
- Fig. 22 Cola Market Estimates & Forecasts, 2018 - 2030 (USD Million)
- Fig. 23 Fruit-Based Market Estimates & Forecasts, 2018 - 2030 (USD Million)
- Fig. 24 Other Market Estimates & Forecasts, 2018 - 2030 (USD Million)
- Fig. 25 Carbonated Beverages Market Estimates & Forecast, By Distribution Channel (USD Million)
- Fig. 26 Carbonated Beverages Market Estimates & Forecasts For Hypermarkets & Supermarkets, 2018 - 2030 (USD Million)
- Fig. 27 Carbonated Beverages Market Estimates & Forecasts For Convenience Stores, 2018 - 2030 (USD Million)
- Fig. 28 Carbonated Beverages Market Estimates & Forecasts For Food Service Outlets, 2018 - 2030 (USD Million)
- Fig. 29 Carbonated Beverages Market Estimates & Forecasts For Transport Terminals, 2018 - 2030 (USD Million)
- Fig. 30 Carbonated Beverages Market Estimates & Forecasts For Online Stores & D2C, 2018 - 2030 (USD Million)
- Fig. 31 Carbonated Beverages Market: Regional outlook, 2024 & 2030, (USD Million)
- Fig. 32 Regional Marketplace: Key Takeaways
- Fig. 33 North America Carbonated Beverages Market Estimates & Forecast, 2018 - 2030 (USD Million)
- Fig. 34 US Carbonated Beverages Market Estimates & Forecast, 2018 - 2030 (USD Million)
- Fig. 35 Canada Carbonated Beverages Market Estimates & Forecast, 2018 - 2030 (USD Million)
- Fig. 36 Mexico Carbonated Beverages Market Estimates & Forecast, 2018 - 2030 (USD Million)
- Fig. 37 Europe Carbonated Beverages Market Estimates & Forecast, 2018 - 2030 (USD Million)
- Fig. 38 Germany Carbonated Beverages Market Estimates & Forecast, 2018 - 2030 (USD Million)
- Fig. 39 UK Carbonated Beverages Market Estimates & Forecast, 2018 - 2030 (USD Million)
- Fig. 40 France Carbonated Beverages Market Estimates & Forecast, 2018 - 2030 (USD Million)
- Fig. 41 Spain Carbonated Beverages Market Estimates & Forecast, 2018 - 2030 (USD Million)
- Fig. 42 Italy Carbonated Beverages Market Estimates & Forecast, 2018 - 2030 (USD Million)
- Fig. 43 Asia Pacific Carbonated Beverages Market Estimates & Forecast, 2018 - 2030 (USD Million)
- Fig. 44 China Carbonated Beverages Market Estimates & Forecast, 2018 - 2030 (USD Million)
- Fig. 45 Japan Carbonated Beverages Market Estimates & Forecast, 2018 - 2030 (USD Million)
- Fig. 46 India Carbonated Beverages Market Estimates & Forecast, 2018 - 2030 (USD Million)
- Fig. 47 South Korea Carbonated Beverages Market Estimates & Forecast, 2018 - 2030 (USD Million)
- Fig. 48 Australia Carbonated Beverages Market Estimates & Forecast, 2018 - 2030 (USD Million)
- Fig. 49 Latin America Carbonated Beverages Market Estimates & Forecast, 2018 - 2030 (USD Million)
- Fig. 50 Brazil Carbonated Beverages Market Estimates & Forecast, 2018 - 2030 (USD Million)
- Fig. 51 Middle East & Africa Carbonated Beverages Market Estimates & Forecast, 2018 - 2030 (USD Million)
- Fig. 52 South Africa Carbonated Beverages Market Estimates & Forecast, 2018 - 2030 (USD Million)
- Fig. 53 Key Company Categorization
- Fig. 54 Company Market Share Analysis, 2024
- Fig. 55 Strategic Framework of Carbonated Beverages
Carbonated Beverages Market Growth & Trends:
The global carbonated beverages market size is estimated to reach USD 895.2 million by 2030, expanding at a CAGR of 6.4% from 2025 to 2030, according to a new report by Grand View Research, Inc. Growing demand for premium drinks, coupled with improvement in economic indicators in developing economies, is expected to promote market growth. Furthermore, increasing spending by the carbonated beverage manufacturers has been playing a crucial role in the industry movement at the global level. These innovations are being brought in product, packaging, distribution, and other various aspects of the business. In June 2020, PepsiCo took an initiative to expand Soda Stream into an away-from-home environment, including workplace, college, airport, and other professional places with large public interactions.
Furthermore, the product can be easily regulated using the Soda Stream Professional Hydration Platform. The mobile-enabled application allows people to personalize their beverage as well as digitally track their water intake. The product has also been playing a crucial role in reducing plastic bottle waste.
Similarly, product launches have been playing a vital part in market growth. In April 2020, Taisho Pharmaceutical Holdings launched carbonated energy drinks under the brand Raizin. The product is available in two flavors, including ginger and mixed fruits. The beverage is caffeine-free and contains enXtra, a ginger plant extract known to have a positive effect on sports nutrition, weight loss, and cognitive care. It also contains ginkgo biloba extract, deproteinized royal jelly, vitamin B2 & B6, and amino acids, like histidine, isoleucine, and inositol. The product is being retailed at JPY 190.
In October 2019, Coca Cola launched its energy drinks in regular and cherry flavors. The zero-calorie product is available in 25 international markets. Its 12 ounces can contain 114 milligrams of caffeine, which has been derived from natural sources. Along with that, it contains guarana extracts and B vitamins.
In January 2020, Celsius Holdings, Inc. launched CELSIUS HEAT, a jackfruit flavor carbonated performance energy drink. The drink with sweet and tangy taste is available in 16oz HEAT can and contains 2,000mg of L-citrulline, 300mg of caffeine, and a proprietary blend. The tag "PROVEN PERFORMANCE" on the can reinforces the brand's structure and function.
Carbonated Beverages Market Report Highlights:
- By product, soft drinks dominated the market in 2024 with a share of more than 49.8%. This is attributed to the first-mover advantage
- The sports and energy drinks segment is expected to witness the fastest growth with a CAGR of 7.4% from 2025 to 2030. The growth is attributed to growing consciousness among people of all generations regarding healthy lifestyle
- By flavor, the fruit-based flavors segment is projected to record the fastest CAGR during the forecast period, driven by increasing consumer preference for natural and healthy options. Availability of a large variety of fruits, along with the option of having more number of natural ingredients, is leading to the rapid growth
- North America carbonated beverages market held the largest share of 32.1% in 2024, fueled by the popularity of sparkling water due to its refreshing quality and low-calorie content.
Table of Contents
Chapter 1. Methodology and Scope
- 1.1. Market Segmentation & Scope
- 1.2. Market Definition
- 1.3. Information Procurement
- 1.3.1. Purchased Database
- 1.3.2. GVR's Internal Database
- 1.3.3. Secondary Sources & Third-Party Perspectives
- 1.3.4. Primary Research
- 1.4. Information Analysis
- 1.4.1. Data Analysis Models
- 1.5. Market Formulation & Data Visualization
- 1.6. Data Validation & Publishing
Chapter 2. Executive Summary
- 2.1. Market Snapshot
- 2.2. Segment Snapshot
- 2.3. Competitive Landscape Snapshot
Chapter 3. Carbonated Beverages Market Variables, Trends & Scope
- 3.1. Market Lineage Outlook
- 3.1.1. Parent Market Outlook
- 3.1.2. Related Market Outlook
- 3.2. Industry Value Chain Analysis
- 3.3. Market Dynamics
- 3.3.1. Market Driver Analysis
- 3.3.2. Market Restraint Analysis
- 3.4. Industry Analysis Tools
- 3.4.1. Porter's Five Forces Analysis
- 3.5. Market Entry Strategies
Chapter 4. Consumer Behavior Analysis
- 4.1. Demographic Analysis
- 4.2. Consumer Trends and Preferences
- 4.3. Factors Affecting Buying Decision
- 4.4. Consumer Product Adoption
- 4.5. Observations & Recommendations
Chapter 5. Carbonated Beverages Market: Product Estimates & Trend Analysis
- 5.1. Carbonated Beverages Market, By Product: Key Takeaways
- 5.2. Product Movement Analysis & Market Share, 2024 & 2030
- 5.3. Market Estimates & Forecasts, By Product, 2018 - 2030 (USD Million)
- 5.3.1. Carbonated Soft Drinks
- 5.3.1.1. Market Estimates and Forecast, 2018 - 2030 (USD Million)
- 5.3.2. Carbonated Water
- 5.3.2.1. Market Estimates and Forecast, 2018 - 2030 (USD Million)
- 5.3.3. Carbonated Sports & Energy Drinks
- 5.3.3.1. Market Estimates and Forecast, 2018 - 2030 (USD Million)
- 5.3.4. Others
- 5.3.4.1. Market Estimates and Forecast, 2018 - 2030 (USD Million)
- 5.3.1. Carbonated Soft Drinks
Chapter 6. Carbonated Beverages Market: Flavor Estimates & Trend Analysis
- 6.1. Carbonated Beverages Market, By Flavor: Key Takeaways
- 6.2. Flavor Movement Analysis & Market Share, 2024 & 2030
- 6.3. Market Estimates & Forecasts, By Flavor, 2018 - 2030 (USD Million)
- 6.3.1. Cola
- 6.3.1.1. Market Estimates and Forecast, 2018 - 2030 (USD Million)
- 6.3.2. Fruit Based
- 6.3.2.1. Market Estimates and Forecast, 2018 - 2030 (USD Million)
- 6.3.3. Others
- 6.3.3.1. Market Estimates and Forecast, 2018 - 2030 (USD Million)
- 6.3.1. Cola
Chapter 7. Carbonated Beverages Market: Distribution Channel Estimates & Trend Analysis
- 7.1. Carbonated Beverages Market, By Distribution Channel: Key Takeaways
- 7.2. Distribution Channel Movement Analysis & Market Share, 2024 & 2030
- 7.3. Market Estimates & Forecasts, By Distribution Channel, 2018 - 2030 (USD Million)
- 7.3.1. Hypermarkets & Supermarkets
- 7.3.1.1. Market Estimates and Forecast, 2018 - 2030 (USD Million)
- 7.3.2. Convenience Stores
- 7.3.2.1. Market Estimates and Forecast, 2018 - 2030 (USD Million)
- 7.3.3. Food Service Outlets
- 7.3.3.1. Market Estimates and Forecast, 2018 - 2030 (USD Million)
- 7.3.4. Transport Terminals
- 7.3.4.1. Market Estimates and Forecast, 2018 - 2030 (USD Million)
- 7.3.5. Online Stores & D2C
- 7.3.5.1. Market Estimates and Forecast, 2018 - 2030 (USD Million)
- 7.3.1. Hypermarkets & Supermarkets
Chapter 8. Carbonated Beverages Market: Regional Estimates & Trend Analysis
- 8.1. Carbonated Beverages Market: Regional Outlook
- 8.2. Regional Marketplaces: Key Takeaways
- 8.3. Market Estimates & Forecasts, By Region, 2018 - 2030 (USD Million)
- 8.3.1. North America
- 8.3.1.1. Market Estimates and Forecast, 2018 - 2030 (USD Million)
- 8.3.1.2. U.S.
- 8.3.1.2.1. Key Country Dynamics
- 8.3.1.2.2. Market Estimates and Forecast, 2018 - 2030 (USD Million)
- 8.3.1.3. Canada
- 8.3.1.3.1. Key Country Dynamics
- 8.3.1.3.2. Market Estimates and Forecast, 2018 - 2030 (USD Million)
- 8.3.1.4. Mexico
- 8.3.1.4.1. Key Country Dynamics
- 8.3.1.4.2. Market Estimates and Forecast, 2018 - 2030 (USD Million)
- 8.3.2. Europe
- 8.3.2.1. Market Estimates and Forecast, 2018 - 2030 (USD Million)
- 8.3.2.2. U.K.
- 8.3.2.2.1. Key Country Dynamics
- 8.3.2.2.2. Market Estimates and Forecast, 2018 - 2030 (USD Million)
- 8.3.2.3. Germany
- 8.3.2.3.1. Key Country Dynamics
- 8.3.2.3.2. Market Estimates and Forecast, 2018 - 2030 (USD Million)
- 8.3.2.4. France
- 8.3.2.4.1. Key Country Dynamics
- 8.3.2.4.2. Market Estimates and Forecast, 2018 - 2030 (USD Million)
- 8.3.2.5. Italy
- 8.3.2.5.1. Key Country Dynamics
- 8.3.2.5.2. Market Estimates and Forecast, 2018 - 2030 (USD Million)
- 8.3.2.6. Spain
- 8.3.2.6.1. Key Country Dynamics
- 8.3.2.6.2. Market Estimates and Forecast, 2018 - 2030 (USD Million)
- 8.3.3. Asia Pacific
- 8.3.3.1. Market Estimates and Forecast, 2018 - 2030 (USD Million)
- 8.3.3.2. China
- 8.3.3.2.1. Key Country Dynamics
- 8.3.3.2.2. Market Estimates and Forecast, 2018 - 2030 (USD Million)
- 8.3.3.3. India
- 8.3.3.3.1. Key Country Dynamics
- 8.3.3.3.2. Market Estimates and Forecast, 2018 - 2030 (USD Million)
- 8.3.3.4. Japan
- 8.3.3.4.1. Key Country Dynamics
- 8.3.3.4.2. Market Estimates and Forecast, 2018 - 2030 (USD Million)
- 8.3.3.5. Australia & New Zealand
- 8.3.3.5.1. Key Country Dynamics
- 8.3.3.5.2. Market Estimates and Forecast, 2018 - 2030 (USD Million)
- 8.3.3.6. South Korea
- 8.3.3.6.1. Key Country Dynamics
- 8.3.3.6.2. Market Estimates and Forecast, 2018 - 2030 (USD Million)
- 8.3.4. Latin America
- 8.3.4.1. Market Estimates and Forecast, 2018 - 2030 (USD Million)
- 8.3.4.2. Brazil
- 8.3.4.2.1. Key Country Dynamics
- 8.3.4.2.2. Market Estimates and Forecast, 2018 - 2030 (USD Million)
- 8.3.5. Middle East & Africa
- 8.3.5.1. Market Estimates and Forecast, 2018 - 2030 (USD Million)
- 8.3.5.2. South Africa
- 8.3.5.2.1. Key Country Dynamics
- 8.3.5.2.2. Market Estimates and Forecast, 2018 - 2030 (USD Million)
- 8.3.1. North America
Chapter 9. Carbonated Beverages Market: Competitive Analysis
- 9.1. Recent Developments & Impact Analysis, By Key Market Participants
- 9.2. Company Categorization
- 9.3. Participant's Overview
- 9.4. Financial Performance
- 9.5. Product Benchmarking
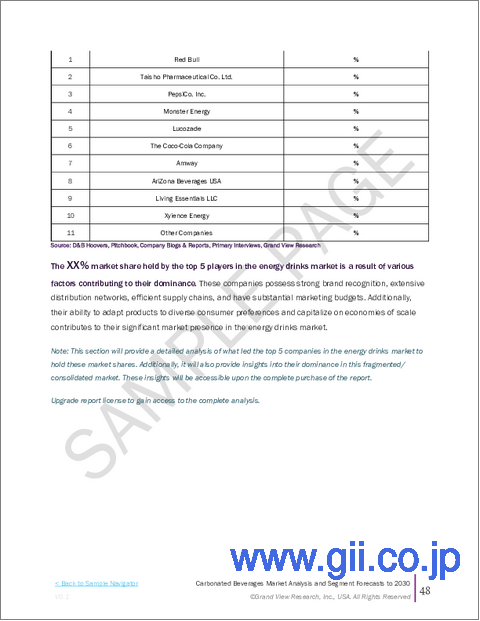
- 9.6. Company Market Share Analysis, 2024 (%)
- 9.7. Company Heat Map Analysis
- 9.8. Strategy Mapping
- 9.9. Company Profiles
- 9.9.1. Anadolu Group
- 9.9.1.1. Company Overview
- 9.9.1.2. Financial Performance
- 9.9.1.3. Product Portfolios
- 9.9.1.4. Strategic Initiatives
- 9.9.2. Danone
- 9.9.2.1. Company Overview
- 9.9.2.2. Financial Performance
- 9.9.2.3. Product Portfolios
- 9.9.2.4. Strategic Initiatives
- 9.9.3. JONES
- 9.9.3.1. Company Overview
- 9.9.3.2. Financial Performance
- 9.9.3.3. Product Portfolios
- 9.9.3.4. Strategic Initiatives
- 9.9.4. Keurig Dr Pepper
- 9.9.4.1. Company Overview
- 9.9.4.2. Financial Performance
- 9.9.4.3. Product Portfolios
- 9.9.4.4. Strategic Initiatives
- 9.9.5. Monster Energy Company
- 9.9.5.1. Company Overview
- 9.9.5.2. Financial Performance
- 9.9.5.3. Product Portfolios
- 9.9.5.4. Strategic Initiatives
- 9.9.6. National Beverage Corp.
- 9.9.6.1. Company Overview
- 9.9.6.2. Financial Performance
- 9.9.6.3. Product Portfolios
- 9.9.6.4. Strategic Initiatives
- 9.9.7. PepsiCo
- 9.9.7.1. Company Overview
- 9.9.7.2. Financial Performance
- 9.9.7.3. Product Portfolios
- 9.9.7.4. Strategic Initiatives
- 9.9.8. Refresco Group
- 9.9.8.1. Company Overview
- 9.9.8.2. Financial Performance
- 9.9.8.3. Product Portfolios
- 9.9.8.4. Strategic Initiatives
- 9.9.9. SodaStream Inc.
- 9.9.9.1. Company Overview
- 9.9.9.2. Financial Performance
- 9.9.9.3. Product Portfolios
- 9.9.9.4. Strategic Initiatives
- 9.9.10. SUNTORY BEVERAGE & FOOD LIMITED.
- 9.9.10.1. Company Overview
- 9.9.10.2. Financial Performance
- 9.9.10.3. Product Portfolios
- 9.9.10.4. Strategic Initiatives
- 9.9.11. The Coca-Cola Company.
- 9.9.11.1. Company Overview
- 9.9.11.2. Financial Performance
- 9.9.11.3. Product Portfolios
- 9.9.11.4. Strategic Initiatives
- 9.9.1. Anadolu Group
