
|
市場調査レポート
商品コード
1683494
米国の動物性たんぱく質:市場シェア分析、産業動向・統計、成長予測(2025年~2030年)United States Animal Protein - Market Share Analysis, Industry Trends & Statistics, Growth Forecasts (2025 - 2030) |
||||||
カスタマイズ可能
適宜更新あり
|
|||||||
| 米国の動物性たんぱく質:市場シェア分析、産業動向・統計、成長予測(2025年~2030年) |
|
出版日: 2025年03月18日
発行: Mordor Intelligence
ページ情報: 英文 249 Pages
納期: 2~3営業日
|

全表示
- 概要
- 目次
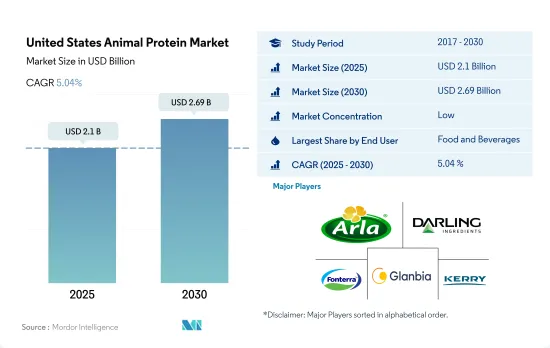
米国の動物性たんぱく質市場規模は2025年に21億米ドルと推定され、2030年には26億9,000万米ドルに達すると予測され、予測期間(2025-2030年)のCAGRは5.04%で成長します。
国内における健康志向の高まりが、様々なセグメントにおける高たんぱく質原料の使用に影響
- F&Bセグメント、主にスナックのサブセグメントが成長率で市場を独占しており、予測期間中のCAGRは金額ベースで2.28%と予想されます。特に動物性たんぱく質は消費者の間で人気が高まっており、すべての飲食品分野に影響を与えています。プロテイン・スナックに対する需要は特に強く、米国の消費者の4人に1人が2022年に消費するスナックを決める際に「たんぱく質が多いこと」を非常に重要な属性として回答しており、これは特にミレニアル世代の消費者に当てはまる。消費者がたんぱく質スナックを求める理由は様々で、満腹感、エネルギー、筋肉サポート、減量、健康的な加齢、一般的な栄養などが含まれます。
- サプリメント分野はF&Bに次ぐ市場の主要分野であり、予測期間中に金額ベースで5.55%のCAGRで推移すると予想されます。サプリメントの種類別では、筋肉組織の成長、修復、強化といった機能性により、スポーツ栄養が最も高い需要を示しました。米国では、成人の36.5%が肥満であり、32.5%が過体重です。2021年には、米国の成人の3分の2以上が過体重または肥満となります。2021年には、約4,500万人の成人(人口の約14%)がジムの会員かフィットネスセンターの会員になっています。健康への関心の高まり、肥満率の上昇、ヘルスクラブの増加により、これらの製品に対する需要が増加しました。
- 2021年のF&Bセグメントの前年比成長率は、金額ベースで0.68%に増加しました。これは主に米国の食肉、鶏肉、魚の食品価格指数が4.3%上昇し、シリアル・ベーカリー指数が2021年に2.9%上昇したためです。
米国の動物性たんぱく質市場動向
動物性たんぱく質の消費拡大が、原料部門の主要企業に機会を与える
- 菜食主義者の増加にもかかわらず、米国では動物性たんぱく質の需要は安定しています。米国人の食生活におけるたんぱく質の大部分は牛肉と鶏肉から摂取され、次いで乳製品が続きます。2022年には、米国の成人消費者の80%が、豚肉、牛肉、鶏肉、魚を主なタンパク源として好んでいます。ゼラチンは水と結合する性質があるため、機能性食品業界での利用が拡大していることが市場を大きく牽引しています。消費者は伝統的なたんぱく質の選択肢を求め続けているが、動物性たんぱく質業界に対し、環境問題への対応にもっと力を入れるよう期待を示しています。
- 幅広い用途と健康的なライフスタイルに対する消費者の嗜好により、多くの米国原料メーカーがコラーゲン市場への参入を試みており、これが一人当たり消費パターンの増加の主な理由となっています。2019年から2021年にかけて、米国における医師が診断した関節炎の未調整有病率は、女性で24.2%、男性で17.9%でした。関節炎の罹患率が高いことから、骨と関節の健康をサポートするコラーゲンベースのサプリメントに対するニーズが高まっています。
- 動物性たんぱく質が植物性たんぱく質より生物学的価値が高いことは、長年にわたる調査で証明されています。食品農業機関が提唱したたんぱく質消化率補正アミノ酸スコアでは、牛乳と乳清たんぱく質は1点で、食事に必要なすべてのアミノ酸を100%(またはそれ以上)摂取できることを示しています。逆に、植物性タンパク源は1つ以上のアミノ酸が不足し、消化が遅れます。このことが、アスリートやフィットネス愛好家を動物性たんぱく質の摂取に駆り立てています。
肉と牛乳の生産は、動物性たんぱく質原料として大きく貢献しています。
- グラフは、牛、豚、鶏の肉(骨付き、生、チルド)、牛とヤギの生乳、牛のスキムミルク、乾燥ホエイパウダーなどの原材料の生産データを示しています。2023年の牛1頭当たりの生乳生産量は24,087ポンドで、2020年の23,777ポンドから1.30%増加しました。2022年現在、米国の平均乳牛数は9,402頭です。牛乳は通常、様々な工程を経て成分に分離され、流動性のある飲料用ミルクやその他の乳製品の製造に加工されます。
- 米国は世界最大の鶏肉生産国であり、2023年には世界の鶏肉生産量の20%のシェアを占めています。食肉生産・加工部門は、「バイデン・ハリス政権の行動計画」のような政府のイニシアチブの恩恵を受けると推定されます。この計画は、より公正で、競争力があり、弾力性のある食肉・鶏肉のサプライチェーンの開発を支援するために導入されたものです。米国農務省は、既存の食肉・鶏肉加工施設167ヵ所に対し、3,200万米ドルの補助金を交付し、より多くの顧客開拓を支援しました。
- 牛肉はコラーゲンの最も一般的な供給源のひとつであり、このユニークなたんぱく質を大量に供給しています。牛肉のコラーゲン含有量は平均して約2~3%です。世界最大の肥育牛産業である米国は、牛肉の世界最大の生産国でもあり、主に国内および輸出用の高品質の穀物肥育牛肉が生産されています。肉牛は米国全50州で飼育されており、2023年7月現在、テキサス州、オクラホマ州、ミズーリ州、ネブラスカ州、サウスダコタ州、カンザス州、モンタナ州が米国の主要な牛肉生産州となっています。
米国の動物性たんぱく質産業の概要
米国の動物性たんぱく質市場は細分化されており、上位5社で22.60%を占めています。この市場の主要企業は以下の通りです。Arla Foods amba, Darling Ingredients Inc., Fonterra Co-operative Group Limited, Glanbia PLC and Kerry Group PLC(sorted alphabetically).
その他の特典
- エクセル形式の市場予測(ME)シート
- 3ヶ月のアナリストサポート
目次
第1章 エグゼクティブサマリーと主な調査結果
第2章 イントロダクション
- 調査の前提条件と市場定義
- 調査範囲
- 調査手法
第3章 主要産業動向
- エンドユーザー市場規模
- ベビーフードおよび乳児用調製粉乳
- ベーカリー
- 飲料
- 朝食用シリアル
- 調味料/ソース
- 菓子類
- 乳製品および乳製品代替製品
- 高齢者栄養・医療栄養
- 肉・鶏肉・魚介類および肉代替製品
- RTE/RTC食品
- スナック
- スポーツ/パフォーマンス栄養
- 動物飼料
- パーソナルケアと化粧品
- たんぱく質消費動向
- 動物
- 生産動向
- 動物
- 規制の枠組み
- 米国
- バリューチェーンと流通チャネル分析
第4章 市場セグメンテーション
- たんぱく質タイプ
- カゼインおよびカゼイネート
- コラーゲン
- 卵たんぱく質
- ゼラチン
- 昆虫プロテイン
- ミルクプロテイン
- ホエイプロテイン
- その他動物性たんぱく質
- エンドユーザー
- 動物飼料
- 飲食品
- サブエンドユーザー別
- ベーカリー
- 飲料
- 朝食用シリアル
- 調味料/ソース
- 菓子類
- 乳製品・乳製品代替品
- RTE/RTC食品
- スナック
- パーソナルケアと化粧品
- サプリメント
- サブエンドユーザー別
- ベビーフードおよび乳児用調製乳
- 高齢者栄養と医療栄養
- スポーツ/パフォーマンス栄養
第5章 競合情勢
- 主要な戦略動向
- 市場シェア分析
- 企業情勢
- 企業プロファイル(世界レベルの概要、市場レベルの概要、主要な事業セグメント、財務、従業員数、主要情報、市場ランク、市場シェア、製品・サービス、最近の動向分析を含む)
- Agropur Dairy Cooperative
- Ajinomoto Co. Inc.
- AMCO Proteins
- Arla Foods amba
- Baotou Dongbao Bio-tech Co. Ltd
- Darling Ingredients Inc.
- Enterra Corporation
- ETChem
- Farbest-Tallman Foods Corporation
- Fonterra Co-operative Group Limited
- Gelita AG
- Glanbia PLC
- Groupe Lactalis
- Kerry Group PLC
- Milk Specialties Global
- Symrise AG
第6章 CEOへの主な戦略的質問
第7章 付録
- 世界概要
- 概要
- ファイブフォース分析フレームワーク
- 世界のバリューチェーン分析
- 市場力学(DROs)
- 情報源と参考文献
- 図表一覧
- 主要洞察
- データパック
- 用語集
The United States Animal Protein Market size is estimated at 2.1 billion USD in 2025, and is expected to reach 2.69 billion USD by 2030, growing at a CAGR of 5.04% during the forecast period (2025-2030).
Rising health concerns in the country influence the use of high-protein ingredients in various segments
- The F&B segment, majorly the snacks sub-segment, dominated the market in terms of growth rate, and it is expected to register a CAGR of 2.28%, by value, during the forecast period. Animal protein, in particular, is becoming more and more popular with consumers, impacting all food and beverage sectors. The demand for protein snacks is particularly strong, with 1 in 4 US consumers indicating "high in protein" as a very important attribute in 2022 when deciding which snacks to consume, which is especially true for millennial consumers. Consumers seek protein snacks for various reasons, including satiety, energy, muscle support, weight loss, healthy aging, and general nutrition.
- The supplement segment is the major segment in the market after F&B, and it is expected to record a CAGR of 5.55%, by value, during the forecast period. By supplement type, sports nutrition saw the highest demand due to its functionalities like growth, repair, and strengthening of muscular tissue. In the United States, 36.5% of adults are obese, and 32.5% are overweight. More than two-thirds of adults in the United States were overweight or obese in 2021. Around 45 million adults (approximately 14% of the population) had a gym membership or fitness center membership in 2021. Rising health concerns, higher obesity prevalence, and a rise in health clubs led to increased demand for these products.
- The Y-o-Y growth rate of the F&B segment increased to 0.68%, by value, in 2021. It was mainly due to the US food price index for meat, poultry, and fish, which increased by 4.3%, and the cereal and bakery index increased by 2.9% in 2021.
United States Animal Protein Market Trends
The consumption growth of animal protein fuels opportunities for key players in the ingredients segment
- Despite the rising vegan population, the demand for animal protein has been steady in the United States. The majority of protein in the American diet comes from beef and poultry, followed by dairy. In 2022, 80% of US adult consumers preferred pork, beef, poultry, and fish as their main sources of protein. Due to its water-binding properties, the market is majorly driven by the growing usage of gelatin in the functional food industry. Consumers continue to demand traditional protein options, but they are signaling an expectation of the animal protein industry to do more to address environmental concerns.
- With a wide range of applications and consumer preferences toward a healthy lifestyle, many US ingredient manufacturers are trying to enter the collagen market, which is the major reason for the increase in per capita consumption patterns. From 2019 to 2021, the unadjusted prevalence of doctor-diagnosed arthritis in the United States was 24.2% among women and 17.9% among men. Due to the high incidence of arthritis in the area, there is a growing need for collagen-based supplements to support bone and joint health.
- Over the years, considerable research has proven that animal protein has a higher biological value than plant protein. In the Protein Digestibility-corrected Amino Acid Score proposed by the Food and Agricultural Organization, milk and whey protein scored 1, indicating that the protein would provide 100% (or more) of all the amino acids required in the diet. On the contrary, plant sources lack one or more amino acids, with delayed digestibility. This factor is driving athletes and fitness enthusiasts to consume animal-based protein.
Meat and milk production contributes majorly as raw material for animal protein ingredients
- The graph given depicts the production data for raw materials such as meat of cattle, pigs, and chicken (with bone, fresh or chilled), raw milk from cattle and goats, skim milk from cows, and dry whey powder. In 2023, 24,087 pounds of milk was produced per cow, an increase of 1.30% from 23,777 pounds in 2020. As of 2022, the average number of milk cows in the United States was 9,402. Milk is usually separated through various processes into components and processed into fluid beverage milk or the manufacture of other dairy products.
- The United States is the world's largest producer of chicken meat and accounted for a 20% share of global chicken meat production in 2023. The meat production and processing sector is estimated to benefit from government initiatives such as 'Biden-Harris Administration's Action Plan," which has been introduced to support the development of a fairer, more competitive, and more resilient meat and poultry supply chain in the country. The US Department of Agriculture made USD 32 million in grants to 167 existing meat and poultry processing facilities to help them reach more customers.
- Cattle meat is one of the most common sources of collagen, providing a significant amount of this unique protein. On average, beef has approximately 2-3% collagen in its composition. With the largest fed-cattle industry in the world, the United States is also the world's largest producer of cattle meat, primarily high-quality, grain-fed cattle meat for domestic and export use. Beef cattle are raised in all 50 states of the United States, with Texas, Oklahoma, Missouri, Nebraska, South Dakota, Kansas, and Montana as the leading cattle meat-producing states in the country as of July 2023.
United States Animal Protein Industry Overview
The United States Animal Protein Market is fragmented, with the top five companies occupying 22.60%. The major players in this market are Arla Foods amba, Darling Ingredients Inc., Fonterra Co-operative Group Limited, Glanbia PLC and Kerry Group PLC (sorted alphabetically).
Additional Benefits:
- The market estimate (ME) sheet in Excel format
- 3 months of analyst support
TABLE OF CONTENTS
1 EXECUTIVE SUMMARY & KEY FINDINGS
2 INTRODUCTION
- 2.1 Study Assumptions & Market Definition
- 2.2 Scope of the Study
- 2.3 Research Methodology
3 KEY INDUSTRY TRENDS
- 3.1 End User Market Volume
- 3.1.1 Baby Food and Infant Formula
- 3.1.2 Bakery
- 3.1.3 Beverages
- 3.1.4 Breakfast Cereals
- 3.1.5 Condiments/Sauces
- 3.1.6 Confectionery
- 3.1.7 Dairy and Dairy Alternative Products
- 3.1.8 Elderly Nutrition and Medical Nutrition
- 3.1.9 Meat/Poultry/Seafood and Meat Alternative Products
- 3.1.10 RTE/RTC Food Products
- 3.1.11 Snacks
- 3.1.12 Sport/Performance Nutrition
- 3.1.13 Animal Feed
- 3.1.14 Personal Care and Cosmetics
- 3.2 Protein Consumption Trends
- 3.2.1 Animal
- 3.3 Production Trends
- 3.3.1 Animal
- 3.4 Regulatory Framework
- 3.4.1 United States
- 3.5 Value Chain & Distribution Channel Analysis
4 MARKET SEGMENTATION (includes market size in Value in USD and Volume, Forecasts up to 2030 and analysis of growth prospects)
- 4.1 Protein Type
- 4.1.1 Casein and Caseinates
- 4.1.2 Collagen
- 4.1.3 Egg Protein
- 4.1.4 Gelatin
- 4.1.5 Insect Protein
- 4.1.6 Milk Protein
- 4.1.7 Whey Protein
- 4.1.8 Other Animal Protein
- 4.2 End User
- 4.2.1 Animal Feed
- 4.2.2 Food and Beverages
- 4.2.2.1 By Sub End User
- 4.2.2.1.1 Bakery
- 4.2.2.1.2 Beverages
- 4.2.2.1.3 Breakfast Cereals
- 4.2.2.1.4 Condiments/Sauces
- 4.2.2.1.5 Confectionery
- 4.2.2.1.6 Dairy and Dairy Alternative Products
- 4.2.2.1.7 RTE/RTC Food Products
- 4.2.2.1.8 Snacks
- 4.2.3 Personal Care and Cosmetics
- 4.2.4 Supplements
- 4.2.4.1 By Sub End User
- 4.2.4.1.1 Baby Food and Infant Formula
- 4.2.4.1.2 Elderly Nutrition and Medical Nutrition
- 4.2.4.1.3 Sport/Performance Nutrition
5 COMPETITIVE LANDSCAPE
- 5.1 Key Strategic Moves
- 5.2 Market Share Analysis
- 5.3 Company Landscape
- 5.4 Company Profiles (includes Global Level Overview, Market Level Overview, Core Business Segments, Financials, Headcount, Key Information, Market Rank, Market Share, Products and Services, and Analysis of Recent Developments).
- 5.4.1 Agropur Dairy Cooperative
- 5.4.2 Ajinomoto Co. Inc.
- 5.4.3 AMCO Proteins
- 5.4.4 Arla Foods amba
- 5.4.5 Baotou Dongbao Bio-tech Co. Ltd
- 5.4.6 Darling Ingredients Inc.
- 5.4.7 Enterra Corporation
- 5.4.8 ETChem
- 5.4.9 Farbest-Tallman Foods Corporation
- 5.4.10 Fonterra Co-operative Group Limited
- 5.4.11 Gelita AG
- 5.4.12 Glanbia PLC
- 5.4.13 Groupe Lactalis
- 5.4.14 Kerry Group PLC
- 5.4.15 Milk Specialties Global
- 5.4.16 Symrise AG
6 KEY STRATEGIC QUESTIONS FOR PROTEIN INGREDIENTS INDUSTRY CEOS
7 APPENDIX
- 7.1 Global Overview
- 7.1.1 Overview
- 7.1.2 Porter's Five Forces Framework
- 7.1.3 Global Value Chain Analysis
- 7.1.4 Market Dynamics (DROs)
- 7.2 Sources & References
- 7.3 List of Tables & Figures
- 7.4 Primary Insights
- 7.5 Data Pack
- 7.6 Glossary of Terms

