|
|
市場調査レポート
商品コード
1441696
貨物および物流:市場シェア分析、業界動向と統計、成長予測(2024~2029年)Freight and Logistics - Market Share Analysis, Industry Trends & Statistics, Growth Forecasts (2024 - 2029) |
||||||

|
|||||||
カスタマイズ可能
適宜更新あり
|
|||||||


| 貨物および物流:市場シェア分析、業界動向と統計、成長予測(2024~2029年) |
|
出版日: 2024年02月15日
発行: Mordor Intelligence
ページ情報: 英文 903 Pages
納期: 2~3営業日
|

全表示
- 概要
- 目次
概要
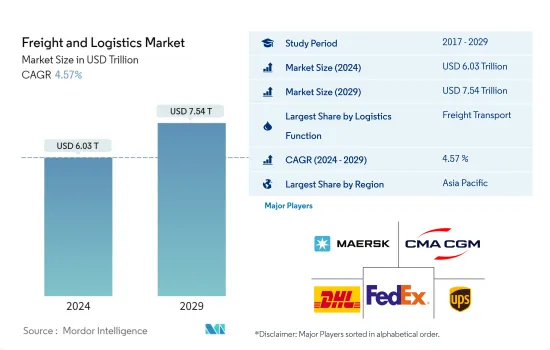
貨物および物流市場の規模は、2024年に6兆300億米ドルと推定され、2029年までに7兆5,400億米ドルに達すると予測されており、予測期間(2024年から2029年)中に4.57%のCAGRで成長します。
アジア太平洋が世界の空港インフラへの投資をリードし、欧州と米国がそれに続く
- 2020年には中国が世界のインフラ支出をリードしていたが、2022年5月までに、現在進行中の最も高額なインフラプロジェクトに関しては欧州と米国が主導権を握った。 2021年現在、米国はロシア、中国、インドを超え、6万キロメートルを超える世界最長の鉄道網を誇っています。
- 2022年 5月時点でインドは、進行中または計画中のインフラプロジェクトの件数が2,500万米ドルに達し、世界トップとなった。比較すると、米国には1,866件のプロジェクトがあり、中国には1,175件のプロジェクトがありました。米国カリフォルニア州の高速鉄道プロジェクトは、世界で最も価値のあるインフラストラクチャープロジェクトの1つとして認識されており、2022年 10月時点での価値は1,130億米ドルと推定されています。鉄道路線は主要なインフラプロジェクトのかなりの部分を占めています。日本だけでなく、ノルウェー、スウェーデン、英国、米国、アジア、東南アジアのさまざまな地域を網羅して開発中です。
- 2022年 3月時点で、アジア太平洋地域は建設中の空港インフラプロジェクトの数でトップとなり、滑走路やターミナルなどのさまざまなコンポーネントを含む合計 230のプロジェクトが行われました。これらのプロジェクトの総額は2,275億米ドルに達しました。これに僅差で続くのが欧州で、建設中の空港インフラプロジェクトの数が2番目に多く、進行中のプロジェクトは178件、総額 1,090億米ドルに達しています。しかし、世界の空港建設に対する全体的な支出を考慮すると、北米の総投資額は1,175億米ドルとなり、他の地域をわずかに上回りました。
不確実性の中の強い可能性
- アジア太平洋、北米、欧州は、南米と湾岸諸国とともに、世界の貨物および物流市場を独占しています。 2022年の世界のトラック輸送量は前年比3.6%増加しましたが、サプライチェーンのボトルネックは引き続き道路貨物輸送に影響を及ぼしています。アジア太平洋と欧州への大規模な投資のおかげで、世界の鉄道産業は2020年と2022年にそれぞれ1.6%と4.1%の成長を記録しました。鉄道産業は2027年まで3%のCAGRで推移すると予想されています。世界の成長に影響を与えるウクライナ戦争とインフレの高騰は、世界貿易輸送の80%を占める世界の海運に影響を与える可能性があります。世界の航空貨物需要は2022年10月に前年比13.6%減少したが、同月には前月比3.5%増加を記録しました。したがって、経済的不確実性は、予測期間中の航空貨物の需要に影響を与えると予想されます。
- eコマースと製造部門によって牽引され、倉庫と物流の在庫は2030年までに倍増し、7億平方フィートを超える可能性があります。同部門の賃貸活動は2022年第3四半期に前四半期比40%増加し、920万平方フィートに達しました。また、eコマースブームにより、2021年の主要 13か国における荷物の量は前年比21%増加しました。 2022年から2027年にかけて8.5%のCAGRで推移すると予想されています。 2021年に最も高い収益を上げたのは米国で、中国は1,080億個の小包を生み出しました。
- 2021年に開設されたバーレーンの世界海対空物流ハブのような物流ハブは、費用対効果が高く、より迅速な貨物輸送を提供できる可能性があります。倉庫保管をアップグレードおよび近代化するために、アジア太平洋の倉庫運営者の90%が次世代オートメーション技術に投資しており、今後5年間で世界的に市場が拡大すると予想されています。
世界の貨物および物流市場動向
北米の輸送および保管市場は、投資の促進により、2022年には21.35%、総額 6,426億米ドルに増加しました。
- アジア太平洋地域では、世界の海上貿易のかなりの部分を担う海運を中心に、輸送需要が増加しています。この地域には世界で最も利用客の多いコンテナ港が9つあり、世界の陸上貨物輸送の40%以上を占めています。 2050年までに、この地域の貨物輸送需要は3倍に増加すると予測されています。一方、ドイツは輸送および倉庫部門のリーダーとなり、フランスと英国を上回り、輸出入で世界第3位にランクされています。交通インフラを改善するため、ドイツ政府は2022年に連邦高速道路に120億ユーロ(128億1,000万米ドル)以上、水路に約18億1,000万米ドルを投資する予定です。
- 2022年の世界の海外直接投資(FDI)フローは24%減少し、総額1兆2,860億米ドルとなり、ルクセンブルクを除くと前年比5%減少しました。米国は依然として最大のFDI流入先であり、3,180億米ドルを受け入れ、次いで中国が1,800億米ドルであったが、水準は低かった。国境を越えた合併・買収(M&A)活動は取引件数の減少により減速したが、グリーンフィールド投資の見通しは引き続き明るいです。
- 北米の輸送と保管は、eコマースの倉庫および配送センターの需要の増加により、2021年の前年比14.31%から2022年の前年比21.35%へと大幅な成長を遂げました。この成長は輸送のさまざまな側面を網羅し、総額は6,426億米ドルに達しました。 2022年、米国運輸省は港湾インフラ開発プログラムを導入し、港湾の機能を改善し、サプライチェーンの信頼性を高め、雇用機会を創出するために、22の州の41のプロジェクトに7億300万米ドル以上を割り当てました。
1年以上にわたり、ロシアのウクライナ侵攻により、世界の原油および石油製品市場は混乱してきた
- 2022年の世界平均ガソリン価格は1リットル当たり1.22ドルで、前年比19%上昇し、新型コロナウイルス感染症以前の水準を超えました。景気回復の中での2021年の回復に続き、2022年の価格は戦争による供給途絶リスクによる原油上昇を受けて上昇しました。欧州のガソリン価格は他の地域に比べて最も高いです。アイスランド、ノルウェー、デンマーク、ギリシャ、フィンランド、オランダではガソリンが特に高く、1ガロンあたり7.6米ドルです。
- ブレント原油価格は2022年上半期に大幅に上昇したが、下半期には全般的に下落しました。ブレント原油のスポット価格は、2022年に1バレルあたり平均100米ドルでした。OPEC原油総生産量は、2022年第3四半期の日量平均2,920万バレルから、2022年第4四半期には日量2,860万バレルまで減少しました。2023年のOPEC原油生産量は、日量平均2,890万バレルと予想されています。世界の需要が記録的な水準に近い水準まで上昇し続けているにもかかわらず、ロシアとサウジアラビアが日量合計130万バレルの減産を続けているため、原油価格は昨年11月以来ピークに達しています。
- ディーゼルは原油から生産されるため、原油価格はディーゼル価格と密接に関係しています。世界のディーゼル供給に対する懸念から、米国および世界のディーゼル価格は2022年の春に急速に上昇しました。原油価格は2022年下半期に下落したが、米国のディーゼル先物価格は季節需要と欧州向けディーゼル供給懸念により2022年10月に再び上昇し、1ガロン当たり3.95米ドルとなった。ロシアは欧州最大のディーゼル供給国です。 2023年には、欧州がロシアから輸入するはずだったディーゼルの大部分を他の地域からの輸入に置き換えることができたため、欧州と米国の両方でディーゼル価格が下落しました。
貨物および物流業界の概要
貨物および物流市場は細分化されており、上位5社が8.53%を占めています。この市場の主要企業は、AP Moller-Maersk、CMA CGM、Deutsche Post DHL Group、FedEx、United Parcel Service(アルファベット順)です。
その他の特典
- エクセル形式の市場予測(ME)シート
- 3か月のアナリストサポート
目次
第1章 エグゼクティブサマリーと主要な調査結果
第2章 レポートの提供
第3章 イントロダクション
- 調査の前提条件と市場の定義
- 調査範囲
- 調査手法
第4章 主要な業界動向
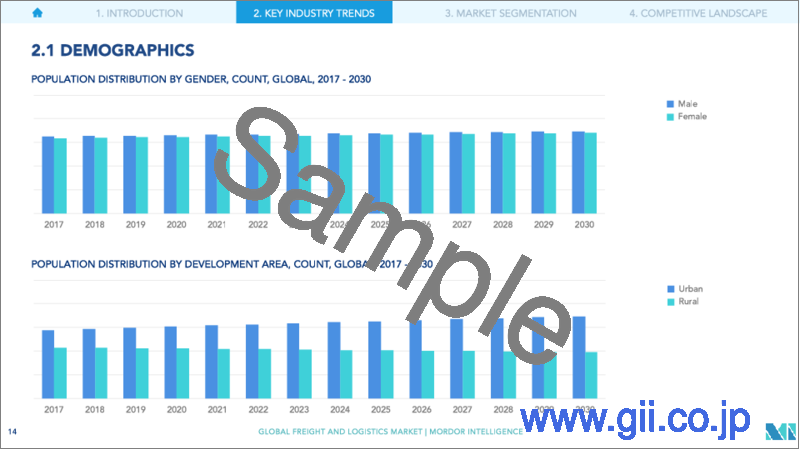
- 人口動態
- 経済活動別のGDP分布
- 経済活動別のGDP成長率
- インフレーション
- 経済的実績とプロファイル
- Eコマース業界の動向
- 製造業の動向
- 運輸・倉庫部門のGDP
- 輸出動向
- 輸入動向
- 燃料価格
- トラック輸送の運営コスト
- タイプ別のトラック輸送隊の規模
- 物流実績
- 主要トラックサプライヤー
- モーダルシェア
- 海上艦隊の耐荷重能力
- 定期船輸送の接続
- ポートコールとパフォーマンス
- 貨物価格の動向
- 貨物トン数の動向
- インフラストラクチャー
- 規制の枠組み(道路と鉄道)
- アルゼンチン
- オーストラリア
- ブラジル
- カナダ
- チリ
- 中国
- エジプト
- フランス
- ドイツ
- インド
- インドネシア
- イタリア
- 日本
- マレーシア
- メキシコ
- オランダ
- ナイジェリア
- 北欧人
- カタール
- ロシア
- サウジアラビア
- 南アフリカ
- スペイン
- タイ
- アラブ首長国連邦
- 英国
- 米国
- ベトナム
- 規制の枠組み(海と空)
- アルゼンチン
- オーストラリア
- ブラジル
- カナダ
- チリ
- 中国
- エジプト
- フランス
- ドイツ
- インド
- インドネシア
- イタリア
- 日本
- マレーシア
- メキシコ
- オランダ
- ナイジェリア
- 北欧人
- カタール
- ロシア
- サウジアラビア
- 南アフリカ
- スペイン
- タイ
- アラブ首長国連邦
- 英国
- 米国
- ベトナム
- バリューチェーンと流通チャネルの分析
第5章 市場セグメンテーション(1.すべてのセグメントの米ドルでの市場価値 2.一部のセグメントの市場規模、貨物輸送、CEP(宅配便、速達、および小包)、倉庫保管および保管 3. 2029年までの予測および分析成長の見通し)
- エンドユーザー業界
- 農業、漁業、林業
- 建設
- 製造業
- 石油・ガス、鉱業と採石業
- 卸売業と小売業
- その他
- 物流機能
- 宅配便、速達、小包
- 宛先タイプ別
- 国内
- 国際
- 貨物輸送
- 輸送手段別
- 航空
- 海と内陸水路
- その他
- 貨物輸送
- 輸送手段別
- 航空
- パイプライン
- 鉄道
- 道
- 海と内陸の水路
- 倉庫と保管
- 温度制御
- 非温度管理
- 温度管理
- その他のサービス
- 宅配便、速達、小包
- 地域
- アフリカ
- 国別
- エジプト
- ナイジェリア
- 南アフリカ
- その他
- アジア太平洋地域
- 国別
- オーストラリア
- 中国
- インド
- インドネシア
- 日本
- マレーシア
- タイ
- ベトナム
- その他
- 欧州
- 国別
- デンマーク
- フィンランド
- フランス
- ドイツ
- アイスランド
- イタリア
- オランダ
- ノルウェー
- ロシア
- スペイン
- スウェーデン
- 英国
- その他
- GCC
- 国別
- カタール
- サウジアラビア
- アラブ首長国連邦
- その他
- 北米
- 国別
- カナダ
- メキシコ
- 米国
- その他
- 南米
- 国別
- アルゼンチン
- ブラジル
- チリ
- その他南米
- 世界のその他の地域
- アフリカ
第6章 競合情勢
- 主要な戦略的動き
- 市場シェア分析
- 会社の情勢
- 企業プロファイル(世界レベルの概要、市場レベルの概要、中核事業セグメント、財務、従業員数、主要情報、市場ランク、市場シェア、製品とサービス、および最近の動向の分析を含む)。
- AP Moller-Maersk
- AllCargo Logistics Ltd
- Americold
- Aramex
- Bollore logistics
- CH Robinson
- CJ Logistics
- CMA CGM
- CTS Logistics Group
- Culina Group
- Dachser
- DB Schenker
- Deutsche Post DHL Group
- DP World
- DSV A/S(De Sammensluttede Vognmand af Air and Sea)
- Expeditors International
- FedEx
- GEODIS
- GXO Logistics
- Hellmann Worldwide Logistics
- Hub Group Inc
- International Distributions Services
- JBHunt Transport Services Inc.
- Japan Post Holdings Co., Ltd.
- JD Logistics
- Kerry Logistics
- Kintetsu World Express
- Kuehne+Nagel
- La Poste Group
- Landstar System Inc.
- LOGWIN
- LX International Corp
- Mainfreight
- NFI Industries
- Nippon Yusen Kabushiki Kaisha(NYK Line)
- Orient Overseas Container Line(OOCL Logistics)
- Penske Logistics
- Poste Italiane
- Ryder Systems
- Savino Del Bene
- SF Express
- Sinotrans Limited
- TIBA Group
- Total Quality Logistics
- Uber Technologies Inc
- United Parcel Service
- XPO Logistics
- Yamato Holdings
第7章 CEOへの主戦略的な質問
第8章 付録
- 世界の概要
- 出典と参考文献
- 表と図のリスト
- 主な洞察
- データパック
- 用語集
- 為替レート
目次
Product Code: 48024
The Freight and Logistics Market size is estimated at USD 6.03 trillion in 2024, and is expected to reach USD 7.54 trillion by 2029, growing at a CAGR of 4.57% during the forecast period (2024-2029).
Asia-pacific leading the investment in airport infrastructure worldwide followed by Europe and United States
- In 2020, China led global infrastructure spending, but by May 2022, Europe and the United States had taken the lead in terms of the most costly infrastructure projects currently in progress. As of 2021, the United States boasted the world's longest railway network, surpassing Russia, China, and India, spanning over 60,000 kilometers.
- In May 2022, India led the global count with the highest number of ongoing or planned infrastructure projects, amounting to USD 25 million. Comparatively, the United States had 1,866 projects, while China had 1,175 projects. The project of the High-Speed Rail Line in California, USA, was identified as one of the most valuable infrastructure endeavors worldwide, with an estimated worth of USD 113 billion as of October 2022. Railway lines constituted a significant portion of the major infrastructure projects under development, encompassing countries such as Norway, Sweden, the United Kingdom, the United States, various regions in Asia and Southeast Asia, as well as Japan.
- In March 2022, the Asia-Pacific region led in terms of the number of airport infrastructure projects being constructed, with a total of 230 projects encompassing various components like runways and terminals. The combined value of these projects amounted to USD 227.5 billion. Following closely behind, Europe had the second-highest number of airport infrastructure projects under construction, with 178 ongoing projects valued at USD 109 billion. However, when considering the overall expenditure on airport construction worldwide, North America slightly surpassed the other regions, with a total investment of USD 117.5 billion.
Strong potential amidst uncertainties
- Asia-Pacific, North America, and Europe dominate the global freight and logistics market, along with South America and GCC. While global trucking volumes witnessed an increase of 3.6% YoY in 2022, supply chain bottlenecks continue to impact road freight transportation. Owing to significant investments in Asia-Pacific and Europe, the global rail industry witnessed a growth of 1.6% and 4.1%, respectively, in 2020 and 2022. The rail industry is expected to record a CAGR of 3% through 2027. The Russia-Ukraine war and soaring inflation impacting global growth can affect global shipping, which accounts for 80% of global trade transport. The demand for global air cargo fell by 13.6% YoY in October 2022 but recorded a 3.5% MoM increase in the same month. Hence, economic uncertainties are expected to impact the demand for air cargo during the forecast period.
- Driven by the e-commerce and manufacturing sectors, warehousing and logistics stock will likely double by 2030 to cross 700 million square feet. Leasing activity in the segment grew by 40% QoQ in Q3 2022 to amount to 9.2 million square feet. The e-commerce boom also fueled parcel volumes by 21% YoY in 2021 in 13 major economies. It is expected to record a CAGR of 8.5% through 2022-2027. The United States generated the highest revenue, while China generated 108 billion parcels in 2021.
- Logistics hubs, like Bahrain's Global Sea-to-Air Logistics Hub, launched in 2021, could provide cost-effective and faster freight transportation. In order to upgrade and modernize warehousing, 90% of Asia-Pacific warehouse operators are investing in next-gen automation tech, which is anticipated to boost the market globally in the next five years.
Global Freight and Logistics Market Trends
The North American transportation and storage market increased to 21.35% in 2022, valued at USD 642.60 billion, with investment boost
- Asia Pacific is experiencing increased demand for transportation, especially in shipping, which handles a significant portion of global seaborne trade. This region boasts nine of the world's busiest container ports and accounts for more than 40% of global surface freight transport. By 2050, freight transport demand in the region is projected to triple. Meanwhile, Germany has become a leader in the transportation and warehousing sector, surpassing France and the United Kingdom, ranking third globally in imports and exports. To improve transportation infrastructure, the German government plans to invest over EUR 12 billion (USD 12.81 billion) in federal highways and about USD 1.81 billion in waterways in 2022.
- Global foreign direct investment (FDI) flows in 2022 fell by 24%, totaling USD 1,286 billion, or a 5% decrease when excluding Luxembourg, compared to the previous year. The United States remained the top destination for FDI inflows, receiving USD 318 billion, followed by China with USD 180 billion, although at lower levels. Cross-border merger and acquisition (M&A) activity slowed down with fewer deals, while the outlook for greenfield investment remained positive.
- Transportation and storage in North America saw a significant growth boost, rising from 14.31% YoY in 2021 to 21.35% YoY in 2022, driven by increased demand for e-commerce warehousing and distribution centers. This growth encompassed various transportation facets, reaching a total value of USD 642.60 billion. In 2022, the US Department of Transportation introduced the Port Infrastructure Development Program, allocating more than USD 703 million for 41 projects in 22 states to improve port capabilities, enhance supply chain reliability, and create job opportunities.
For over a year, Russia's invasion of Ukraine, has disrupted global crude oil and petroleum product markets
- In 2022, the global average price of gasoline at the pump was 1.22 USD per litre, a 19% increase from the previous year, exceeding pre-COVID-19 levels. Following the 2021 rebound amid economic recovery, 2022 prices hiked following crude oil increase as a result of supply disruption risk amid war. Gasoline prices in Europe are the highest compared to other regions. Gasoline is particularly expensive in Iceland, Norway, Denmark, Greece, Finland, and the Netherlands at 7.6 USD per gallon.
- The Brent crude oil price rose significantly in the first half of 2022 but generally declined in the second half of the year. The Brent crude oil spot price averaged USD 100 per barrel in 2022. Total OPEC crude oil production fell from an average of 29.2 million b/d in Q3 2022 to 28.6 million b/d in Q4 2022. In 2023, OPEC crude oil production is expected to average 28.9 million barrels per day. Oil prices have peaked since last November as Russia and Saudi Arabia continue to cut a total of 1.3 million barrels a day from their output, even as global demand continues to rise to near-record levels.
- Diesel is produced from crude oil, so crude oil prices are closely linked to diesel prices. Diesel prices in the United States and globally increased rapidly in the spring of 2022 because of concerns about global diesel supply. Although crude oil prices declined in the second half of 2022, United States diesel futures prices rose again in October 2022 to USD 3.95 per gallon due to seasonal demand and diesel supply concerns for Europe. Russia has been Europe's largest supplier of diesel. In 2023, diesel prices have declined in both Europe and the United States as Europe has been able to replace most of the diesel it would have imported from Russia with imports from other regions.
Freight and Logistics Industry Overview
The Freight and Logistics Market is fragmented, with the top five companies occupying 8.53%. The major players in this market are A.P. Moller - Maersk, CMA CGM, Deutsche Post DHL Group, FedEx and United Parcel Service (sorted alphabetically).
Additional Benefits:
- The market estimate (ME) sheet in Excel format
- 3 months of analyst support
TABLE OF CONTENTS
1 EXECUTIVE SUMMARY & KEY FINDINGS
2 REPORT OFFERS
3 INTRODUCTION
- 3.1 Study Assumptions & Market Definition
- 3.2 Scope of the Study
- 3.3 Research Methodology
4 KEY INDUSTRY TRENDS
- 4.1 Demographics
- 4.2 GDP Distribution By Economic Activity
- 4.3 GDP Growth By Economic Activity
- 4.4 Inflation
- 4.5 Economic Performance And Profile
- 4.5.1 Trends in E-Commerce Industry
- 4.5.2 Trends in Manufacturing Industry
- 4.6 Transport And Storage Sector GDP
- 4.7 Export Trends
- 4.8 Import Trends
- 4.9 Fuel Price
- 4.10 Trucking Operational Costs
- 4.11 Trucking Fleet Size By Type
- 4.12 Logistics Performance
- 4.13 Major Truck Suppliers
- 4.14 Modal Share
- 4.15 Maritime Fleet Load Carrying Capacity
- 4.16 Liner Shipping Connectivity
- 4.17 Port Calls And Performance
- 4.18 Freight Pricing Trends
- 4.19 Freight Tonnage Trends
- 4.20 Infrastructure
- 4.21 Regulatory Framework (Road and Rail)
- 4.21.1 Argentina
- 4.21.2 Australia
- 4.21.3 Brazil
- 4.21.4 Canada
- 4.21.5 Chile
- 4.21.6 China
- 4.21.7 Egypt
- 4.21.8 France
- 4.21.9 Germany
- 4.21.10 India
- 4.21.11 Indonesia
- 4.21.12 Italy
- 4.21.13 Japan
- 4.21.14 Malaysia
- 4.21.15 Mexico
- 4.21.16 Netherlands
- 4.21.17 Nigeria
- 4.21.18 Nordics
- 4.21.19 Qatar
- 4.21.20 Russia
- 4.21.21 Saudi Arabia
- 4.21.22 South Africa
- 4.21.23 Spain
- 4.21.24 Thailand
- 4.21.25 UAE
- 4.21.26 United Kingdom
- 4.21.27 United States
- 4.21.28 Vietnam
- 4.22 Regulatory Framework (Sea and Air)
- 4.22.1 Argentina
- 4.22.2 Australia
- 4.22.3 Brazil
- 4.22.4 Canada
- 4.22.5 Chile
- 4.22.6 China
- 4.22.7 Egypt
- 4.22.8 France
- 4.22.9 Germany
- 4.22.10 India
- 4.22.11 Indonesia
- 4.22.12 Italy
- 4.22.13 Japan
- 4.22.14 Malaysia
- 4.22.15 Mexico
- 4.22.16 Netherlands
- 4.22.17 Nigeria
- 4.22.18 Nordics
- 4.22.19 Qatar
- 4.22.20 Russia
- 4.22.21 Saudi Arabia
- 4.22.22 South Africa
- 4.22.23 Spain
- 4.22.24 Thailand
- 4.22.25 UAE
- 4.22.26 United Kingdom
- 4.22.27 United States
- 4.22.28 Vietnam
- 4.23 Value Chain & Distribution Channel Analysis
5 MARKET SEGMENTATION (includes 1. Market value in USD for all segments 2. Market volume for select segments viz. freight transport, CEP (courier, express, and parcel) and warehousing & storage 3.Forecasts up to 2029 and analysis of growth prospects)
- 5.1 End User Industry
- 5.1.1 Agriculture, Fishing and Forestry
- 5.1.2 Construction
- 5.1.3 Manufacturing
- 5.1.4 Oil and Gas, Mining and Quarrying
- 5.1.5 Wholesale and Retail Trade
- 5.1.6 Others
- 5.2 Logistics Function
- 5.2.1 Courier, Express and Parcel
- 5.2.1.1 By Destination Type
- 5.2.1.1.1 Domestic
- 5.2.1.1.2 International
- 5.2.2 Freight Forwarding
- 5.2.2.1 By Mode Of Transport
- 5.2.2.1.1 Air
- 5.2.2.1.2 Sea and Inland Waterways
- 5.2.2.1.3 Others
- 5.2.3 Freight Transport
- 5.2.3.1 By Mode Of Transport
- 5.2.3.1.1 Air
- 5.2.3.1.2 Pipelines
- 5.2.3.1.3 Rail
- 5.2.3.1.4 Road
- 5.2.3.1.5 Sea and Inland Waterways
- 5.2.4 Warehousing and Storage
- 5.2.4.1 By Temperature Control
- 5.2.4.1.1 Non-Temperature Controlled
- 5.2.4.1.2 Temperature Controlled
- 5.2.5 Other Services
- 5.2.1 Courier, Express and Parcel
- 5.3 Region
- 5.3.1 Africa
- 5.3.1.1 By Country
- 5.3.1.1.1 Egypt
- 5.3.1.1.2 Nigeria
- 5.3.1.1.3 South Africa
- 5.3.1.1.4 Rest of Africa
- 5.3.2 Asia Pacific
- 5.3.2.1 By Country
- 5.3.2.1.1 Australia
- 5.3.2.1.2 China
- 5.3.2.1.3 India
- 5.3.2.1.4 Indonesia
- 5.3.2.1.5 Japan
- 5.3.2.1.6 Malaysia
- 5.3.2.1.7 Thailand
- 5.3.2.1.8 Vietnam
- 5.3.2.1.9 Rest of Asia Pacific
- 5.3.3 Europe
- 5.3.3.1 By Country
- 5.3.3.1.1 Denmark
- 5.3.3.1.2 Finland
- 5.3.3.1.3 France
- 5.3.3.1.4 Germany
- 5.3.3.1.5 Iceland
- 5.3.3.1.6 Italy
- 5.3.3.1.7 Netherlands
- 5.3.3.1.8 Norway
- 5.3.3.1.9 Russia
- 5.3.3.1.10 Spain
- 5.3.3.1.11 Sweden
- 5.3.3.1.12 United Kingdom
- 5.3.3.1.13 Rest of Europe
- 5.3.4 GCC
- 5.3.4.1 By Country
- 5.3.4.1.1 Qatar
- 5.3.4.1.2 Saudi Arabia
- 5.3.4.1.3 UAE
- 5.3.4.1.4 Rest of GCC
- 5.3.5 North America
- 5.3.5.1 By Country
- 5.3.5.1.1 Canada
- 5.3.5.1.2 Mexico
- 5.3.5.1.3 United States
- 5.3.5.1.4 Rest of North America
- 5.3.6 South America
- 5.3.6.1 By Country
- 5.3.6.1.1 Argentina
- 5.3.6.1.2 Brazil
- 5.3.6.1.3 Chile
- 5.3.6.1.4 Rest of South America
- 5.3.7 Rest of the World
- 5.3.1 Africa
6 COMPETITIVE LANDSCAPE
- 6.1 Key Strategic Moves
- 6.2 Market Share Analysis
- 6.3 Company Landscape
- 6.4 Company Profiles (includes Global Level Overview, Market Level Overview, Core Business Segments, Financials, Headcount, Key Information, Market Rank, Market Share, Products and Services, and Analysis of Recent Developments).
- 6.4.1 A.P. Moller - Maersk
- 6.4.2 AllCargo Logistics Ltd
- 6.4.3 Americold
- 6.4.4 Aramex
- 6.4.5 Bollore logistics
- 6.4.6 C.H Robinson
- 6.4.7 CJ Logistics
- 6.4.8 CMA CGM
- 6.4.9 CTS Logistics Group
- 6.4.10 Culina Group
- 6.4.11 Dachser
- 6.4.12 DB Schenker
- 6.4.13 Deutsche Post DHL Group
- 6.4.14 DP World
- 6.4.15 DSV A/S (De Sammensluttede Vognmand af Air and Sea)
- 6.4.16 Expeditors International
- 6.4.17 FedEx
- 6.4.18 GEODIS
- 6.4.19 GXO Logistics
- 6.4.20 Hellmann Worldwide Logistics
- 6.4.21 Hub Group Inc
- 6.4.22 International Distributions Services
- 6.4.23 J.B.Hunt Transport Services Inc.
- 6.4.24 Japan Post Holdings Co., Ltd.
- 6.4.25 JD Logistics
- 6.4.26 Kerry Logistics
- 6.4.27 Kintetsu World Express
- 6.4.28 Kuehne + Nagel
- 6.4.29 La Poste Group
- 6.4.30 Landstar System Inc.
- 6.4.31 LOGWIN
- 6.4.32 LX International Corp
- 6.4.33 Mainfreight
- 6.4.34 NFI Industries
- 6.4.35 Nippon Yusen Kabushiki Kaisha (NYK Line)
- 6.4.36 Orient Overseas Container Line (OOCL Logistics)
- 6.4.37 Penske Logistics
- 6.4.38 Poste Italiane
- 6.4.39 Ryder Systems
- 6.4.40 Savino Del Bene
- 6.4.41 SF Express
- 6.4.42 Sinotrans Limited
- 6.4.43 TIBA Group
- 6.4.44 Total Quality Logistics
- 6.4.45 Uber Technologies Inc
- 6.4.46 United Parcel Service
- 6.4.47 XPO Logistics
- 6.4.48 Yamato Holdings
7 KEY STRATEGIC QUESTIONS FOR FREIGHT AND LOGISTICS CEOS
8 APPENDIX
- 8.1 Global Overview
- 8.1.1 Overview
- 8.1.2 Porter's Five Forces Framework
- 8.1.3 Global Value Chain Analysis
- 8.1.4 Market Dynamics (Market Drivers, Restraints & Opportunities)
- 8.1.5 Technological Advancements
- 8.2 Sources & References
- 8.3 List of Tables & Figures
- 8.4 Primary Insights
- 8.5 Data Pack
- 8.6 Glossary of Terms
- 8.7 Currency Exchange Rate

