
|
市場調査レポート
商品コード
1911801
ペット用トリーツ:市場シェア分析、業界動向と統計、成長予測(2026年~2031年)Pet Treats - Market Share Analysis, Industry Trends & Statistics, Growth Forecasts (2026 - 2031) |
||||||
カスタマイズ可能
適宜更新あり
|
|||||||
| ペット用トリーツ:市場シェア分析、業界動向と統計、成長予測(2026年~2031年) |
|
出版日: 2026年01月12日
発行: Mordor Intelligence
ページ情報: 英文 120 Pages
納期: 2~3営業日
|

概要
ペット用トリーツ市場の規模は、2026年には327億9,000万米ドルと推定されており、2025年の306億9,000万米ドルから成長が見込まれます。
2031年までの予測では456億9,000万米ドルに達し、2026年から2031年にかけてCAGR6.85%で成長すると見込まれています。
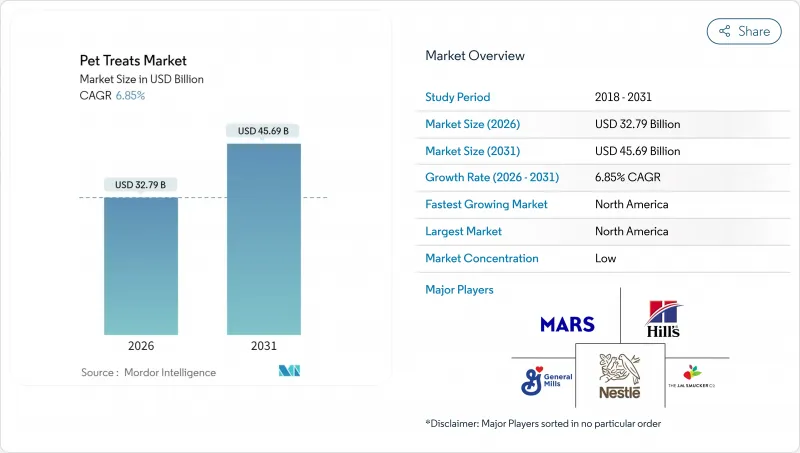
この堅調な成長は、コンパニオンアニマルの人間化が進んでいること、機能性栄養への持続的な需要、そして飼い主が愛玩動物へのご褒美という習慣に抱く感情的な愛着が、自由裁量支出が厳しい状況下でも持続していることに起因しています。より広範なペットケア経済の中で、ペット用トリーツ市場は必須の健康製品と手頃な価格の贅沢品というユニークな組み合わせを特徴としており、他の分野で価格弾力性が高まっているにもかかわらず、メーカーが販売量を維持することを可能にしております。歯の健康、単一原料タンパク質、腸内環境改善添加物を主軸としたプレミアム位置付けのトリーツが競合上の差別化の基調を確立する一方、デジタル定期購入サービスは生涯価値を高め、データに基づく配合のパーソナライゼーションを可能にしております。
世界のペット用トリーツ市場の動向と洞察
ペットの人間化とご褒美のプレミアム化
ペットオーナーは伴侶動物を家族の一員として扱う傾向が強まり、プレミアム食品動向を反映した人間用グレードの原料や職人技による配合への需要を牽引しています。この行動変容により、トリーツは単なるご褒美から健康投資へと変貌し、オーナーは有機認証、単一原料タンパク質、透明性のあるサプライチェーンに対してプレミアム価格を支払う意思を示しています。ゼネラルミルズ社が2024年11月にホワイトブリッジ・ペットブランド社を14億5,000万米ドルで買収した背景には、プレミアム猫用フード・トリーツ分野を特に狙い、米国ペットフード市場全体520億米ドルのうち、同分野の小売価値が240億米ドルに達することを認識したことがあります。この人間化動向は、原料の産地や製造プロセスの透明性を効果的に伝えるブランドに、持続可能な競争優位性をもたらします。
伴侶動物における歯科健康への注目の加速
獣医療専門家による予防策としての日常的なデンタルケア用ガムの推奨が増加し、口腔衛生用トリーツは単発購入品から日常的な健康管理の一部へと変容しています。この臨床的推奨により、景気後退の影響を受けにくい安定した需要パターンが形成され、飼い主様は任意購入品よりも獣医師推奨製品を優先される傾向にあります。獣医口腔保健評議会(VOHC)の認証マークは重要な差別化要素となっており、VOHC認証製品はプレミアム価格設定と専門小売チャネルでの優先的な棚配置を実現しています。米国飼料管理官協会(AAFCO)などが確立した規制枠組みは、獣医師の推奨を支え、歯科専用トリーツの配合に対する消費者の信頼を育む栄養的適正基準を提供しています。
主要動物性タンパク原料の価格上昇
家禽、牛肉、魚類タンパク質のコスト上昇は、全トリーツカテゴリーにわたり利益率の圧迫要因となっており、メーカーは価格改定と配合変更戦略の難しい選択を迫られています。タンパク質原料はトリーツ製造コストの40~60%を占めるため、原料価格の変動は収益性に重大な影響を与え、投資判断や生産能力拡張計画にも波及します。欧州市場では、2023年にドイツでペットカテゴリーが14.8%、英国で12.1%の価格上昇を記録し、消費者はプライベートブランド製品やコストパフォーマンス重視の製品へと移行する動きが見られました。
セグメント分析
2025年時点で、クランチートリートは22.85%のシェアを維持し市場をリードしております。これは確立された消費者の嗜好と、あらゆる小売チャネルで競争力のある価格設定を可能にする製造コスト面での優位性によるものです。特に若いペットのしつけやご褒美用途における汎用性から、ペットオーナーの間で大きな支持を得ております。カリカリ系トリーツセグメントでは犬用が最大のシェアを占め、消費量の約54%を占めております。次いで猫用、その他の動物用が続いており、様々なペットカテゴリーに広く支持されていることがわかります。また、専門店やスーパーマーケット/ハイパーマーケットといった主要流通チャネルが、消費者に利便性と幅広い商品提供を実現していることも、本セグメントの成長を支える要因となっております。
ソフト&チューイートリーツは、機能性成分の配合能力に優れ、嗜好性の高さからプレミアムポジションを確立できる利点により、2031年までCAGR7.98%と最も高い成長率を示すセグメントとして浮上しています。ソフトで噛み応えのあるトリーツは、特定の嗜好や歯の敏感さを持つペットに好まれる異なる食感特性を提供し、特に猫の飼い主様に人気が高まっています。これらのセグメントは、舐められるトリーツ、ケーキ、キャットニップ、ミネラルブロックなど、多様なペットの嗜好や機能的ニーズに応える様々な他のトリーツタイプによって補完されています。各セグメントは、異なるペットの年齢、サイズ、健康要件に特化したソリューションを提供することで、市場の多様性に貢献しています。
ペット用トリーツ市場レポートは、サブ製品別(クランチートリート、デンタルトリート、フリーズドライ・ジャーキートリートなど)、ペット別(猫、犬など)、流通チャネル別(コンビニエンスストア、オンラインチャネル、専門店など)、地域別(アフリカ、アジア太平洋、欧州、北米など)にセグメント化されています。市場予測は、金額(米ドル)および数量(メトリックトン)で提供されます。
地域別分析
北米は最大の地域市場としての地位を維持し、2025年には39.35%のシェアを占め、2031年までCAGR7.58%で成長が見込まれます。これは、70%以上の世帯がペットを飼育する成熟したペット飼育パターンと、ペット飼育世帯あたりの年間平均支出額が938米ドルに達していることに支えられています。同地域の成長軌跡は、プレミアム化動向と機能性成分の採用を反映しており、獣医師推奨のデンタルケア用トリーツや定期購入型配送モデルが、経済変動に耐性のある安定した需要パターンを牽引しています。
アジア太平洋地域は最も急速な成長を遂げており、中国のペット飼育拡大と、高度なサブスクリプションモデルや個別栄養サービスを可能にする韓国の先進的な電子商取引インフラが牽引しています。インドのペットフード市場は、都市部人口の増加と可処分所得の上昇により特に有望です。文化的嗜好と価格感応度の高さから、地域に適した製品の開発と流通が求められています。
欧州では、持続可能性と有機認証への強い重視が特徴的な需要パターンを示し、アップサイクル原料やカーボンニュートラル包装ソリューションの革新を推進。これらは世界の業界基準を形成しています。欧州ペットフード産業連盟(FEDIAF)ガイドラインに基づく規制枠組みは、確立された企業に有利なコンプライアンス要件を創出すると同時に、製品の安全性と品質基準を確保し、プレミアムポジショニングを支えています。
その他の特典:
- エクセル形式の市場予測(ME)シート
- アナリストによる3ヶ月間のサポート
よくあるご質問
目次
第1章 イントロダクション
- 調査の前提条件と市場の定義
- 調査範囲
- 調査手法
第2章 エグゼクティブサマリー主要な調査結果
第3章 レポート提供
第4章 主要業界動向
- ペットの飼育数
- 猫
- 犬
- その他のペット
- ペット関連支出
- 消費者の動向
第5章 供給と生産の動向
- 貿易分析
- 原料動向
- バリューチェーン及び流通チャネル分析
- 規制の枠組み
- 市場促進要因
- ペットの人間化とペット用トリーツのプレミアム化
- 伴侶動物における歯科健康への注目の加速
- トリーツ向けDTC定期購入モデルの拡大
- プロバイオティクスとCBD配合の機能性トリーツ
- 肉製品別の持続可能なペット用トリーツへのアップサイクリング
- AIを活用したパーソナライズドトリーツ処方
- 市場抑制要因
- 主要な動物性タンパク質原料の価格上昇
- 新規機能性原料に対する規制当局の監視強化
- ESGを意識した小売業者からのカーボン・ラベリング圧力
- 手作りトリーツコミュニティからの競合激化
第6章 市場規模と成長予測(金額および数量)
- サブプロダクト
- クランチートリーツ
- デンタルトリーツ
- フリーズドライおよびジャーキーのトリーツ
- ソフトおよびチューイートリーツ
- その他のトリーツ
- ペット
- 猫
- 犬
- その他のペット
- 流通チャネル
- コンビニエンスストア
- オンラインチャネル
- 専門店
- スーパーマーケット/ハイパーマーケット
- その他のチャネル
- 地域
- アフリカ
- 国別
- 南アフリカ
- その他アフリカ
- 国別
- アジア太平洋地域
- 国別
- オーストラリア
- 中国
- インド
- インドネシア
- 日本
- マレーシア
- フィリピン
- 台湾
- タイ
- ベトナム
- その他アジア太平洋地域
- 国別
- 欧州
- 国別
- フランス
- ドイツ
- イタリア
- オランダ
- ポーランド
- ロシア
- スペイン
- 英国
- その他欧州地域
- 国別
- 北米
- 国別
- カナダ
- メキシコ
- 米国
- その他北米地域
- 国別
- 南米
- 国別
- アルゼンチン
- ブラジル
- その他南米
- 国別
- アフリカ
第7章 競合情勢
- 主要な戦略的動きs
- 市場シェア分析
- Brand Positioning Matrix
- Market Claim Analysis
- 企業概要
- 企業プロファイル
- Mars, Incorporated
- Nestle(Purina)
- Colgate-Palmolive Company(Hill's Pet Nutrition, Inc.)
- General Mills Inc.
- Schell & Kampeter, Inc.(Diamond Pet Foods)
- PLB International
- Clearlake Capital Group, L.P.(Wellness Pet Company, Inc.)
- Alltech
- Heristo aktiengesellschaft
- Affinity Petcare S.A
- Natural Balance
- Rayne Nutrition
- Unicharm
- Champion Petfoods
- Farmina Pet Foods

