
|
市場調査レポート
商品コード
1692030
大豆タンパク-市場シェア分析、産業動向・統計、成長予測(2025年~2030年)Soy Protein - Market Share Analysis, Industry Trends & Statistics, Growth Forecasts (2025 - 2030) |
||||||
カスタマイズ可能
適宜更新あり
|
|||||||
| 大豆タンパク-市場シェア分析、産業動向・統計、成長予測(2025年~2030年) |
|
出版日: 2025年03月18日
発行: Mordor Intelligence
ページ情報: 英文 397 Pages
納期: 2~3営業日
|

全表示
- 概要
- 目次
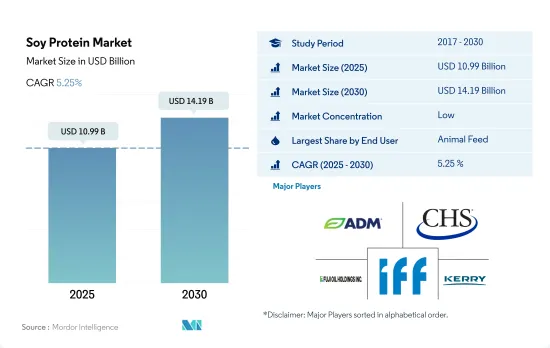
大豆タンパクの市場規模は2025年に109億9,000万米ドルと推定され、2030年には141億9,000万米ドルに達すると予測され、予測期間(2025年~2030年)のCAGRは5.25%で成長します。
消化しやすいという大豆タンパクの適性が、主に動物飼料分野での優位性につながりました。
- 動物飼料における大豆タンパク原料の使用量は、食品・飲料における使用量をわずかに上回っています。大豆タンパクは主に濃縮物の形で、動物、鳥類、魚類の飼料に広く使用されています。消化しやすさ、保存性の向上、タンパク質の濃縮といった大豆タンパクの主な特性が、食品・飲料分野での利用を後押ししています。2022年には、動物用飼料セグメントは濃縮飼料に大きく牽引され、大豆タンパクニーズの約53.27%に対応しました。
- 食品・飲料は大豆タンパクのもう一つの重要な用途分野であり、主に食肉/食肉代替物分野です。これは、まっすぐな繊維状に積み重ねたときに筋肉の食感を模倣する多機能性によるもので、その結果、食肉代替品における食感とタンパク質強化のための利用が改善されます。2023年には、代用肉サブセグメントは食品・飲料セグメントにおける大豆たん白売上高全体の約43.70%を占めました。
- 米国、英国、ドイツなどの新興経済諸国におけるフィットネス愛好者の増加に起因しています。同分野の成長はまた、ベビーフードや乳児用調製粉乳に大豆タンパクが受け入れられつつあり、調査研究が進んでいることにも起因しています。EFSA(欧州食品安全機関)は、乳児用調製粉乳の必須組成の見直しの中で、分離大豆タンパクは乳児用調製粉乳に使用するのに安全で適切なタンパク質源であるとしています。2022年7月、ダノンは乳製品と植物をブレンドした新しいベビー用ミルクを発売しました。
北米とアジア太平洋における費用対効果の高いタンパク質製品に対する需要の増加
- 北米は大豆たん白市場の大半を占め、その用途の大半は食品・飲料分野です。肉と乳製品の代替品が需要を牽引し、2022年には44%の数量シェアを占めました。この成長は、特に米国とカナダで植物性製品に対する需要が増加していることに起因しており、米国とカナダでは2021年に合わせて約1,000万人の菜食主義者がいた。大豆の最大生産国である米国は、地域の大豆タンパク需要に広く貢献しています。2021年の大豆生産量は過去最高の44億4,000万ブッシェルで、2020年から5%増加しました。
- 北米に続くのはアジア太平洋です。中国がこの地域最大の大豆たん白消費国であることに変わりはないが、これは生産能力の高さが原料価格を引き下げ、大量消費を後押ししているためです。多くの植物性食品の主原料である分離大豆たん白の世界供給の約70%は、中国の山東省で加工されています。この要因もまた、植物ベースの分野における絶大なイノベーションを可能にし、差別化された製品提供を試そうとする消費者を引き付けています。この地域は、予測期間中に金額ベースで5.67%のCAGRで推移すると予測されます。
- 南米は、健康志向の高まりから天然素材や持続可能な素材への需要が急速に高まっており、最も急成長する市場と予測されます。同地域の予測期間中のCAGRは金額ベースで6.0%を記録するとみられます。ここ数年、集約的農業システムにおける環境へのダメージや動物に対する非倫理的な扱いに対する懸念が消費者の間で高まり、持続可能なタンパク質に対する需要の高まりにつながっています。このような要因から、南米のほとんどの国では植物性タンパク質に対する需要が高まっています。
世界の大豆タンパク市場動向
植物性タンパク質をベースとした食事にはいくつかの健康上の利点があるため、顧客はビーガン向けの製品に移行しています。
- 世界的に、消費者の食生活の嗜好は変化しています。特に欧州と北米の消費者の間で、乳製品と肉の代替品への嗜好が高まっています。2022年には、植物由来の牛乳が植物由来の食品売上全体の38%を占め、欧州がリードし、植物由来の肉が僅差でこれに続きます。この進化する動向は、フレキシタリアンやビーガンの消費者の数を押し上げ、メーカーが植物性タンパク質分野でイノベーションを起こすための扉を開いています。
- 植物性タンパク質代替食品の人気は、その栄養価によるもので、環境への影響、倫理、健康に対する懸念の高まりに起因します。炭水化物に比べて消化が遅いことで知られるタンパク質は、少ないカロリーで満腹感を長時間持続させることで、体重管理に重要な役割を果たしています。新たな研究によると、2022年から2023年にかけて、世界で10億人以上が肥満とともに暮らしていることが明らかになりました。
- さらに、若年層のスポーツやフィットネス活動への関与の高まりと、健康上の利点を付加するために機能性成分で食品・飲料を強化する傾向の高まりが、植物性タンパク質の需要を促進しています。2023年には、6歳以上の米国人(人口の約80%)が少なくとも1つのスポーツやフィットネス活動に参加し、過去最高の2億4,200万人に達し、2022年から2.2%増加しました。このアクティブなライフスタイルの変化が、植物性タンパク質食品の需要を牽引しています。さらに、カナダの保健省が食品ガイドを刷新し、野菜と果物、全粒穀物、植物性タンパク質という3つの主要カテゴリーを強調するなど、政府の取り組みが消費者の代替タンパク質に対する認識と需要を促進しています。
世界の大豆生産は、特定の国における理想的な生育条件に後押しされて急増しています。
- 生産動向の変動にかかわらず、大豆タンパクの基本原料である大豆は、そのほとんどがブラジルで生産され、米国、アルゼンチンの順で生産されています。2018年には、世界で3億4,900万トンの大豆が生産されました。ブラジルが1億1,800万トン(34%)を生産したのに対し、米国は1億2,300万トン(35%)。これらは世界の総生産量の69%を占めました。2012年は、中西部の大部分で夏に歴史的な干ばつに見舞われたため、大豆の生産量が大幅に減少しました。しかし、2020年には生産量が5%増加しました。
- 世界的には、インドも大豆の主要生産国です。インドの2021-22年収穫期の大豆生産量は1,120万トンで、前年の1,045万トンから増加しました。主な栽培州での洪水による作物被害により、大豆、大豆油、油粕ビジネスに携わる企業・政府機関ともに、インドの大豆生産高は2019-2020年も低水準にとどまると予想していました。州別では、マディヤ・プラデシュ州が55.84haでトップ、次いでマハラシュトラ州(46.01ha)、ラジャスタン州(10.62ha)、カルナータカ州(3.82ha)、グジャラート州(2.24ha)、テランガナ州(1.51ha)と続きます。
- 2021年には、世界中で生産された大豆の75%以上が、肉や乳製品の生産のために家畜に与えられていました。残りの大部分は植物油、産業、バイオ燃料です。豆腐、豆乳、枝豆、テンペなど、人間が消費する製品を作るために特別に使用される大豆はわずか7%です。
大豆タンパク業界の概要
大豆タンパク市場は断片化されており、上位5社で28.75%を占めています。この市場の主要企業は以下の通り。 Archer Daniels Midland Company, CHS Inc., Fuji Oil Group, International Flavors & Fragrances Inc. and Kerry Group PLC(sorted alphabetically).
その他の特典
- エクセル形式の市場予測(ME)シート
- 3ヶ月のアナリストサポート
目次
第1章 エグゼクティブサマリーと主な調査結果
第2章 イントロダクション
- 調査の前提条件と市場定義
- 調査範囲
- 調査手法
第3章 主要産業動向
- エンドユーザー市場規模
- ベビーフードおよび乳児用調製粉乳
- ベーカリー
- 飲料
- 朝食用シリアル
- 調味料/ソース
- 菓子類
- 乳製品および乳製品代替製品
- 高齢者栄養・医療栄養
- 肉・鶏肉・魚介類および肉代替製品
- RTE/RTC食品
- スナック
- スポーツ/パフォーマンス栄養
- 動物飼料
- パーソナルケアと化粧品
- タンパク質消費動向
- 植物
- 生産動向
- 植物
- 規制の枠組み
- オーストラリア
- カナダ
- 中国
- フランス
- ドイツ
- インド
- イタリア
- 日本
- 英国
- 米国
- バリューチェーンと流通チャネル分析
第4章 市場セグメンテーション
- 形態
- 濃縮物
- 単離液
- テクスチャー/加水分解
- エンドユーザー
- 飼料
- 食品・飲料
- サブエンドユーザー別
- ベーカリー
- 飲料
- 朝食用シリアル
- 調味料/ソース
- 乳製品・乳製品代替品
- 肉・鶏肉・魚介類および肉代替製品
- RTE/RTC食品
- スナック
- サプリメント
- サブエンドユーザー別
- ベビーフードおよび乳児用調製粉乳
- 高齢者栄養および医療栄養
- スポーツ/パフォーマンス栄養
- 地域別
- アフリカ
- 形態別
- エンドユーザー別
- 国別
- ナイジェリア
- 南アフリカ
- その他のアフリカ
- アジア太平洋
- 形態別
- エンドユーザー別
- 国別
- オーストラリア
- 中国
- インド
- インドネシア
- 日本
- マレーシア
- ニュージーランド
- 韓国
- タイ
- ベトナム
- その他のアジア太平洋
- 欧州
- 形態別
- エンドユーザー別
- 国別
- ベルギー
- フランス
- ドイツ
- イタリア
- オランダ
- ロシア
- スペイン
- トルコ
- 英国
- その他の欧州
- 中東
- 形態別
- エンドユーザー別
- 国別
- イラン
- サウジアラビア
- アラブ首長国連邦
- その他の中東
- 北米
- 形態別
- エンドユーザー別
- 国別
- カナダ
- メキシコ
- 米国
- その他の北米
- 南米
- 形態別
- エンドユーザー別
- 国別
- アルゼンチン
- ブラジル
- その他の南米
- アフリカ
第5章 競合情勢
- 主要な戦略動向
- 市場シェア分析
- 企業情勢
- 企業プロファイル.
- A. Costantino & C. SpA
- Archer Daniels Midland Company
- Bunge Limited
- CHS Inc.
- Fuji Oil Group
- International Flavors & Fragrances Inc.
- Kerry Group PLC
- Wilmar International Ltd
第6章 CEOへの主な戦略的質問
第7章 付録
- 世界概要
- 概要
- ファイブフォース分析フレームワーク
- 世界のバリューチェーン分析
- 市場力学(DROs)
- 情報源と参考文献
- 図表一覧
- 主要洞察
- データパック
- 用語集
The Soy Protein Market size is estimated at 10.99 billion USD in 2025, and is expected to reach 14.19 billion USD by 2030, growing at a CAGR of 5.25% during the forecast period (2025-2030).
The suitability of soy protein due to its easier digestibility factor led to its dominance, mainly in the animal feed segment
- The usage of soy protein ingredients in animal feed marginally surpasses its usage in food and beverages. Soy protein, mainly in the form of concentrates, is widely used in the diets of animals, birds, and fish. Its main characteristics, such as easy digestibility, improved shelf life, and protein enrichment, are driving its application in the food and beverage segment. In 2022, the animal feed segment was largely driven by concentrates that addressed about 53.27% of soy protein needs.
- Food and beverage is another crucial application segment for soy protein, mainly in the meat/meat alternative subsegment. This is attributed to its multifunctionalities that mimic muscle texture when stacked in straight fibers, thus improving its use for texture and protein enrichment in meat alternatives. In 2023, the meat alternatives subsegment accounted for about 43.70% of the total soy protein sales in the food and beverage segment.
- In terms of growth, supplements remained the fastest-growing segment, with a projected CAGR of 6.31% by value during the forecast period, attributed to the growing number of fitness enthusiasts in developed economies like the United States, the United Kingdom, and Germany. The segment's growth can also be attributed to the increasing acceptance of soy protein in baby food and infant formula with the support of research studies. The EFSA (European Food Safety Authority), in its review of the essential composition of infant and follow-on formulae, states that isolated soy protein is a safe and suitable protein source for use in infant and follow-on formulae. In July 2022, Danone launched the new dairy and plant blend baby formula, in which 60% plant protein is sourced from high-quality/non-GMO soy protein.
Increasing demand for cost-effective protein products in North America and Asia-Pacific
- North America dominated the soy protein market, with most of its applications in the food and beverages segment. Meat and dairy alternatives led the demand, holding a volume share of 44% in 2022. This growth can be attributed to the increasing demand for plant-based products, especially in the United States and Canada, which had a combined vegan population of about 10 million in 2021. Being among the largest producers of soybeans, the United States widely contributes to the regional soy protein demand. In 2021, soybean production totaled a record-high 4.44 billion bushels, up by 5% from 2020.
- North America is followed by the Asia-Pacific region. China remained the largest consumer of soy protein in the region, attributed to high production capacity that reduces the ingredient's price and boosts volume consumption. About 70% of the world's supply of soy protein isolates, a primary ingredient in many plant-based foods, is processed in the Shandong province in China. This factor also enables immense innovation in the plant-based space, attracting more consumers to try the differentiated product offerings. The region is projected to record a CAGR of 5.67% by value during the forecast period.
- South America is projected to be the fastest-growing market as the demand for natural and sustainable ingredients is rapidly increasing due to rising health consciousness. The region is set to record a CAGR of 6.0% by value over the forecast period. Over the last few years, concerns about damage to the environment and unethical treatment of animals in intensive farming systems have increased among consumers, leading to increased demand for sustainable protein. This factor has led to the rising demand for plant proteins in most South American countries.
Global Soy Protein Market Trends
Due to several health benefits of plant protein-based diets, customers are moving toward vegan offerings
- Globally, consumers are shifting their dietary preferences. Notably, there is a growing preference for dairy and meat alternatives, especially among consumers in Europe and North America. In 2022, Europe led the way with plant-based milk accounting for 38% of total plant-based food sales, followed closely by plant-based meat. This evolving trend is boosting the number of flexitarian and vegan consumers and opening doors for manufacturers to innovate within the plant protein sector.
- The popularity of plant-based protein alternatives is due to their nutritional value and stems from growing concerns over environmental impact, ethics, and health. Proteins, known for their slower digestion compared to carbohydrates, play a crucial role in weight management by promoting a longer-lasting feeling of fullness with fewer calories. A new study reveals that over one billion people globally were living with obesity between 2022 and 2023.
- Moreover, the rising engagement of the younger population in sports and fitness activities, coupled with a growing trend of fortifying food and beverages with functional ingredients for added health benefits, is fueling the demand for plant-based proteins. In 2023, a record-high 242 million Americans aged 6 and older (nearly 80% of the population) participated in at least one sport or fitness activity, a 2.2% increase from 2022. This active lifestyle shift is driving the demand for plant-based protein food products. Furthermore, government initiatives, such as Canada's Health Ministry, which revamped its food guide, emphasizing three key categories: vegetables and fruits, whole grains, and plant-based proteins, are driving awareness and demand for alternative proteins among consumers.
Global soy production is surging, propelled by ideal growing conditions in specific countries
- Regardless of fluctuating production trends, soybeans, the fundamental raw material for soy proteins, are mostly produced in Brazil and closely followed by the United States and then Argentina. In 2018, 349 million tons of soy were produced worldwide. Brazil produced 118 million tons (34%), whereas the United States produced 123 million tons (35%) of the total. They made up 69% of the world's total production. A substantial reduction in soybean output was seen in 2012 due to the historic drought conditions in most of the Midwest over the summer. However, the output increased by 5% in 2020.
- Globally, India is another major producer of soybeans. India's soybean output for the harvesting season 2021-22 was 11.200 million tons, which rose from 10.450 million tons in the previous year. Due to flood-induced crop damage in major growing states, both corporate and government institutions involved in the soybean, soya oil, and oil meal business expected India's soybean output to stay lower in 2019-2020. Among the states, Madhya Pradesh is the top producer with 55.84 lakh ha, followed by Maharashtra (46.01 lakh ha), Rajasthan (10.62 lakh ha), Karnataka (3.82 lakh ha), Gujarat (2.24 lakh ha), and Telangana (1.51 lakh ha).
- In 2021, more than 75% of the soy produced worldwide was fed to animals for the production of meat and dairy products. Vegetable oils, industries, and biofuels make up the majority of the remainder. Only 7% of soy is used specifically to make products for human consumption, including tofu, soy milk, edamame beans, and tempeh.
Soy Protein Industry Overview
The Soy Protein Market is fragmented, with the top five companies occupying 28.75%. The major players in this market are Archer Daniels Midland Company, CHS Inc., Fuji Oil Group, International Flavors & Fragrances Inc. and Kerry Group PLC (sorted alphabetically).
Additional Benefits:
- The market estimate (ME) sheet in Excel format
- 3 months of analyst support
TABLE OF CONTENTS
1 EXECUTIVE SUMMARY & KEY FINDINGS
2 INTRODUCTION
- 2.1 Study Assumptions & Market Definition
- 2.2 Scope of the Study
- 2.3 Research Methodology
3 KEY INDUSTRY TRENDS
- 3.1 End User Market Volume
- 3.1.1 Baby Food and Infant Formula
- 3.1.2 Bakery
- 3.1.3 Beverages
- 3.1.4 Breakfast Cereals
- 3.1.5 Condiments/Sauces
- 3.1.6 Confectionery
- 3.1.7 Dairy and Dairy Alternative Products
- 3.1.8 Elderly Nutrition and Medical Nutrition
- 3.1.9 Meat/Poultry/Seafood and Meat Alternative Products
- 3.1.10 RTE/RTC Food Products
- 3.1.11 Snacks
- 3.1.12 Sport/Performance Nutrition
- 3.1.13 Animal Feed
- 3.1.14 Personal Care and Cosmetics
- 3.2 Protein Consumption Trends
- 3.2.1 Plant
- 3.3 Production Trends
- 3.3.1 Plant
- 3.4 Regulatory Framework
- 3.4.1 Australia
- 3.4.2 Canada
- 3.4.3 China
- 3.4.4 France
- 3.4.5 Germany
- 3.4.6 India
- 3.4.7 Italy
- 3.4.8 Japan
- 3.4.9 United Kingdom
- 3.4.10 United States
- 3.5 Value Chain & Distribution Channel Analysis
4 MARKET SEGMENTATION (includes market size in Value in USD and Volume, Forecasts up to 2030 and analysis of growth prospects)
- 4.1 Form
- 4.1.1 Concentrates
- 4.1.2 Isolates
- 4.1.3 Textured/Hydrolyzed
- 4.2 End User
- 4.2.1 Animal Feed
- 4.2.2 Food and Beverages
- 4.2.2.1 By Sub End User
- 4.2.2.1.1 Bakery
- 4.2.2.1.2 Beverages
- 4.2.2.1.3 Breakfast Cereals
- 4.2.2.1.4 Condiments/Sauces
- 4.2.2.1.5 Dairy and Dairy Alternative Products
- 4.2.2.1.6 Meat/Poultry/Seafood and Meat Alternative Products
- 4.2.2.1.7 RTE/RTC Food Products
- 4.2.2.1.8 Snacks
- 4.2.3 Supplements
- 4.2.3.1 By Sub End User
- 4.2.3.1.1 Baby Food and Infant Formula
- 4.2.3.1.2 Elderly Nutrition and Medical Nutrition
- 4.2.3.1.3 Sport/Performance Nutrition
- 4.3 Region
- 4.3.1 Africa
- 4.3.1.1 By Form
- 4.3.1.2 By End User
- 4.3.1.3 By Country
- 4.3.1.3.1 Nigeria
- 4.3.1.3.2 South Africa
- 4.3.1.3.3 Rest of Africa
- 4.3.2 Asia-Pacific
- 4.3.2.1 By Form
- 4.3.2.2 By End User
- 4.3.2.3 By Country
- 4.3.2.3.1 Australia
- 4.3.2.3.2 China
- 4.3.2.3.3 India
- 4.3.2.3.4 Indonesia
- 4.3.2.3.5 Japan
- 4.3.2.3.6 Malaysia
- 4.3.2.3.7 New Zealand
- 4.3.2.3.8 South Korea
- 4.3.2.3.9 Thailand
- 4.3.2.3.10 Vietnam
- 4.3.2.3.11 Rest of Asia-Pacific
- 4.3.3 Europe
- 4.3.3.1 By Form
- 4.3.3.2 By End User
- 4.3.3.3 By Country
- 4.3.3.3.1 Belgium
- 4.3.3.3.2 France
- 4.3.3.3.3 Germany
- 4.3.3.3.4 Italy
- 4.3.3.3.5 Netherlands
- 4.3.3.3.6 Russia
- 4.3.3.3.7 Spain
- 4.3.3.3.8 Turkey
- 4.3.3.3.9 United Kingdom
- 4.3.3.3.10 Rest of Europe
- 4.3.4 Middle East
- 4.3.4.1 By Form
- 4.3.4.2 By End User
- 4.3.4.3 By Country
- 4.3.4.3.1 Iran
- 4.3.4.3.2 Saudi Arabia
- 4.3.4.3.3 United Arab Emirates
- 4.3.4.3.4 Rest of Middle East
- 4.3.5 North America
- 4.3.5.1 By Form
- 4.3.5.2 By End User
- 4.3.5.3 By Country
- 4.3.5.3.1 Canada
- 4.3.5.3.2 Mexico
- 4.3.5.3.3 United States
- 4.3.5.3.4 Rest of North America
- 4.3.6 South America
- 4.3.6.1 By Form
- 4.3.6.2 By End User
- 4.3.6.3 By Country
- 4.3.6.3.1 Argentina
- 4.3.6.3.2 Brazil
- 4.3.6.3.3 Rest of South America
- 4.3.1 Africa
5 COMPETITIVE LANDSCAPE
- 5.1 Key Strategic Moves
- 5.2 Market Share Analysis
- 5.3 Company Landscape
- 5.4 Company Profiles (includes Global Level Overview, Market Level Overview, Core Business Segments, Financials, Headcount, Key Information, Market Rank, Market Share, Products and Services, and Analysis of Recent Developments).
- 5.4.1 A. Costantino & C. SpA
- 5.4.2 Archer Daniels Midland Company
- 5.4.3 Bunge Limited
- 5.4.4 CHS Inc.
- 5.4.5 Fuji Oil Group
- 5.4.6 International Flavors & Fragrances Inc.
- 5.4.7 Kerry Group PLC
- 5.4.8 Wilmar International Ltd
6 KEY STRATEGIC QUESTIONS FOR PROTEIN INGREDIENTS INDUSTRY CEOS
7 APPENDIX
- 7.1 Global Overview
- 7.1.1 Overview
- 7.1.2 Porter's Five Forces Framework
- 7.1.3 Global Value Chain Analysis
- 7.1.4 Market Dynamics (DROs)
- 7.2 Sources & References
- 7.3 List of Tables & Figures
- 7.4 Primary Insights
- 7.5 Data Pack
- 7.6 Glossary of Terms

