|
|
市場調査レポート
商品コード
1645317
没入型コンテンツ制作の世界市場の規模、シェア、動向分析レポート、技術別、コンポーネント別、最終用途別、地域別展望と予測、2024年~2031年Global Immersive Content Creation Market Size, Share & Trends Analysis Report By Technology, By Component (Hardware, Software, and Services), By End-Use, By Regional Outlook and Forecast, 2024 - 2031 |
||||||
|
|||||||
|
|||||||


| 没入型コンテンツ制作の世界市場の規模、シェア、動向分析レポート、技術別、コンポーネント別、最終用途別、地域別展望と予測、2024年~2031年 |
|
出版日: 2025年01月24日
発行: KBV Research
ページ情報: 英文 277 Pages
納期: 即納可能
|

全表示
- 概要
- 図表
- 目次
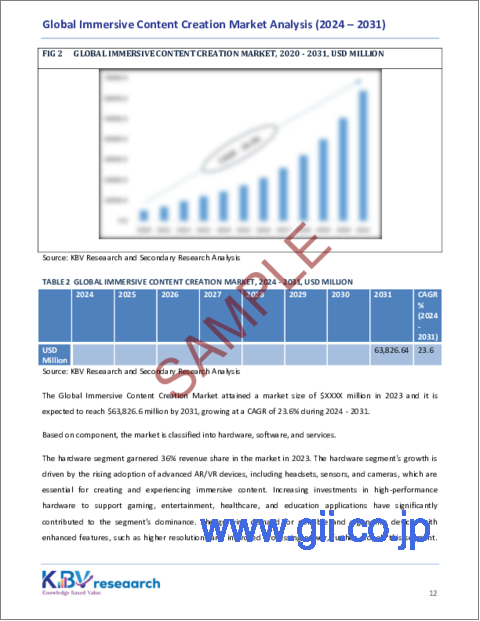
没入型コンテンツ制作市場規模は、予測期間中に23.6%のCAGRで市場成長し、2031年までに638億2,000万米ドルに達すると予想されています。
しかし、ARおよびVR技術の急速な進歩にもかかわらず、多くの潜在的ユーザーは、その用途と利点に気付いていません。主流の技術とは異なり、没入型デバイスでは、ユーザーが機能を理解し、効果的に使用する方法を習得するために時間を費やす必要があることがよくあります。この学習曲線は、特にトレーニング、ゲーム、仮想観光などの分野で、AR/VR体験から恩恵を受ける可能性のある個人を思いとどまらせる可能性があります。さらに、これらの技術の複雑さや有用性に関する誤解は、それらの採用の遅れにさらに影響します。したがって、これらの障壁が克服されるまで、市場の成長は、限られたアクセス性と広範な消費者の関与の欠如によって制限され続けるでしょう。
コンポーネントの展望
コンポーネントに基づいて、市場はハードウェア、ソフトウェア、およびサービスに分類されます。ソフトウェアセグメントは、2023年に市場で33%の収益シェアを獲得しました。ゲーム開発エンジン、シミュレーションプラットフォーム、エンタープライズレベルのアプリケーションが主要な推進力であり、開発者が魅力的でインタラクティブなAR/VRエクスペリエンスを作成できるようにしています。ヘルスケアにおける仮想トレーニングモジュールや企業環境での従業員オンボーディングプログラムなど、業界固有のソリューションの需要が高まっていることで、このセグメントがさらに成長しています。AI駆動型ツールとリアルタイムレンダリングテクノロジーの革新もソフトウェア情勢を強化し、業界全体で没入型コンテンツ制作を拡大するための重要なコンポーネントになっています。
技術展望
技術に基づいて、市場は仮想現実(VR)コンテンツ、拡張現実(AR)コンテンツ、複合現実(MR)コンテンツ、その他に分かれています。仮想現実(VR)コンテンツセグメントは、2023年に市場で40%の収益シェアを獲得しました。仮想現実(VR)コンテンツセグメントは、さまざまな業界でユーザーエンゲージメントを強化する完全に没入型の環境を作成する能力によって主に推進されています。ゲーム分野では、VRはプレーヤーを魅了するリアルでインタラクティブな体験を提供し、教育とトレーニングでは、VRシミュレーションは、ヘルスケア、航空、製造などの分野でスキル開発のためのリスクのない環境を提供します。エンターテインメント業界では、VRを活用して没入型の映画、コンサート、ライブイベントを作成し、ユーザーに存在感と実際に参加しているような感覚を提供しています。
最終用途の見通し
最終用途別に見ると、市場はゲーム、エンターテインメントとメディア、教育とトレーニング、ヘルスケア、小売とeコマース、自動車、その他に分類されています。ヘルスケアセグメントは、2023年に市場で10%の収益シェアを獲得しました。没入型シミュレーションにより、専門家はリスクのない環境で外科手術や複雑な医療技術を練習することができ、精度とスキル開発が向上します。患者にとって、VRはメンタルヘルス療法、疼痛管理、リハビリテーション運動に広く使用されています。遠隔医療と仮想相談の採用の増加は、没入型コンテンツが患者ケアを変革する可能性を強調しており、セグメントの成長における重要な要素となっています。
地域展望
地域別に見ると、市場は北米、欧州、アジア太平洋、ラテンアメリカ・中東・アフリカにわたって分析されています。北米セグメントは、2023年に市場で36%の収益シェアを獲得しました。北米市場は、強力な技術インフラストラクチャと、Meta、Google、Microsoftなどの著名な業界リーダーの存在によって推進されています。ゲーム、エンターテイメント、 eコマースにおける革新的な体験に対する消費者の高い需要により、この地域でのARおよびVRテクノロジーの採用が促進されています。
目次
第1章 市場範囲と調査手法
- 市場の定義
- 目的
- 市場範囲
- セグメンテーション
- 調査手法
第2章 市場要覧
- 主なハイライト
第3章 市場概要
- イントロダクション
- 概要
- 市場構成とシナリオ
- 概要
- 市場に影響を与える主な要因
- 市場促進要因
- 市場抑制要因
- 市場機会
- 市場の課題
第4章 競合分析- 世界
- 市場シェア分析、2023年
- 没入型コンテンツ制作市場で展開される戦略
- ポーターのファイブフォース分析
第5章 世界市場:技術別
- 世界のバーチャルリアリティ(VR)コンテンツ市場:地域別
- 世界の拡張現実(AR)コンテンツ市場:地域別
- 世界の複合現実(MR)コンテンツ市場:地域別
- 世界のその他の技術市場:地域別
第6章 世界市場:コンポーネント別
- 世界のハードウェア市場:地域別
- 世界のソフトウェア市場:地域別
- 世界のサービス市場:地域別
第7章 世界市場:最終用途別
- 世界のゲーム市場:地域別
- 世界のエンターテイメントとメディア市場:地域別
- 世界の教育・研修市場:地域別
- 世界のヘルスケア市場:地域別
- 世界の小売・電子商取引市場:地域別
- 世界の自動車市場:地域別
- 世界のその他の最終用途市場:地域別
第8章 世界市場:地域別
- 北米
- 北米の市場:国別
- 米国
- カナダ
- メキシコ
- その他北米地域
- 北米の市場:国別
- 欧州
- 欧州の市場:国別
- ドイツ
- 英国
- フランス
- ロシア
- スペイン
- イタリア
- その他欧州地域
- 欧州の市場:国別
- アジア太平洋地域
- アジア太平洋の市場:国別
- 中国
- 日本
- インド
- 韓国
- オーストラリア
- マレーシア
- その他アジア太平洋地域
- アジア太平洋の市場:国別
- ラテンアメリカ・中東・アフリカ
- ラテンアメリカ・中東・アフリカの市場:国別
- ブラジル
- アルゼンチン
- アラブ首長国連邦
- サウジアラビア
- 南アフリカ
- ナイジェリア
- その他ラテンアメリカ・中東・アフリカ地域
- ラテンアメリカ・中東・アフリカの市場:国別
第9章 企業プロファイル
- Unity Software, Inc
- Meta Platforms, Inc
- Epic Games, Inc
- Google LLC(Alphabet Inc)
- HCL Technologies Ltd(HCL Enterprises)
- HTC Corporation
- Magic Leap, Inc
- Microsoft Corporation
- NVIDIA Corporation
- Sony Corporation
第10章 没入型コンテンツ制作市場の成功必須条件
LIST OF TABLES
- TABLE 1 Global Immersive Content Creation Market, 2020 - 2023, USD Million
- TABLE 2 Global Immersive Content Creation Market, 2024 - 2031, USD Million
- TABLE 3 Global Immersive Content Creation Market by Technology, 2020 - 2023, USD Million
- TABLE 4 Global Immersive Content Creation Market by Technology, 2024 - 2031, USD Million
- TABLE 5 Global Virtual Reality (VR) Content Market by Region, 2020 - 2023, USD Million
- TABLE 6 Global Virtual Reality (VR) Content Market by Region, 2024 - 2031, USD Million
- TABLE 7 Global Augmented Reality (AR) Content Market by Region, 2020 - 2023, USD Million
- TABLE 8 Global Augmented Reality (AR) Content Market by Region, 2024 - 2031, USD Million
- TABLE 9 Global Mixed Reality (MR) Content Market by Region, 2020 - 2023, USD Million
- TABLE 10 Global Mixed Reality (MR) Content Market by Region, 2024 - 2031, USD Million
- TABLE 11 Global Other Technology Market by Region, 2020 - 2023, USD Million
- TABLE 12 Global Other Technology Market by Region, 2024 - 2031, USD Million
- TABLE 13 Global Immersive Content Creation Market by Component, 2020 - 2023, USD Million
- TABLE 14 Global Immersive Content Creation Market by Component, 2024 - 2031, USD Million
- TABLE 15 Global Hardware Market by Region, 2020 - 2023, USD Million
- TABLE 16 Global Hardware Market by Region, 2024 - 2031, USD Million
- TABLE 17 Global Software Market by Region, 2020 - 2023, USD Million
- TABLE 18 Global Software Market by Region, 2024 - 2031, USD Million
- TABLE 19 Global Services Market by Region, 2020 - 2023, USD Million
- TABLE 20 Global Services Market by Region, 2024 - 2031, USD Million
- TABLE 21 Global Immersive Content Creation Market by End-Use, 2020 - 2023, USD Million
- TABLE 22 Global Immersive Content Creation Market by End-Use, 2024 - 2031, USD Million
- TABLE 23 Global Gaming Market by Region, 2020 - 2023, USD Million
- TABLE 24 Global Gaming Market by Region, 2024 - 2031, USD Million
- TABLE 25 Global Entertainment & Media Market by Region, 2020 - 2023, USD Million
- TABLE 26 Global Entertainment & Media Market by Region, 2024 - 2031, USD Million
- TABLE 27 Global Education & Training Market by Region, 2020 - 2023, USD Million
- TABLE 28 Global Education & Training Market by Region, 2024 - 2031, USD Million
- TABLE 29 Global Healthcare Market by Region, 2020 - 2023, USD Million
- TABLE 30 Global Healthcare Market by Region, 2024 - 2031, USD Million
- TABLE 31 Global Retail & Ecommerce Market by Region, 2020 - 2023, USD Million
- TABLE 32 Global Retail & Ecommerce Market by Region, 2024 - 2031, USD Million
- TABLE 33 Global Automotive Market by Region, 2020 - 2023, USD Million
- TABLE 34 Global Automotive Market by Region, 2024 - 2031, USD Million
- TABLE 35 Global Other End-Use Market by Region, 2020 - 2023, USD Million
- TABLE 36 Global Other End-Use Market by Region, 2024 - 2031, USD Million
- TABLE 37 Global Immersive Content Creation Market by Region, 2020 - 2023, USD Million
- TABLE 38 Global Immersive Content Creation Market by Region, 2024 - 2031, USD Million
- TABLE 39 North America Immersive Content Creation Market, 2020 - 2023, USD Million
- TABLE 40 North America Immersive Content Creation Market, 2024 - 2031, USD Million
- TABLE 41 North America Immersive Content Creation Market by Technology, 2020 - 2023, USD Million
- TABLE 42 North America Immersive Content Creation Market by Technology, 2024 - 2031, USD Million
- TABLE 43 North America Virtual Reality (VR) Content Market by Country, 2020 - 2023, USD Million
- TABLE 44 North America Virtual Reality (VR) Content Market by Country, 2024 - 2031, USD Million
- TABLE 45 North America Augmented Reality (AR) Content Market by Country, 2020 - 2023, USD Million
- TABLE 46 North America Augmented Reality (AR) Content Market by Country, 2024 - 2031, USD Million
- TABLE 47 North America Mixed Reality (MR) Content Market by Country, 2020 - 2023, USD Million
- TABLE 48 North America Mixed Reality (MR) Content Market by Country, 2024 - 2031, USD Million
- TABLE 49 North America Other Technology Market by Country, 2020 - 2023, USD Million
- TABLE 50 North America Other Technology Market by Country, 2024 - 2031, USD Million
- TABLE 51 North America Immersive Content Creation Market by Component, 2020 - 2023, USD Million
- TABLE 52 North America Immersive Content Creation Market by Component, 2024 - 2031, USD Million
- TABLE 53 North America Hardware Market by Country, 2020 - 2023, USD Million
- TABLE 54 North America Hardware Market by Country, 2024 - 2031, USD Million
- TABLE 55 North America Software Market by Country, 2020 - 2023, USD Million
- TABLE 56 North America Software Market by Country, 2024 - 2031, USD Million
- TABLE 57 North America Services Market by Country, 2020 - 2023, USD Million
- TABLE 58 North America Services Market by Country, 2024 - 2031, USD Million
- TABLE 59 North America Immersive Content Creation Market by End-Use, 2020 - 2023, USD Million
- TABLE 60 North America Immersive Content Creation Market by End-Use, 2024 - 2031, USD Million
- TABLE 61 North America Gaming Market by Country, 2020 - 2023, USD Million
- TABLE 62 North America Gaming Market by Country, 2024 - 2031, USD Million
- TABLE 63 North America Entertainment & Media Market by Country, 2020 - 2023, USD Million
- TABLE 64 North America Entertainment & Media Market by Country, 2024 - 2031, USD Million
- TABLE 65 North America Education & Training Market by Country, 2020 - 2023, USD Million
- TABLE 66 North America Education & Training Market by Country, 2024 - 2031, USD Million
- TABLE 67 North America Healthcare Market by Country, 2020 - 2023, USD Million
- TABLE 68 North America Healthcare Market by Country, 2024 - 2031, USD Million
- TABLE 69 North America Retail & Ecommerce Market by Country, 2020 - 2023, USD Million
- TABLE 70 North America Retail & Ecommerce Market by Country, 2024 - 2031, USD Million
- TABLE 71 North America Automotive Market by Country, 2020 - 2023, USD Million
- TABLE 72 North America Automotive Market by Country, 2024 - 2031, USD Million
- TABLE 73 North America Other End-Use Market by Country, 2020 - 2023, USD Million
- TABLE 74 North America Other End-Use Market by Country, 2024 - 2031, USD Million
- TABLE 75 North America Immersive Content Creation Market by Country, 2020 - 2023, USD Million
- TABLE 76 North America Immersive Content Creation Market by Country, 2024 - 2031, USD Million
- TABLE 77 US Immersive Content Creation Market, 2020 - 2023, USD Million
- TABLE 78 US Immersive Content Creation Market, 2024 - 2031, USD Million
- TABLE 79 US Immersive Content Creation Market by Technology, 2020 - 2023, USD Million
- TABLE 80 US Immersive Content Creation Market by Technology, 2024 - 2031, USD Million
- TABLE 81 US Immersive Content Creation Market by Component, 2020 - 2023, USD Million
- TABLE 82 US Immersive Content Creation Market by Component, 2024 - 2031, USD Million
- TABLE 83 US Immersive Content Creation Market by End-Use, 2020 - 2023, USD Million
- TABLE 84 US Immersive Content Creation Market by End-Use, 2024 - 2031, USD Million
- TABLE 85 Canada Immersive Content Creation Market, 2020 - 2023, USD Million
- TABLE 86 Canada Immersive Content Creation Market, 2024 - 2031, USD Million
- TABLE 87 Canada Immersive Content Creation Market by Technology, 2020 - 2023, USD Million
- TABLE 88 Canada Immersive Content Creation Market by Technology, 2024 - 2031, USD Million
- TABLE 89 Canada Immersive Content Creation Market by Component, 2020 - 2023, USD Million
- TABLE 90 Canada Immersive Content Creation Market by Component, 2024 - 2031, USD Million
- TABLE 91 Canada Immersive Content Creation Market by End-Use, 2020 - 2023, USD Million
- TABLE 92 Canada Immersive Content Creation Market by End-Use, 2024 - 2031, USD Million
- TABLE 93 Mexico Immersive Content Creation Market, 2020 - 2023, USD Million
- TABLE 94 Mexico Immersive Content Creation Market, 2024 - 2031, USD Million
- TABLE 95 Mexico Immersive Content Creation Market by Technology, 2020 - 2023, USD Million
- TABLE 96 Mexico Immersive Content Creation Market by Technology, 2024 - 2031, USD Million
- TABLE 97 Mexico Immersive Content Creation Market by Component, 2020 - 2023, USD Million
- TABLE 98 Mexico Immersive Content Creation Market by Component, 2024 - 2031, USD Million
- TABLE 99 Mexico Immersive Content Creation Market by End-Use, 2020 - 2023, USD Million
- TABLE 100 Mexico Immersive Content Creation Market by End-Use, 2024 - 2031, USD Million
- TABLE 101 Rest of North America Immersive Content Creation Market, 2020 - 2023, USD Million
- TABLE 102 Rest of North America Immersive Content Creation Market, 2024 - 2031, USD Million
- TABLE 103 Rest of North America Immersive Content Creation Market by Technology, 2020 - 2023, USD Million
- TABLE 104 Rest of North America Immersive Content Creation Market by Technology, 2024 - 2031, USD Million
- TABLE 105 Rest of North America Immersive Content Creation Market by Component, 2020 - 2023, USD Million
- TABLE 106 Rest of North America Immersive Content Creation Market by Component, 2024 - 2031, USD Million
- TABLE 107 Rest of North America Immersive Content Creation Market by End-Use, 2020 - 2023, USD Million
- TABLE 108 Rest of North America Immersive Content Creation Market by End-Use, 2024 - 2031, USD Million
- TABLE 109 Europe Immersive Content Creation Market, 2020 - 2023, USD Million
- TABLE 110 Europe Immersive Content Creation Market, 2024 - 2031, USD Million
- TABLE 111 Europe Immersive Content Creation Market by Technology, 2020 - 2023, USD Million
- TABLE 112 Europe Immersive Content Creation Market by Technology, 2024 - 2031, USD Million
- TABLE 113 Europe Virtual Reality (VR) Content Market by Country, 2020 - 2023, USD Million
- TABLE 114 Europe Virtual Reality (VR) Content Market by Country, 2024 - 2031, USD Million
- TABLE 115 Europe Augmented Reality (AR) Content Market by Country, 2020 - 2023, USD Million
- TABLE 116 Europe Augmented Reality (AR) Content Market by Country, 2024 - 2031, USD Million
- TABLE 117 Europe Mixed Reality (MR) Content Market by Country, 2020 - 2023, USD Million
- TABLE 118 Europe Mixed Reality (MR) Content Market by Country, 2024 - 2031, USD Million
- TABLE 119 Europe Other Technology Market by Country, 2020 - 2023, USD Million
- TABLE 120 Europe Other Technology Market by Country, 2024 - 2031, USD Million
- TABLE 121 Europe Immersive Content Creation Market by Component, 2020 - 2023, USD Million
- TABLE 122 Europe Immersive Content Creation Market by Component, 2024 - 2031, USD Million
- TABLE 123 Europe Hardware Market by Country, 2020 - 2023, USD Million
- TABLE 124 Europe Hardware Market by Country, 2024 - 2031, USD Million
- TABLE 125 Europe Software Market by Country, 2020 - 2023, USD Million
- TABLE 126 Europe Software Market by Country, 2024 - 2031, USD Million
- TABLE 127 Europe Services Market by Country, 2020 - 2023, USD Million
- TABLE 128 Europe Services Market by Country, 2024 - 2031, USD Million
- TABLE 129 Europe Immersive Content Creation Market by End-Use, 2020 - 2023, USD Million
- TABLE 130 Europe Immersive Content Creation Market by End-Use, 2024 - 2031, USD Million
- TABLE 131 Europe Gaming Market by Country, 2020 - 2023, USD Million
- TABLE 132 Europe Gaming Market by Country, 2024 - 2031, USD Million
- TABLE 133 Europe Entertainment & Media Market by Country, 2020 - 2023, USD Million
- TABLE 134 Europe Entertainment & Media Market by Country, 2024 - 2031, USD Million
- TABLE 135 Europe Education & Training Market by Country, 2020 - 2023, USD Million
- TABLE 136 Europe Education & Training Market by Country, 2024 - 2031, USD Million
- TABLE 137 Europe Healthcare Market by Country, 2020 - 2023, USD Million
- TABLE 138 Europe Healthcare Market by Country, 2024 - 2031, USD Million
- TABLE 139 Europe Retail & Ecommerce Market by Country, 2020 - 2023, USD Million
- TABLE 140 Europe Retail & Ecommerce Market by Country, 2024 - 2031, USD Million
- TABLE 141 Europe Automotive Market by Country, 2020 - 2023, USD Million
- TABLE 142 Europe Automotive Market by Country, 2024 - 2031, USD Million
- TABLE 143 Europe Other End-Use Market by Country, 2020 - 2023, USD Million
- TABLE 144 Europe Other End-Use Market by Country, 2024 - 2031, USD Million
- TABLE 145 Europe Immersive Content Creation Market by Country, 2020 - 2023, USD Million
- TABLE 146 Europe Immersive Content Creation Market by Country, 2024 - 2031, USD Million
- TABLE 147 Germany Immersive Content Creation Market, 2020 - 2023, USD Million
- TABLE 148 Germany Immersive Content Creation Market, 2024 - 2031, USD Million
- TABLE 149 Germany Immersive Content Creation Market by Technology, 2020 - 2023, USD Million
- TABLE 150 Germany Immersive Content Creation Market by Technology, 2024 - 2031, USD Million
- TABLE 151 Germany Immersive Content Creation Market by Component, 2020 - 2023, USD Million
- TABLE 152 Germany Immersive Content Creation Market by Component, 2024 - 2031, USD Million
- TABLE 153 Germany Immersive Content Creation Market by End-Use, 2020 - 2023, USD Million
- TABLE 154 Germany Immersive Content Creation Market by End-Use, 2024 - 2031, USD Million
- TABLE 155 UK Immersive Content Creation Market, 2020 - 2023, USD Million
- TABLE 156 UK Immersive Content Creation Market, 2024 - 2031, USD Million
- TABLE 157 UK Immersive Content Creation Market by Technology, 2020 - 2023, USD Million
- TABLE 158 UK Immersive Content Creation Market by Technology, 2024 - 2031, USD Million
- TABLE 159 UK Immersive Content Creation Market by Component, 2020 - 2023, USD Million
- TABLE 160 UK Immersive Content Creation Market by Component, 2024 - 2031, USD Million
- TABLE 161 UK Immersive Content Creation Market by End-Use, 2020 - 2023, USD Million
- TABLE 162 UK Immersive Content Creation Market by End-Use, 2024 - 2031, USD Million
- TABLE 163 France Immersive Content Creation Market, 2020 - 2023, USD Million
- TABLE 164 France Immersive Content Creation Market, 2024 - 2031, USD Million
- TABLE 165 France Immersive Content Creation Market by Technology, 2020 - 2023, USD Million
- TABLE 166 France Immersive Content Creation Market by Technology, 2024 - 2031, USD Million
- TABLE 167 France Immersive Content Creation Market by Component, 2020 - 2023, USD Million
- TABLE 168 France Immersive Content Creation Market by Component, 2024 - 2031, USD Million
- TABLE 169 France Immersive Content Creation Market by End-Use, 2020 - 2023, USD Million
- TABLE 170 France Immersive Content Creation Market by End-Use, 2024 - 2031, USD Million
- TABLE 171 Russia Immersive Content Creation Market, 2020 - 2023, USD Million
- TABLE 172 Russia Immersive Content Creation Market, 2024 - 2031, USD Million
- TABLE 173 Russia Immersive Content Creation Market by Technology, 2020 - 2023, USD Million
- TABLE 174 Russia Immersive Content Creation Market by Technology, 2024 - 2031, USD Million
- TABLE 175 Russia Immersive Content Creation Market by Component, 2020 - 2023, USD Million
- TABLE 176 Russia Immersive Content Creation Market by Component, 2024 - 2031, USD Million
- TABLE 177 Russia Immersive Content Creation Market by End-Use, 2020 - 2023, USD Million
- TABLE 178 Russia Immersive Content Creation Market by End-Use, 2024 - 2031, USD Million
- TABLE 179 Spain Immersive Content Creation Market, 2020 - 2023, USD Million
- TABLE 180 Spain Immersive Content Creation Market, 2024 - 2031, USD Million
- TABLE 181 Spain Immersive Content Creation Market by Technology, 2020 - 2023, USD Million
- TABLE 182 Spain Immersive Content Creation Market by Technology, 2024 - 2031, USD Million
- TABLE 183 Spain Immersive Content Creation Market by Component, 2020 - 2023, USD Million
- TABLE 184 Spain Immersive Content Creation Market by Component, 2024 - 2031, USD Million
- TABLE 185 Spain Immersive Content Creation Market by End-Use, 2020 - 2023, USD Million
- TABLE 186 Spain Immersive Content Creation Market by End-Use, 2024 - 2031, USD Million
- TABLE 187 Italy Immersive Content Creation Market, 2020 - 2023, USD Million
- TABLE 188 Italy Immersive Content Creation Market, 2024 - 2031, USD Million
- TABLE 189 Italy Immersive Content Creation Market by Technology, 2020 - 2023, USD Million
- TABLE 190 Italy Immersive Content Creation Market by Technology, 2024 - 2031, USD Million
- TABLE 191 Italy Immersive Content Creation Market by Component, 2020 - 2023, USD Million
- TABLE 192 Italy Immersive Content Creation Market by Component, 2024 - 2031, USD Million
- TABLE 193 Italy Immersive Content Creation Market by End-Use, 2020 - 2023, USD Million
- TABLE 194 Italy Immersive Content Creation Market by End-Use, 2024 - 2031, USD Million
- TABLE 195 Rest of Europe Immersive Content Creation Market, 2020 - 2023, USD Million
- TABLE 196 Rest of Europe Immersive Content Creation Market, 2024 - 2031, USD Million
- TABLE 197 Rest of Europe Immersive Content Creation Market by Technology, 2020 - 2023, USD Million
- TABLE 198 Rest of Europe Immersive Content Creation Market by Technology, 2024 - 2031, USD Million
- TABLE 199 Rest of Europe Immersive Content Creation Market by Component, 2020 - 2023, USD Million
- TABLE 200 Rest of Europe Immersive Content Creation Market by Component, 2024 - 2031, USD Million
- TABLE 201 Rest of Europe Immersive Content Creation Market by End-Use, 2020 - 2023, USD Million
- TABLE 202 Rest of Europe Immersive Content Creation Market by End-Use, 2024 - 2031, USD Million
- TABLE 203 Asia Pacific Immersive Content Creation Market, 2020 - 2023, USD Million
- TABLE 204 Asia Pacific Immersive Content Creation Market, 2024 - 2031, USD Million
- TABLE 205 Asia Pacific Immersive Content Creation Market by Technology, 2020 - 2023, USD Million
- TABLE 206 Asia Pacific Immersive Content Creation Market by Technology, 2024 - 2031, USD Million
- TABLE 207 Asia Pacific Virtual Reality (VR) Content Market by Country, 2020 - 2023, USD Million
- TABLE 208 Asia Pacific Virtual Reality (VR) Content Market by Country, 2024 - 2031, USD Million
- TABLE 209 Asia Pacific Augmented Reality (AR) Content Market by Country, 2020 - 2023, USD Million
- TABLE 210 Asia Pacific Augmented Reality (AR) Content Market by Country, 2024 - 2031, USD Million
- TABLE 211 Asia Pacific Mixed Reality (MR) Content Market by Country, 2020 - 2023, USD Million
- TABLE 212 Asia Pacific Mixed Reality (MR) Content Market by Country, 2024 - 2031, USD Million
- TABLE 213 Asia Pacific Other Technology Market by Country, 2020 - 2023, USD Million
- TABLE 214 Asia Pacific Other Technology Market by Country, 2024 - 2031, USD Million
- TABLE 215 Asia Pacific Immersive Content Creation Market by Component, 2020 - 2023, USD Million
- TABLE 216 Asia Pacific Immersive Content Creation Market by Component, 2024 - 2031, USD Million
- TABLE 217 Asia Pacific Hardware Market by Country, 2020 - 2023, USD Million
- TABLE 218 Asia Pacific Hardware Market by Country, 2024 - 2031, USD Million
- TABLE 219 Asia Pacific Software Market by Country, 2020 - 2023, USD Million
- TABLE 220 Asia Pacific Software Market by Country, 2024 - 2031, USD Million
- TABLE 221 Asia Pacific Services Market by Country, 2020 - 2023, USD Million
- TABLE 222 Asia Pacific Services Market by Country, 2024 - 2031, USD Million
- TABLE 223 Asia Pacific Immersive Content Creation Market by End-Use, 2020 - 2023, USD Million
- TABLE 224 Asia Pacific Immersive Content Creation Market by End-Use, 2024 - 2031, USD Million
- TABLE 225 Asia Pacific Gaming Market by Country, 2020 - 2023, USD Million
- TABLE 226 Asia Pacific Gaming Market by Country, 2024 - 2031, USD Million
- TABLE 227 Asia Pacific Entertainment & Media Market by Country, 2020 - 2023, USD Million
- TABLE 228 Asia Pacific Entertainment & Media Market by Country, 2024 - 2031, USD Million
- TABLE 229 Asia Pacific Education & Training Market by Country, 2020 - 2023, USD Million
- TABLE 230 Asia Pacific Education & Training Market by Country, 2024 - 2031, USD Million
- TABLE 231 Asia Pacific Healthcare Market by Country, 2020 - 2023, USD Million
- TABLE 232 Asia Pacific Healthcare Market by Country, 2024 - 2031, USD Million
- TABLE 233 Asia Pacific Retail & Ecommerce Market by Country, 2020 - 2023, USD Million
- TABLE 234 Asia Pacific Retail & Ecommerce Market by Country, 2024 - 2031, USD Million
- TABLE 235 Asia Pacific Automotive Market by Country, 2020 - 2023, USD Million
- TABLE 236 Asia Pacific Automotive Market by Country, 2024 - 2031, USD Million
- TABLE 237 Asia Pacific Other End-Use Market by Country, 2020 - 2023, USD Million
- TABLE 238 Asia Pacific Other End-Use Market by Country, 2024 - 2031, USD Million
- TABLE 239 Asia Pacific Immersive Content Creation Market by Country, 2020 - 2023, USD Million
- TABLE 240 Asia Pacific Immersive Content Creation Market by Country, 2024 - 2031, USD Million
- TABLE 241 China Immersive Content Creation Market, 2020 - 2023, USD Million
- TABLE 242 China Immersive Content Creation Market, 2024 - 2031, USD Million
- TABLE 243 China Immersive Content Creation Market by Technology, 2020 - 2023, USD Million
- TABLE 244 China Immersive Content Creation Market by Technology, 2024 - 2031, USD Million
- TABLE 245 China Immersive Content Creation Market by Component, 2020 - 2023, USD Million
- TABLE 246 China Immersive Content Creation Market by Component, 2024 - 2031, USD Million
- TABLE 247 China Immersive Content Creation Market by End-Use, 2020 - 2023, USD Million
- TABLE 248 China Immersive Content Creation Market by End-Use, 2024 - 2031, USD Million
- TABLE 249 Japan Immersive Content Creation Market, 2020 - 2023, USD Million
- TABLE 250 Japan Immersive Content Creation Market, 2024 - 2031, USD Million
- TABLE 251 Japan Immersive Content Creation Market by Technology, 2020 - 2023, USD Million
- TABLE 252 Japan Immersive Content Creation Market by Technology, 2024 - 2031, USD Million
- TABLE 253 Japan Immersive Content Creation Market by Component, 2020 - 2023, USD Million
- TABLE 254 Japan Immersive Content Creation Market by Component, 2024 - 2031, USD Million
- TABLE 255 Japan Immersive Content Creation Market by End-Use, 2020 - 2023, USD Million
- TABLE 256 Japan Immersive Content Creation Market by End-Use, 2024 - 2031, USD Million
- TABLE 257 India Immersive Content Creation Market, 2020 - 2023, USD Million
- TABLE 258 India Immersive Content Creation Market, 2024 - 2031, USD Million
- TABLE 259 India Immersive Content Creation Market by Technology, 2020 - 2023, USD Million
- TABLE 260 India Immersive Content Creation Market by Technology, 2024 - 2031, USD Million
- TABLE 261 India Immersive Content Creation Market by Component, 2020 - 2023, USD Million
- TABLE 262 India Immersive Content Creation Market by Component, 2024 - 2031, USD Million
- TABLE 263 India Immersive Content Creation Market by End-Use, 2020 - 2023, USD Million
- TABLE 264 India Immersive Content Creation Market by End-Use, 2024 - 2031, USD Million
- TABLE 265 South Korea Immersive Content Creation Market, 2020 - 2023, USD Million
- TABLE 266 South Korea Immersive Content Creation Market, 2024 - 2031, USD Million
- TABLE 267 South Korea Immersive Content Creation Market by Technology, 2020 - 2023, USD Million
- TABLE 268 South Korea Immersive Content Creation Market by Technology, 2024 - 2031, USD Million
- TABLE 269 South Korea Immersive Content Creation Market by Component, 2020 - 2023, USD Million
- TABLE 270 South Korea Immersive Content Creation Market by Component, 2024 - 2031, USD Million
- TABLE 271 South Korea Immersive Content Creation Market by End-Use, 2020 - 2023, USD Million
- TABLE 272 South Korea Immersive Content Creation Market by End-Use, 2024 - 2031, USD Million
- TABLE 273 Australia Immersive Content Creation Market, 2020 - 2023, USD Million
- TABLE 274 Australia Immersive Content Creation Market, 2024 - 2031, USD Million
- TABLE 275 Australia Immersive Content Creation Market by Technology, 2020 - 2023, USD Million
- TABLE 276 Australia Immersive Content Creation Market by Technology, 2024 - 2031, USD Million
- TABLE 277 Australia Immersive Content Creation Market by Component, 2020 - 2023, USD Million
- TABLE 278 Australia Immersive Content Creation Market by Component, 2024 - 2031, USD Million
- TABLE 279 Australia Immersive Content Creation Market by End-Use, 2020 - 2023, USD Million
- TABLE 280 Australia Immersive Content Creation Market by End-Use, 2024 - 2031, USD Million
- TABLE 281 Malaysia Immersive Content Creation Market, 2020 - 2023, USD Million
- TABLE 282 Malaysia Immersive Content Creation Market, 2024 - 2031, USD Million
- TABLE 283 Malaysia Immersive Content Creation Market by Technology, 2020 - 2023, USD Million
- TABLE 284 Malaysia Immersive Content Creation Market by Technology, 2024 - 2031, USD Million
- TABLE 285 Malaysia Immersive Content Creation Market by Component, 2020 - 2023, USD Million
- TABLE 286 Malaysia Immersive Content Creation Market by Component, 2024 - 2031, USD Million
- TABLE 287 Malaysia Immersive Content Creation Market by End-Use, 2020 - 2023, USD Million
- TABLE 288 Malaysia Immersive Content Creation Market by End-Use, 2024 - 2031, USD Million
- TABLE 289 Rest of Asia Pacific Immersive Content Creation Market, 2020 - 2023, USD Million
- TABLE 290 Rest of Asia Pacific Immersive Content Creation Market, 2024 - 2031, USD Million
- TABLE 291 Rest of Asia Pacific Immersive Content Creation Market by Technology, 2020 - 2023, USD Million
- TABLE 292 Rest of Asia Pacific Immersive Content Creation Market by Technology, 2024 - 2031, USD Million
- TABLE 293 Rest of Asia Pacific Immersive Content Creation Market by Component, 2020 - 2023, USD Million
- TABLE 294 Rest of Asia Pacific Immersive Content Creation Market by Component, 2024 - 2031, USD Million
- TABLE 295 Rest of Asia Pacific Immersive Content Creation Market by End-Use, 2020 - 2023, USD Million
- TABLE 296 Rest of Asia Pacific Immersive Content Creation Market by End-Use, 2024 - 2031, USD Million
- TABLE 297 LAMEA Immersive Content Creation Market, 2020 - 2023, USD Million
- TABLE 298 LAMEA Immersive Content Creation Market, 2024 - 2031, USD Million
- TABLE 299 LAMEA Immersive Content Creation Market by Technology, 2020 - 2023, USD Million
- TABLE 300 LAMEA Immersive Content Creation Market by Technology, 2024 - 2031, USD Million
- TABLE 301 LAMEA Virtual Reality (VR) Content Market by Country, 2020 - 2023, USD Million
- TABLE 302 LAMEA Virtual Reality (VR) Content Market by Country, 2024 - 2031, USD Million
- TABLE 303 LAMEA Augmented Reality (AR) Content Market by Country, 2020 - 2023, USD Million
- TABLE 304 LAMEA Augmented Reality (AR) Content Market by Country, 2024 - 2031, USD Million
- TABLE 305 LAMEA Mixed Reality (MR) Content Market by Country, 2020 - 2023, USD Million
- TABLE 306 LAMEA Mixed Reality (MR) Content Market by Country, 2024 - 2031, USD Million
- TABLE 307 LAMEA Other Technology Market by Country, 2020 - 2023, USD Million
- TABLE 308 LAMEA Other Technology Market by Country, 2024 - 2031, USD Million
- TABLE 309 LAMEA Immersive Content Creation Market by Component, 2020 - 2023, USD Million
- TABLE 310 LAMEA Immersive Content Creation Market by Component, 2024 - 2031, USD Million
- TABLE 311 LAMEA Hardware Market by Country, 2020 - 2023, USD Million
- TABLE 312 LAMEA Hardware Market by Country, 2024 - 2031, USD Million
- TABLE 313 LAMEA Software Market by Country, 2020 - 2023, USD Million
- TABLE 314 LAMEA Software Market by Country, 2024 - 2031, USD Million
- TABLE 315 LAMEA Services Market by Country, 2020 - 2023, USD Million
- TABLE 316 LAMEA Services Market by Country, 2024 - 2031, USD Million
- TABLE 317 LAMEA Immersive Content Creation Market by End-Use, 2020 - 2023, USD Million
- TABLE 318 LAMEA Immersive Content Creation Market by End-Use, 2024 - 2031, USD Million
- TABLE 319 LAMEA Gaming Market by Country, 2020 - 2023, USD Million
- TABLE 320 LAMEA Gaming Market by Country, 2024 - 2031, USD Million
- TABLE 321 LAMEA Entertainment & Media Market by Country, 2020 - 2023, USD Million
- TABLE 322 LAMEA Entertainment & Media Market by Country, 2024 - 2031, USD Million
- TABLE 323 LAMEA Education & Training Market by Country, 2020 - 2023, USD Million
- TABLE 324 LAMEA Education & Training Market by Country, 2024 - 2031, USD Million
- TABLE 325 LAMEA Healthcare Market by Country, 2020 - 2023, USD Million
- TABLE 326 LAMEA Healthcare Market by Country, 2024 - 2031, USD Million
- TABLE 327 LAMEA Retail & Ecommerce Market by Country, 2020 - 2023, USD Million
- TABLE 328 LAMEA Retail & Ecommerce Market by Country, 2024 - 2031, USD Million
- TABLE 329 LAMEA Automotive Market by Country, 2020 - 2023, USD Million
- TABLE 330 LAMEA Automotive Market by Country, 2024 - 2031, USD Million
- TABLE 331 LAMEA Other End-Use Market by Country, 2020 - 2023, USD Million
- TABLE 332 LAMEA Other End-Use Market by Country, 2024 - 2031, USD Million
- TABLE 333 LAMEA Immersive Content Creation Market by Country, 2020 - 2023, USD Million
- TABLE 334 LAMEA Immersive Content Creation Market by Country, 2024 - 2031, USD Million
- TABLE 335 Brazil Immersive Content Creation Market, 2020 - 2023, USD Million
- TABLE 336 Brazil Immersive Content Creation Market, 2024 - 2031, USD Million
- TABLE 337 Brazil Immersive Content Creation Market by Technology, 2020 - 2023, USD Million
- TABLE 338 Brazil Immersive Content Creation Market by Technology, 2024 - 2031, USD Million
- TABLE 339 Brazil Immersive Content Creation Market by Component, 2020 - 2023, USD Million
- TABLE 340 Brazil Immersive Content Creation Market by Component, 2024 - 2031, USD Million
- TABLE 341 Brazil Immersive Content Creation Market by End-Use, 2020 - 2023, USD Million
- TABLE 342 Brazil Immersive Content Creation Market by End-Use, 2024 - 2031, USD Million
- TABLE 343 Argentina Immersive Content Creation Market, 2020 - 2023, USD Million
- TABLE 344 Argentina Immersive Content Creation Market, 2024 - 2031, USD Million
- TABLE 345 Argentina Immersive Content Creation Market by Technology, 2020 - 2023, USD Million
- TABLE 346 Argentina Immersive Content Creation Market by Technology, 2024 - 2031, USD Million
- TABLE 347 Argentina Immersive Content Creation Market by Component, 2020 - 2023, USD Million
- TABLE 348 Argentina Immersive Content Creation Market by Component, 2024 - 2031, USD Million
- TABLE 349 Argentina Immersive Content Creation Market by End-Use, 2020 - 2023, USD Million
- TABLE 350 Argentina Immersive Content Creation Market by End-Use, 2024 - 2031, USD Million
- TABLE 351 UAE Immersive Content Creation Market, 2020 - 2023, USD Million
- TABLE 352 UAE Immersive Content Creation Market, 2024 - 2031, USD Million
- TABLE 353 UAE Immersive Content Creation Market by Technology, 2020 - 2023, USD Million
- TABLE 354 UAE Immersive Content Creation Market by Technology, 2024 - 2031, USD Million
- TABLE 355 UAE Immersive Content Creation Market by Component, 2020 - 2023, USD Million
- TABLE 356 UAE Immersive Content Creation Market by Component, 2024 - 2031, USD Million
- TABLE 357 UAE Immersive Content Creation Market by End-Use, 2020 - 2023, USD Million
- TABLE 358 UAE Immersive Content Creation Market by End-Use, 2024 - 2031, USD Million
- TABLE 359 Saudi Arabia Immersive Content Creation Market, 2020 - 2023, USD Million
- TABLE 360 Saudi Arabia Immersive Content Creation Market, 2024 - 2031, USD Million
- TABLE 361 Saudi Arabia Immersive Content Creation Market by Technology, 2020 - 2023, USD Million
- TABLE 362 Saudi Arabia Immersive Content Creation Market by Technology, 2024 - 2031, USD Million
- TABLE 363 Saudi Arabia Immersive Content Creation Market by Component, 2020 - 2023, USD Million
- TABLE 364 Saudi Arabia Immersive Content Creation Market by Component, 2024 - 2031, USD Million
- TABLE 365 Saudi Arabia Immersive Content Creation Market by End-Use, 2020 - 2023, USD Million
- TABLE 366 Saudi Arabia Immersive Content Creation Market by End-Use, 2024 - 2031, USD Million
- TABLE 367 South Africa Immersive Content Creation Market, 2020 - 2023, USD Million
- TABLE 368 South Africa Immersive Content Creation Market, 2024 - 2031, USD Million
- TABLE 369 South Africa Immersive Content Creation Market by Technology, 2020 - 2023, USD Million
- TABLE 370 South Africa Immersive Content Creation Market by Technology, 2024 - 2031, USD Million
- TABLE 371 South Africa Immersive Content Creation Market by Component, 2020 - 2023, USD Million
- TABLE 372 South Africa Immersive Content Creation Market by Component, 2024 - 2031, USD Million
- TABLE 373 South Africa Immersive Content Creation Market by End-Use, 2020 - 2023, USD Million
- TABLE 374 South Africa Immersive Content Creation Market by End-Use, 2024 - 2031, USD Million
- TABLE 375 Nigeria Immersive Content Creation Market, 2020 - 2023, USD Million
- TABLE 376 Nigeria Immersive Content Creation Market, 2024 - 2031, USD Million
- TABLE 377 Nigeria Immersive Content Creation Market by Technology, 2020 - 2023, USD Million
- TABLE 378 Nigeria Immersive Content Creation Market by Technology, 2024 - 2031, USD Million
- TABLE 379 Nigeria Immersive Content Creation Market by Component, 2020 - 2023, USD Million
- TABLE 380 Nigeria Immersive Content Creation Market by Component, 2024 - 2031, USD Million
- TABLE 381 Nigeria Immersive Content Creation Market by End-Use, 2020 - 2023, USD Million
- TABLE 382 Nigeria Immersive Content Creation Market by End-Use, 2024 - 2031, USD Million
- TABLE 383 Rest of LAMEA Immersive Content Creation Market, 2020 - 2023, USD Million
- TABLE 384 Rest of LAMEA Immersive Content Creation Market, 2024 - 2031, USD Million
- TABLE 385 Rest of LAMEA Immersive Content Creation Market by Technology, 2020 - 2023, USD Million
- TABLE 386 Rest of LAMEA Immersive Content Creation Market by Technology, 2024 - 2031, USD Million
- TABLE 387 Rest of LAMEA Immersive Content Creation Market by Component, 2020 - 2023, USD Million
- TABLE 388 Rest of LAMEA Immersive Content Creation Market by Component, 2024 - 2031, USD Million
- TABLE 389 Rest of LAMEA Immersive Content Creation Market by End-Use, 2020 - 2023, USD Million
- TABLE 390 Rest of LAMEA Immersive Content Creation Market by End-Use, 2024 - 2031, USD Million
- TABLE 391 Key Information - Unity Software, Inc.
- TABLE 392 Key Information - Meta Platforms, Inc.
- TABLE 393 key Information - Epic Games, Inc.
- TABLE 394 Key Information - Google LLC
- TABLE 395 Key Information - HCL Technologies Ltd.
- TABLE 396 Key Information - HTC Corporation
- TABLE 397 Key Information - Magic Leap, Inc.
- TABLE 398 Key Information - Microsoft Corporation
- TABLE 399 Key Information - NVIDIA Corporation
- TABLE 400 Key Information - Sony Corporation
The Global Immersive Content Creation Market size is expected to reach $63.82 billion by 2031, rising at a market growth of 23.6% CAGR during the forecast period.
Advancements in real-time rendering, graphics, and haptic feedback have revolutionized gaming, making it more engaging for users. The growing popularity of VR headsets, gaming consoles, and mobile gaming platforms has further fueled this segment's growth. The segment is driven by the increasing demand for highly interactive and immersive experiences offered by AR and VR technologies. Hence, the gaming segment witnessed 41% revenue share in the market in 2023. Furthermore, the emergence of esports and multiplayer gaming has fostered a robust community-driven demand for immersive environments, thereby guaranteeing the sustained growth of the gaming sector.
The metaverse has rapidly emerged as a transformative digital space that combines virtual reality (VR), augmented reality (AR), and the internet to create immersive, shared experiences. It has revolutionized interaction, allowing people to socialize, network, and collaborate in highly engaging virtual environments. The metaverse also redefines socializing through virtual events like concerts, exhibitions, and meetups, replicating physical gatherings in a digital format. These events use immersive content creation tools to design realistic venues and interactive elements that enhance audience participation. Additionally, immersive content's ability to collect and analyze user data in real-time enhances its potential for personalization. Advanced algorithms can track user behavior and preferences within immersive environments, allowing brands to refine their offerings and create more relevant experiences. This increases customer satisfaction, drives repeat engagement, and builds a loyal customer base. Thus, as personalization becomes integral to customer expectations, leveraging immersive content will be essential for businesses aiming to stand out in the market and build lasting customer loyalty.
However, despite the rapid advancements in AR and VR technologies, many potential users remain unaware of their applications and benefits. Unlike mainstream technologies, immersive devices often require users to invest time in understanding their functionalities and learning how to use them effectively. This learning curve can deter individuals who may otherwise benefit from AR/VR experiences, especially in sectors like training, gaming, or virtual tourism. Moreover, misconceptions about the complexity or utility of these technologies further contribute to their slow adoption. Thus, until these barriers are overcome, the market's growth will continue to be constrained by limited accessibility and a lack of widespread consumer engagement.
Component Outlook
Based on component, the market is classified into hardware, software, and services. The software segment procured 33% revenue share in the market in 2023. Game development engines, simulation platforms, and enterprise-level applications are key drivers, enabling developers to craft engaging and interactive AR/VR experiences. The rising need for industry-specific solutions, such as virtual training modules in healthcare and employee onboarding programs in corporate settings, has further boosted this segment. Innovations in AI-driven tools and real-time rendering technologies also enhance the software landscape, making it a critical component for scaling immersive content production across industries.
Technology Outlook
On the basis of technology, the market is divided into virtual reality (VR) content, augmented reality (AR) content, mixed reality (MR) content, and others. The virtual reality (VR) content segment acquired 40% revenue share in the market in 2023. The virtual reality (VR) content segment is primarily driven by its ability to create fully immersive environments that enhance user engagement across various industries. In the gaming sector, VR delivers lifelike, interactive experiences that captivate players, while in education and training, VR simulations provide risk-free environments for skill development in areas like healthcare, aviation, and manufacturing. The entertainment industry leverages VR to create immersive films, concerts, and live events, offering users a sense of presence and participation.
End-use Outlook
By end-use, the market is segmented into gaming, entertainment & media, education & training, healthcare, retail & ecommerce, automotive, and others. The healthcare segment procured 10% revenue share in the market in 2023. Immersive simulations enable professionals to practice surgical procedures and complex medical techniques in a risk-free environment, enhancing precision and skill development. For patients, VR is widely used for mental health therapies, pain management, and rehabilitation exercises. The increasing adoption of telemedicine and virtual consultations underscores the potential of immersive content to transform patient care, making it a critical factor in the segment's growth.
Regional Outlook
Region-wise, the market is analyzed across North America, Europe, Asia Pacific, and LAMEA. The North America segment acquired 36% revenue share in the market in 2023. The North American market is propelled by its strong technological infrastructure and the presence of prominent industry leaders, including Meta, Google, and Microsoft. High consumer demand for innovative experiences in gaming, entertainment, and e-commerce fuels the adoption of AR and VR technologies in the region.
Recent Strategies Deployed in the Market
- Dec-2024: Meta Platforms, Inc. has partnered with James Cameron's Lightstorm Vision to enhance 3D content creation for immersive media. The collaboration focuses on advancing stereoscopic technology, improving access to 3D production tools, and co-producing original content for MR headsets, transforming storytelling experiences.
- Sep-2024: Meta Platforms, Inc. has unveiled Orion, its most advanced augmented reality glasses, combining sleek design with immersive AR capabilities. Orion offers large holographic displays, contextual AI, and seamless integration with the physical world, unlocking new possibilities for content creation and interaction.
- Jan-2024: Unity Software Inc. and Walmart have partnered to enable seamless physical commerce within games and virtual apps through Unity's platform. Developers can integrate Walmart's APIs to sell products directly, enhancing user engagement and monetization opportunities.
- Jul-2023: Meta Platforms, Inc. and Microsoft came into partnership to launch Llama 2, an open-source large language model, available for both research and commercial use, aiming to advance generative AI and enhance immersive content creation for developers, businesses, and researchers.
- Jun-2023: Unity Software Inc. launched an AI Marketplace in its Asset Store, offering AI solutions to accelerate game development. The marketplace features tools for asset creation, behavior AI, and gameplay enhancements, supporting immersive, real-time 3D content creation for mobile, PC, and VR platforms.
List of Key Companies Profiled
- Unity Software Inc.
- Meta Platforms, Inc.
- Epic Games, Inc.
- Google LLC (Alphabet Inc.)
- HCL Technologies Ltd.
- HTC Corporation
- Magic Leap, Inc.
- Microsoft Corporation
- NVIDIA Corporation
- Sony Corporation
Global Immersive Content Creation Market Report Segmentation
By Technology
- Virtual Reality (VR) Content
- Augmented Reality (AR) Content
- Mixed Reality (MR) Content
- Other Technology
By Component
- Hardware
- Software
- Services
By End-Use
- Gaming
- Entertainment & Media
- Education & Training
- Healthcare
- Retail & Ecommerce
- Automotive
- Other End-Use
By Geography
- North America
- US
- Canada
- Mexico
- Rest of North America
- Europe
- Germany
- UK
- France
- Russia
- Spain
- Italy
- Rest of Europe
- Asia Pacific
- China
- Japan
- India
- South Korea
- Australia
- Malaysia
- Rest of Asia Pacific
- LAMEA
- Brazil
- Argentina
- UAE
- Saudi Arabia
- South Africa
- Nigeria
- Rest of LAMEA
Table of Contents
Chapter 1. Market Scope & Methodology
- 1.1 Market Definition
- 1.2 Objectives
- 1.3 Market Scope
- 1.4 Segmentation
- 1.4.1 Global Immersive Content Creation Market, by Technology
- 1.4.2 Global Immersive Content Creation Market, by Component
- 1.4.3 Global Immersive Content Creation Market, by End-Use
- 1.4.4 Global Immersive Content Creation Market, by Geography
- 1.5 Methodology for the research
Chapter 2. Market at a Glance
- 2.1 Key Highlights
Chapter 3. Market Overview
- 3.1 Introduction
- 3.1.1 Overview
- 3.1.1.1 Market Composition and Scenario
- 3.1.1 Overview
- 3.2 Key Factors Impacting the Market
- 3.2.1 Market Drivers
- 3.2.2 Market Restraints
- 3.2.3 Market Opportunities
- 3.2.4 Market Challenges
Chapter 4. Competition Analysis - Global
- 4.1 Market Share Analysis, 2023
- 4.2 Strategies Deployed in Immersive Content Creation Market
- 4.3 Porter Five Forces Analysis
Chapter 5. Global Immersive Content Creation Market by Technology
- 5.1 Global Virtual Reality (VR) Content Market by Region
- 5.2 Global Augmented Reality (AR) Content Market by Region
- 5.3 Global Mixed Reality (MR) Content Market by Region
- 5.4 Global Other Technology Market by Region
Chapter 6. Global Immersive Content Creation Market by Component
- 6.1 Global Hardware Market by Region
- 6.2 Global Software Market by Region
- 6.3 Global Services Market by Region
Chapter 7. Global Immersive Content Creation Market by End-Use
- 7.1 Global Gaming Market by Region
- 7.2 Global Entertainment & Media Market by Region
- 7.3 Global Education & Training Market by Region
- 7.4 Global Healthcare Market by Region
- 7.5 Global Retail & Ecommerce Market by Region
- 7.6 Global Automotive Market by Region
- 7.7 Global Other End-Use Market by Region
Chapter 8. Global Immersive Content Creation Market by Region
- 8.1 North America Immersive Content Creation Market
- 8.1.1 North America Immersive Content Creation Market by Technology
- 8.1.1.1 North America Virtual Reality (VR) Content Market by Country
- 8.1.1.2 North America Augmented Reality (AR) Content Market by Country
- 8.1.1.3 North America Mixed Reality (MR) Content Market by Country
- 8.1.1.4 North America Other Technology Market by Country
- 8.1.2 North America Immersive Content Creation Market by Component
- 8.1.2.1 North America Hardware Market by Country
- 8.1.2.2 North America Software Market by Country
- 8.1.2.3 North America Services Market by Country
- 8.1.3 North America Immersive Content Creation Market by End-Use
- 8.1.3.1 North America Gaming Market by Country
- 8.1.3.2 North America Entertainment & Media Market by Country
- 8.1.3.3 North America Education & Training Market by Country
- 8.1.3.4 North America Healthcare Market by Country
- 8.1.3.5 North America Retail & Ecommerce Market by Country
- 8.1.3.6 North America Automotive Market by Country
- 8.1.3.7 North America Other End-Use Market by Country
- 8.1.4 North America Immersive Content Creation Market by Country
- 8.1.4.1 US Immersive Content Creation Market
- 8.1.4.1.1 US Immersive Content Creation Market by Technology
- 8.1.4.1.2 US Immersive Content Creation Market by Component
- 8.1.4.1.3 US Immersive Content Creation Market by End-Use
- 8.1.4.2 Canada Immersive Content Creation Market
- 8.1.4.2.1 Canada Immersive Content Creation Market by Technology
- 8.1.4.2.2 Canada Immersive Content Creation Market by Component
- 8.1.4.2.3 Canada Immersive Content Creation Market by End-Use
- 8.1.4.3 Mexico Immersive Content Creation Market
- 8.1.4.3.1 Mexico Immersive Content Creation Market by Technology
- 8.1.4.3.2 Mexico Immersive Content Creation Market by Component
- 8.1.4.3.3 Mexico Immersive Content Creation Market by End-Use
- 8.1.4.4 Rest of North America Immersive Content Creation Market
- 8.1.4.4.1 Rest of North America Immersive Content Creation Market by Technology
- 8.1.4.4.2 Rest of North America Immersive Content Creation Market by Component
- 8.1.4.4.3 Rest of North America Immersive Content Creation Market by End-Use
- 8.1.4.1 US Immersive Content Creation Market
- 8.1.1 North America Immersive Content Creation Market by Technology
- 8.2 Europe Immersive Content Creation Market
- 8.2.1 Europe Immersive Content Creation Market by Technology
- 8.2.1.1 Europe Virtual Reality (VR) Content Market by Country
- 8.2.1.2 Europe Augmented Reality (AR) Content Market by Country
- 8.2.1.3 Europe Mixed Reality (MR) Content Market by Country
- 8.2.1.4 Europe Other Technology Market by Country
- 8.2.2 Europe Immersive Content Creation Market by Component
- 8.2.2.1 Europe Hardware Market by Country
- 8.2.2.2 Europe Software Market by Country
- 8.2.2.3 Europe Services Market by Country
- 8.2.3 Europe Immersive Content Creation Market by End-Use
- 8.2.3.1 Europe Gaming Market by Country
- 8.2.3.2 Europe Entertainment & Media Market by Country
- 8.2.3.3 Europe Education & Training Market by Country
- 8.2.3.4 Europe Healthcare Market by Country
- 8.2.3.5 Europe Retail & Ecommerce Market by Country
- 8.2.3.6 Europe Automotive Market by Country
- 8.2.3.7 Europe Other End-Use Market by Country
- 8.2.4 Europe Immersive Content Creation Market by Country
- 8.2.4.1 Germany Immersive Content Creation Market
- 8.2.4.1.1 Germany Immersive Content Creation Market by Technology
- 8.2.4.1.2 Germany Immersive Content Creation Market by Component
- 8.2.4.1.3 Germany Immersive Content Creation Market by End-Use
- 8.2.4.2 UK Immersive Content Creation Market
- 8.2.4.2.1 UK Immersive Content Creation Market by Technology
- 8.2.4.2.2 UK Immersive Content Creation Market by Component
- 8.2.4.2.3 UK Immersive Content Creation Market by End-Use
- 8.2.4.3 France Immersive Content Creation Market
- 8.2.4.3.1 France Immersive Content Creation Market by Technology
- 8.2.4.3.2 France Immersive Content Creation Market by Component
- 8.2.4.3.3 France Immersive Content Creation Market by End-Use
- 8.2.4.4 Russia Immersive Content Creation Market
- 8.2.4.4.1 Russia Immersive Content Creation Market by Technology
- 8.2.4.4.2 Russia Immersive Content Creation Market by Component
- 8.2.4.4.3 Russia Immersive Content Creation Market by End-Use
- 8.2.4.5 Spain Immersive Content Creation Market
- 8.2.4.5.1 Spain Immersive Content Creation Market by Technology
- 8.2.4.5.2 Spain Immersive Content Creation Market by Component
- 8.2.4.5.3 Spain Immersive Content Creation Market by End-Use
- 8.2.4.6 Italy Immersive Content Creation Market
- 8.2.4.6.1 Italy Immersive Content Creation Market by Technology
- 8.2.4.6.2 Italy Immersive Content Creation Market by Component
- 8.2.4.6.3 Italy Immersive Content Creation Market by End-Use
- 8.2.4.7 Rest of Europe Immersive Content Creation Market
- 8.2.4.7.1 Rest of Europe Immersive Content Creation Market by Technology
- 8.2.4.7.2 Rest of Europe Immersive Content Creation Market by Component
- 8.2.4.7.3 Rest of Europe Immersive Content Creation Market by End-Use
- 8.2.4.1 Germany Immersive Content Creation Market
- 8.2.1 Europe Immersive Content Creation Market by Technology
- 8.3 Asia Pacific Immersive Content Creation Market
- 8.3.1 Asia Pacific Immersive Content Creation Market by Technology
- 8.3.1.1 Asia Pacific Virtual Reality (VR) Content Market by Country
- 8.3.1.2 Asia Pacific Augmented Reality (AR) Content Market by Country
- 8.3.1.3 Asia Pacific Mixed Reality (MR) Content Market by Country
- 8.3.1.4 Asia Pacific Other Technology Market by Country
- 8.3.2 Asia Pacific Immersive Content Creation Market by Component
- 8.3.2.1 Asia Pacific Hardware Market by Country
- 8.3.2.2 Asia Pacific Software Market by Country
- 8.3.2.3 Asia Pacific Services Market by Country
- 8.3.3 Asia Pacific Immersive Content Creation Market by End-Use
- 8.3.3.1 Asia Pacific Gaming Market by Country
- 8.3.3.2 Asia Pacific Entertainment & Media Market by Country
- 8.3.3.3 Asia Pacific Education & Training Market by Country
- 8.3.3.4 Asia Pacific Healthcare Market by Country
- 8.3.3.5 Asia Pacific Retail & Ecommerce Market by Country
- 8.3.3.6 Asia Pacific Automotive Market by Country
- 8.3.3.7 Asia Pacific Other End-Use Market by Country
- 8.3.4 Asia Pacific Immersive Content Creation Market by Country
- 8.3.4.1 China Immersive Content Creation Market
- 8.3.4.1.1 China Immersive Content Creation Market by Technology
- 8.3.4.1.2 China Immersive Content Creation Market by Component
- 8.3.4.1.3 China Immersive Content Creation Market by End-Use
- 8.3.4.2 Japan Immersive Content Creation Market
- 8.3.4.2.1 Japan Immersive Content Creation Market by Technology
- 8.3.4.2.2 Japan Immersive Content Creation Market by Component
- 8.3.4.2.3 Japan Immersive Content Creation Market by End-Use
- 8.3.4.3 India Immersive Content Creation Market
- 8.3.4.3.1 India Immersive Content Creation Market by Technology
- 8.3.4.3.2 India Immersive Content Creation Market by Component
- 8.3.4.3.3 India Immersive Content Creation Market by End-Use
- 8.3.4.4 South Korea Immersive Content Creation Market
- 8.3.4.4.1 South Korea Immersive Content Creation Market by Technology
- 8.3.4.4.2 South Korea Immersive Content Creation Market by Component
- 8.3.4.4.3 South Korea Immersive Content Creation Market by End-Use
- 8.3.4.5 Australia Immersive Content Creation Market
- 8.3.4.5.1 Australia Immersive Content Creation Market by Technology
- 8.3.4.5.2 Australia Immersive Content Creation Market by Component
- 8.3.4.5.3 Australia Immersive Content Creation Market by End-Use
- 8.3.4.6 Malaysia Immersive Content Creation Market
- 8.3.4.6.1 Malaysia Immersive Content Creation Market by Technology
- 8.3.4.6.2 Malaysia Immersive Content Creation Market by Component
- 8.3.4.6.3 Malaysia Immersive Content Creation Market by End-Use
- 8.3.4.7 Rest of Asia Pacific Immersive Content Creation Market
- 8.3.4.7.1 Rest of Asia Pacific Immersive Content Creation Market by Technology
- 8.3.4.7.2 Rest of Asia Pacific Immersive Content Creation Market by Component
- 8.3.4.7.3 Rest of Asia Pacific Immersive Content Creation Market by End-Use
- 8.3.4.1 China Immersive Content Creation Market
- 8.3.1 Asia Pacific Immersive Content Creation Market by Technology
- 8.4 LAMEA Immersive Content Creation Market
- 8.4.1 LAMEA Immersive Content Creation Market by Technology
- 8.4.1.1 LAMEA Virtual Reality (VR) Content Market by Country
- 8.4.1.2 LAMEA Augmented Reality (AR) Content Market by Country
- 8.4.1.3 LAMEA Mixed Reality (MR) Content Market by Country
- 8.4.1.4 LAMEA Other Technology Market by Country
- 8.4.2 LAMEA Immersive Content Creation Market by Component
- 8.4.2.1 LAMEA Hardware Market by Country
- 8.4.2.2 LAMEA Software Market by Country
- 8.4.2.3 LAMEA Services Market by Country
- 8.4.3 LAMEA Immersive Content Creation Market by End-Use
- 8.4.3.1 LAMEA Gaming Market by Country
- 8.4.3.2 LAMEA Entertainment & Media Market by Country
- 8.4.3.3 LAMEA Education & Training Market by Country
- 8.4.3.4 LAMEA Healthcare Market by Country
- 8.4.3.5 LAMEA Retail & Ecommerce Market by Country
- 8.4.3.6 LAMEA Automotive Market by Country
- 8.4.3.7 LAMEA Other End-Use Market by Country
- 8.4.4 LAMEA Immersive Content Creation Market by Country
- 8.4.4.1 Brazil Immersive Content Creation Market
- 8.4.4.1.1 Brazil Immersive Content Creation Market by Technology
- 8.4.4.1.2 Brazil Immersive Content Creation Market by Component
- 8.4.4.1.3 Brazil Immersive Content Creation Market by End-Use
- 8.4.4.2 Argentina Immersive Content Creation Market
- 8.4.4.2.1 Argentina Immersive Content Creation Market by Technology
- 8.4.4.2.2 Argentina Immersive Content Creation Market by Component
- 8.4.4.2.3 Argentina Immersive Content Creation Market by End-Use
- 8.4.4.3 UAE Immersive Content Creation Market
- 8.4.4.3.1 UAE Immersive Content Creation Market by Technology
- 8.4.4.3.2 UAE Immersive Content Creation Market by Component
- 8.4.4.3.3 UAE Immersive Content Creation Market by End-Use
- 8.4.4.4 Saudi Arabia Immersive Content Creation Market
- 8.4.4.4.1 Saudi Arabia Immersive Content Creation Market by Technology
- 8.4.4.4.2 Saudi Arabia Immersive Content Creation Market by Component
- 8.4.4.4.3 Saudi Arabia Immersive Content Creation Market by End-Use
- 8.4.4.5 South Africa Immersive Content Creation Market
- 8.4.4.5.1 South Africa Immersive Content Creation Market by Technology
- 8.4.4.5.2 South Africa Immersive Content Creation Market by Component
- 8.4.4.5.3 South Africa Immersive Content Creation Market by End-Use
- 8.4.4.6 Nigeria Immersive Content Creation Market
- 8.4.4.6.1 Nigeria Immersive Content Creation Market by Technology
- 8.4.4.6.2 Nigeria Immersive Content Creation Market by Component
- 8.4.4.6.3 Nigeria Immersive Content Creation Market by End-Use
- 8.4.4.7 Rest of LAMEA Immersive Content Creation Market
- 8.4.4.7.1 Rest of LAMEA Immersive Content Creation Market by Technology
- 8.4.4.7.2 Rest of LAMEA Immersive Content Creation Market by Component
- 8.4.4.7.3 Rest of LAMEA Immersive Content Creation Market by End-Use
- 8.4.4.1 Brazil Immersive Content Creation Market
- 8.4.1 LAMEA Immersive Content Creation Market by Technology
Chapter 9. Company Profiles
- 9.1 Unity Software, Inc.
- 9.1.1 Company Overview
- 9.1.2 Financial Analysis
- 9.1.3 Segmental and Regional Analysis
- 9.1.4 Research & Development Expenses
- 9.1.5 Recent strategies and developments:
- 9.1.5.1 Partnerships, Collaborations, and Agreements:
- 9.1.5.2 Product Launches and Product Expansions:
- 9.2 Meta Platforms, Inc.
- 9.2.1 Company Overview
- 9.2.2 Financial Analysis
- 9.2.3 Segment and Regional Analysis
- 9.2.4 Research & Development Expense
- 9.2.5 Recent strategies and developments:
- 9.2.5.1 Partnerships, Collaborations, and Agreements:
- 9.2.5.2 Product Launches and Product Expansions:
- 9.2.6 SWOT Analysis
- 9.3 Epic Games, Inc.
- 9.3.1 Company Overview
- 9.3.2 Recent strategies and developments:
- 9.3.2.1 Partnerships, Collaborations, and Agreements:
- 9.3.3 SWOT Analysis
- 9.4 Google LLC (Alphabet Inc.)
- 9.4.1 Company Overview
- 9.4.2 Financial Analysis
- 9.4.3 Segmental and Regional Analysis
- 9.4.4 Research & Development Expense
- 9.4.5 SWOT Analysis
- 9.5 HCL Technologies Ltd. (HCL Enterprises)
- 9.5.1 Company Overview
- 9.5.2 Financial Analysis
- 9.5.3 Segmental and Regional Analysis
- 9.5.4 Research & Development Expenses
- 9.5.5 SWOT Analysis
- 9.6 HTC Corporation
- 9.6.1 Company Overview
- 9.6.2 Financial Analysis
- 9.6.3 Research & Development Expenses
- 9.6.4 SWOT Analysis
- 9.7 Magic Leap, Inc.
- 9.7.1 Company Overview
- 9.7.2 SWOT Analysis
- 9.8 Microsoft Corporation
- 9.8.1 Company Overview
- 9.8.2 Financial Analysis
- 9.8.3 Segmental and Regional Analysis
- 9.8.4 Research & Development Expenses
- 9.8.5 SWOT Analysis
- 9.9 NVIDIA Corporation
- 9.9.1 Company Overview
- 9.9.2 Financial Analysis
- 9.9.3 Segmental and Regional Analysis
- 9.9.4 Research & Development Expenses
- 9.9.5 SWOT Analysis
- 9.10. Sony Corporation
- 9.10.1 Company Overview
- 9.10.2 Financial Analysis
- 9.10.3 Segmental and Regional Analysis
- 9.10.4 Research & Development Expenses
- 9.10.5 SWOT Analysis
