|
|
市場調査レポート
商品コード
1738930
VRコンテンツ制作の世界市場 - 市場シェアとランキング、全体の売上、需要の予測(2025年~2031年)VR Content Creation - Global Market Share and Ranking, Overall Sales and Demand Forecast 2025-2031 |
||||||
|
|||||||
カスタマイズ可能
適宜更新あり
|
|||||||

| VRコンテンツ制作の世界市場 - 市場シェアとランキング、全体の売上、需要の予測(2025年~2031年) |
|
出版日: 2025年06月03日
発行: QYResearch
ページ情報: 英文 144 Pages
納期: 2~3営業日
|

全表示
- 概要
- 図表
- 目次
世界のVRコンテンツ制作の市場規模は、2024年に4億9,620万米ドルであり、2031年までに32億5,496万米ドルに達すると予測され、予測期間の2025年~2031年にCAGRで33.86%の成長が見込まれます。
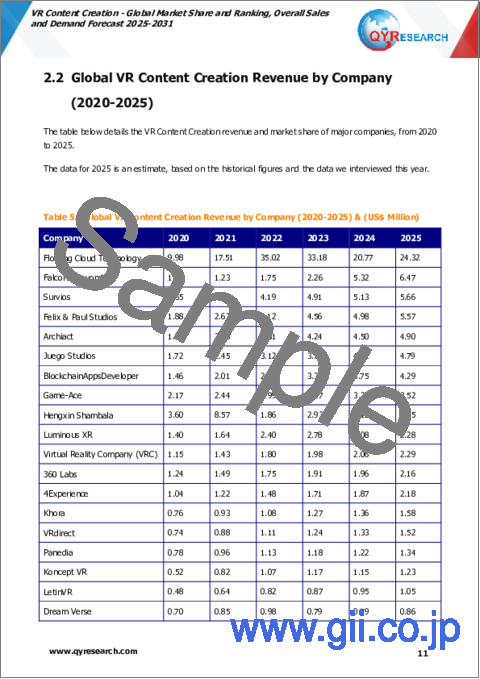
世界のVRコンテンツ制作の主要企業は、Flowing Cloud Technology、Falcon's Beyond、Survios、Felix & Paul Studios、Archiact、Juego Studios、BlockchainAppsDeveloper、Game-Ace、Hengxin Shambalaなどです。2024年、世界の上位5社が収益で約8%のシェアを占めました。市場の集中度は非常に低く、市場には多くの小企業が存在します。
当レポートでは、世界のVRコンテンツ制作市場について調査分析し、各地域の市場規模と予測、主要企業のランキング、市場シェアなどの情報を提供しています。
目次
第1章 市場の概要
- VRコンテンツ制作製品のイントロダクション
- 世界のVRコンテンツ制作の市場規模の予測(2020年~2031年)
- VRコンテンツ制作市場の動向と促進要因
- VRコンテンツ制作産業の動向
- VRコンテンツ制作市場の促進要因と機会
- VRコンテンツ制作市場の課題
- VRコンテンツ制作市場の抑制要因
- 前提条件と制限
- 調査目的
- 考慮される年数
第2章 競合分析:企業別
- 世界のVRコンテンツ制作企業の収益ランキング(2024年)
- 世界のVRコンテンツ制作の収益:企業別(2020年~2025年)
- 主要企業のVRコンテンツ制作本部
- 主要企業のVRコンテンツ制作用途
- VRコンテンツ制作の主要企業の設立日
- VRコンテンツ制作市場の競合分析
- VRコンテンツ制作の市場集中度(2020年~2025年)
- 世界のVRコンテンツ制作の収益における5大・10大企業(2024年)
- 世界の主要企業:企業タイプ別(Tier 1・Tier 2・Tier 3)(2024年時点のVRコンテンツ制作の収益に基づく)
第3章 セグメント:顧客別
- イントロダクション:顧客別
- 2B
- 2C
- 世界のVRコンテンツ制作の売上金額:顧客別
- 世界のVRコンテンツ制作の売上金額:顧客別(2020年・2024年・2031年)
- 世界のVRコンテンツ制作の売上金額:顧客別(2020年~2031年)
- 世界のVRコンテンツ制作の売上金額:顧客別(2020年~2031年)
第4章 セグメント:用途別
- イントロダクション:用途別
- ゲーム
- フィルム・テレビ
- 医療
- 教育
- その他
- 世界のVRコンテンツ制作の売上金額:用途別
- 世界のVRコンテンツ制作の売上金額:用途別(2020年・2024年・2031年)
- 世界のVRコンテンツ制作の売上金額:用途別(2020年~2031年)
- 世界のVRコンテンツ制作の売上金額:用途別(2020年~2031年)
第5章 セグメント:地域別
- 世界のVRコンテンツ制作の売上金額:地域別
- 世界のVRコンテンツ制作の売上金額:地域別(2020年・2024年・2031年)
- 世界のVRコンテンツ制作の売上金額:地域別(2020年~2025年)
- 世界のVRコンテンツ制作の売上金額:地域別(2026年~2031年)
- 世界のVRコンテンツ制作の売上金額:地域別(2020年~2031年)
- 北米
- 北米のVRコンテンツ制作の売上金額(2020年~2031年)
- 北米のVRコンテンツ制作の売上金額:国別(2024年・2031年)
- 欧州
- 欧州のVRコンテンツ制作の売上金額(2020年~2031年)
- 欧州のVRコンテンツ制作の売上金額:国別(2024年・2031年)
- アジア太平洋
- アジア太平洋のVRコンテンツ制作の売上金額(2020年~2031年)
- アジア太平洋のVRコンテンツ制作の売上金額:地域別(2024年・2031年)
- 南米
- 南米のVRコンテンツ制作の売上金額(2020年~2031年)
- 南米のVRコンテンツ制作の売上金額:国別(2024年・2031年)
- 中東・アフリカ
- 中東・アフリカのVRコンテンツ制作の売上金額(2020年~2031年)
- 中東・アフリカのVRコンテンツ制作の売上金額:国別(2024年・2031年)
第6章 セグメント:主要国/地域別
- 主要国/地域のVRコンテンツ制作の売上金額成長動向(2020年・2024年・2031年)
- 主要国/地域のVRコンテンツ制作の売上金額(2020年~2031年)
- 米国
- 米国のVRコンテンツ制作の売上金額(2020年~2031年)
- 米国のVRコンテンツ制作の売上金額:顧客別(2024年・2031年)
- 米国のVRコンテンツ制作の売上金額:用途別(2024年・2031年)
- 欧州
- 欧州のVRコンテンツ制作の売上金額(2020年~2031年)
- 欧州のVRコンテンツ制作の売上金額:顧客別(2024年・2031年)
- 欧州のVRコンテンツ制作の売上金額:用途別(2024年・2031年)
- 中国
- 中国のVRコンテンツ制作の売上金額(2020年~2031年)
- 中国のVRコンテンツ制作の売上金額:顧客別(2024年・2031年)
- 中国のVRコンテンツ制作の売上金額:用途別(2024年・2031年)
- 日本
- 日本のVRコンテンツ制作の売上金額(2020年~2031年)
- 日本のVRコンテンツ制作の売上金額:顧客別(2024年・2031年)
- 日本のVRコンテンツ制作の売上金額:用途別(2024年・2031年)
- 韓国
- 韓国のVRコンテンツ制作の売上金額(2020年~2031年)
- 韓国のVRコンテンツ制作の売上金額:顧客別(2024年・2031年)
- 韓国のVRコンテンツ制作の売上金額:用途別(2024年・2031年)
- 東南アジア
- 東南アジアのVRコンテンツ制作の売上金額(2020年~2031年)
- 東南アジアのVRコンテンツ制作の売上金額:顧客別(2024年・2031年)
- 東南アジアのVRコンテンツ制作の売上金額:用途別(2024年・2031年)
- インド
- インドのVRコンテンツ制作の売上金額(2020年~2031年)
- インドのVRコンテンツ制作の売上金額:顧客別(2024年・2031年)
- インドのVRコンテンツ制作の売上金額:用途別(2024年・2031年)
第7章 企業プロファイル
- Flowing Cloud Technology
- Falcon's Beyond
- Survios
- Felix & Paul Studios
- Archiact
- Juego Studios
- BlockchainAppsDeveloper
- Game-Ace
- Hengxin Shambala
- Luminous XR
- Virtual Reality Company (VRC)
- 360 Labs
- 4Experience
- Khora
- VRdirect
- Panedia
- Koncept VR
- LetinVR
- Dream Verse (iQIYI)
- 2nd.SIDE
- WHITESTAG
- Tsumiki Seisaku
- Silkroad Visual
- Liquona
- Avventura
第8章 産業チェーン分析
- VRコンテンツ制作の産業チェーン
- VRコンテンツ制作の上流分析
- 上流製品
- 上流の主要サプライヤー
- 中流分析
- 下流分析(顧客分析)
第9章 調査結果と結論
第10章 付録
List of Tables
- Table 1. VR Content Creation Market Trends
- Table 2. VR Content Creation Market Drivers & Opportunity
- Table 3. VR Content Creation Market Challenges
- Table 4. VR Content Creation Market Restraints
- Table 5. Global VR Content Creation Revenue by Company (2020-2025) & (US$ Million)
- Table 6. Global VR Content Creation Revenue Market Share by Company (2020-2025)
- Table 7. Key Companies VR Content Creation Headquarter
- Table 8. Key Companies VR Content Creation Application
- Table 9. Key VR Content Creation Companies Established Time
- Table 10. Global VR Content Creation Companies Market Concentration Ratio (CR5 and HHI)
- Table 11. Global Top Companies by Company Type (Tier 1, Tier 2, and Tier 3) & (based on the Revenue in VR Content Creation as of 2024)
- Table 12. Global VR Content Creation Sales Value by Customer: 2020 VS 2024 VS 2031 (US$ Million)
- Table 13. Global VR Content Creation Sales Value by Customer (2020-2025) & (US$ Million)
- Table 14. Global VR Content Creation Sales Value by Customer (2026-2031) & (US$ Million)
- Table 15. Global VR Content Creation Sales Market Share in Value by Customer (2020-2025)
- Table 16. Global VR Content Creation Sales Market Share in Value by Customer (2026-2031)
- Table 17. Global VR Content Creation Sales Value by Application: 2020 VS 2024 VS 2031 (US$ Million)
- Table 18. Global VR Content Creation Sales Value by Application (2020-2025) & (US$ Million)
- Table 19. Global VR Content Creation Sales Value by Application (2026-2031) & (US$ Million)
- Table 20. Global VR Content Creation Sales Market Share in Value by Application (2020-2025)
- Table 21. Global VR Content Creation Sales Market Share in Value by Application (2026-2031)
- Table 22. Global VR Content Creation Sales Value by Region, (2020 VS 2024 VS 2031) & (US$ Million)
- Table 23. Global VR Content Creation Sales Value by Region (2020-2025) & (US$ Million)
- Table 24. Global VR Content Creation Sales Value by Region (2026-2031) & (US$ Million)
- Table 25. Global VR Content Creation Sales Value by Region (2020-2025) & (%)
- Table 26. Global VR Content Creation Sales Value by Region (2026-2031) & (%)
- Table 27. Key Countries/Regions VR Content Creation Sales Value Growth Trends, (US$ Million): 2020 VS 2024 VS 2031
- Table 28. Key Countries/Regions VR Content Creation Sales Value, (2020-2025) & (US$ Million)
- Table 29. Key Countries/Regions VR Content Creation Sales Value, (2026-2031) & (US$ Million)
- Table 30. Flowing Cloud Technology Basic Information List
- Table 31. Flowing Cloud Technology Description and Business Overview
- Table 32. Flowing Cloud Technology VR Content Creation Service/Projects
- Table 33. Revenue (US$ Million) in VR Content Creation Business of Flowing Cloud Technology (2020-2025)
- Table 34. Falcon's Beyond Basic Information List
- Table 35. Falcon's Beyond Description and Business Overview
- Table 36. Falcon's Beyond VR Content Creation Service/Projects
- Table 37. Revenue (US$ Million) in VR Content Creation Business of Falcon's Beyond (2020-2025)
- Table 38. Falcon's Beyond Recent Developments
- Table 39. Survios Basic Information List
- Table 40. Survios Description and Business Overview
- Table 41. Survios VR Content Creation Service/Projects
- Table 42. Revenue (US$ Million) in VR Content Creation Business of Survios (2020-2025)
- Table 43. Survios Recent Developments
- Table 44. Felix & Paul Studios Basic Information List
- Table 45. Felix & Paul Studios Description and Business Overview
- Table 46. Felix & Paul Studios VR Content Creation Service/Projects
- Table 47. Revenue (US$ Million) in VR Content Creation Business of Felix & Paul Studios (2020-2025)
- Table 48. Archiact Basic Information List
- Table 49. Archiact Description and Business Overview
- Table 50. Archiact VR Content Creation Service/Projects
- Table 51. Revenue (US$ Million) in VR Content Creation Business of Archiact (2020-2025)
- Table 52. Archiact Recent Developments
- Table 53. Juego Studios Basic Information List
- Table 54. Juego Studios Description and Business Overview
- Table 55. Juego Studios VR Content Creation Service/Projects
- Table 56. Revenue (US$ Million) in VR Content Creation Business of Juego Studios (2020-2025)
- Table 57. BlockchainAppsDeveloper Basic Information List
- Table 58. BlockchainAppsDeveloper Description and Business Overview
- Table 59. BlockchainAppsDeveloper VR Content Creation Service/Projects
- Table 60. Revenue (US$ Million) in VR Content Creation Business of BlockchainAppsDeveloper (2020-2025)
- Table 61. Game-Ace Basic Information List
- Table 62. Game-Ace Description and Business Overview
- Table 63. Game-Ace VR Content Creation Service/Projects
- Table 64. Revenue (US$ Million) in VR Content Creation Business of Game-Ace (2020-2025)
- Table 65. Hengxin Shambala Basic Information List
- Table 66. Hengxin Shambala Description and Business Overview
- Table 67. Hengxin Shambala VR Content Creation Service/Projects
- Table 68. Revenue (US$ Million) in VR Content Creation Business of Hengxin Shambala (2020-2025)
- Table 69. Luminous XR Basic Information List
- Table 70. Luminous XR Description and Business Overview
- Table 71. Luminous XR VR Content Creation Service/Projects
- Table 72. Revenue (US$ Million) in VR Content Creation Business of Luminous XR (2020-2025)
- Table 73. Luminous XR Recent Developments
- Table 74. Virtual Reality Company (VRC) Basic Information List
- Table 75. Virtual Reality Company (VRC) Description and Business Overview
- Table 76. Virtual Reality Company (VRC) VR Content Creation Service/Projects
- Table 77. Revenue (US$ Million) in VR Content Creation Business of Virtual Reality Company (VRC) (2020-2025)
- Table 78. 360 Labs Basic Information List
- Table 79. 360 Labs Description and Business Overview
- Table 80. 360 Labs VR Content Creation Service/Projects
- Table 81. Revenue (US$ Million) in VR Content Creation Business of 360 Labs (2020-2025)
- Table 82. 4Experience Basic Information List
- Table 83. 4Experience Description and Business Overview
- Table 84. 4Experience VR Content Creation Service/Projects
- Table 85. Revenue (US$ Million) in VR Content Creation Business of 4Experience (2020-2025)
- Table 86. Khora Basic Information List
- Table 87. Khora Description and Business Overview
- Table 88. Khora VR Content Creation Service/Projects
- Table 89. Revenue (US$ Million) in VR Content Creation Business of Khora (2020-2025)
- Table 90. VRdirect Basic Information List
- Table 91. VRdirect Description and Business Overview
- Table 92. VRdirect VR Content Creation Service/Projects
- Table 93. Revenue (US$ Million) in VR Content Creation Business of VRdirect (2020-2025)
- Table 94. Panedia Basic Information List
- Table 95. Panedia Description and Business Overview
- Table 96. Panedia VR Content Creation Service/Projects
- Table 97. Revenue (US$ Million) in VR Content Creation Business of Panedia (2020-2025)
- Table 98. Koncept VR Basic Information List
- Table 99. Koncept VR Description and Business Overview
- Table 100. Koncept VR VR Content Creation Service/Projects
- Table 101. Revenue (US$ Million) in VR Content Creation Business of Koncept VR (2020-2025)
- Table 102. LetinVR Basic Information List
- Table 103. LetinVR Description and Business Overview
- Table 104. LetinVR VR Content Creation Service/Projects
- Table 105. Revenue (US$ Million) in VR Content Creation Business of LetinVR (2020-2025)
- Table 106. Dream Verse Basic Information List
- Table 107. Dream Verse Description and Business Overview
- Table 108. Dream Verse VR Content Creation Service/Projects
- Table 109. Revenue (US$ Million) in VR Content Creation Business of Dream Verse (2020-2025)
- Table 110. Dream Verse Recent Developments
- Table 111. 2nd.SIDE Basic Information List
- Table 112. 2nd.SIDE Description and Business Overview
- Table 113. 2nd.SIDE VR Content Creation Service/Projects
- Table 114. Revenue (US$ Million) in VR Content Creation Business of 2nd.SIDE (2020-2025)
- Table 115. WHITESTAG Basic Information List
- Table 116. WHITESTAG Description and Business Overview
- Table 117. WHITESTAG VR Content Creation Service/Projects
- Table 118. Revenue (US$ Million) in VR Content Creation Business of WHITESTAG (2020-2025)
- Table 119. Tsumiki Seisaku Basic Information List
- Table 120. Tsumiki Seisaku Description and Business Overview
- Table 121. Tsumiki Seisaku VR Content Creation Service/Projects
- Table 122. Revenue (US$ Million) in VR Content Creation Business of Tsumiki Seisaku (2020-2025)
- Table 123. Silkroad Visual Basic Information List
- Table 124. Silkroad Visual Description and Business Overview
- Table 125. Silkroad Visual VR Content Creation Service/Projects
- Table 126. Revenue (US$ Million) in VR Content Creation Business of Silkroad Visual (2020-2025)
- Table 127. Liquona Basic Information List
- Table 128. Liquona Description and Business Overview
- Table 129. Liquona VR Content Creation Service/Projects
- Table 130. Revenue (US$ Million) in VR Content Creation Business of Liquona (2020-2025)
- Table 131. Avventura Basic Information List
- Table 132. Avventura Description and Business Overview
- Table 133. Avventura VR Content Creation Service/Projects
- Table 134. Revenue (US$ Million) in VR Content Creation Business of Avventura (2020-2025)
- Table 135. Key Upstream Products Lists
- Table 136. Upstream Key Suppliers Lists
- Table 137. VR Content Creation Downstream Customers
- Table 138. Research Programs/Design for This Report
- Table 139. Key Data Information from Secondary Sources
- Table 140. Key Data Information from Primary Sources
List of Figures
- Figure 1. Global VR Content Creation Sales Value, 2020 VS 2024 VS 2031 (US$ Million)
- Figure 2. Global VR Content Creation Sales Value (2020-2031) & (US$ Million)
- Figure 3. VR Content Creation Report Years Considered
- Figure 4. Global VR Content Creation Players Revenue Ranking (2024) & (US$ Million)
- Figure 5. The 5 and 10 Largest Companies in the World: Market Share by VR Content Creation Revenue in 2024
- Figure 6. VR Content Creation Market Share by Company Type (Tier 1, Tier 2, and Tier 3): 2020 VS 2024
- Figure 7. Global VR Content Creation Sales Value Market Share by Customer, 2024 & 2031
- Figure 8. Product Picture of Games
- Figure 9. Product Picture of Film and TV
- Figure 10. Product Picture of Medical
- Figure 11. Product Picture of Education
- Figure 12. Product Picture of Others
- Figure 13. Global VR Content Creation Sales Value Market Share by Application, 2024 & 2031
- Figure 14. North America VR Content Creation Sales Value (2020-2031) & (US$ Million)
- Figure 15. North America VR Content Creation Sales Value by Country (%), 2024 VS 2031
- Figure 16. Europe VR Content Creation Sales Value, (2020-2031) & (US$ Million)
- Figure 17. Europe VR Content Creation Sales Value by Country (%), 2024 VS 2031
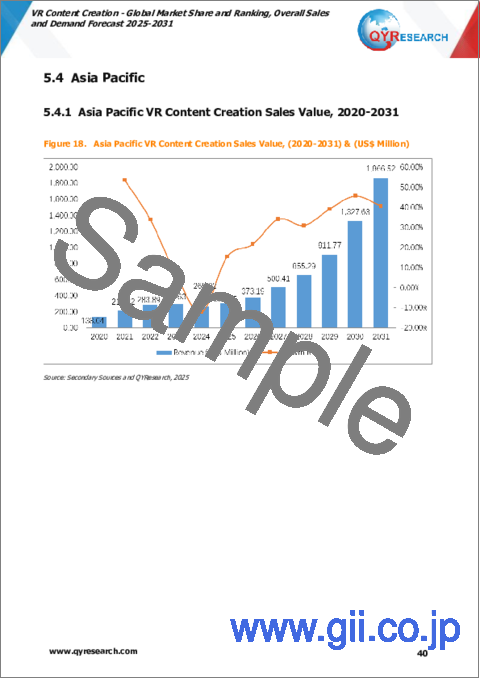
- Figure 18. Asia Pacific VR Content Creation Sales Value, (2020-2031) & (US$ Million)
- Figure 19. Asia Pacific VR Content Creation Sales Value by Region (%), 2024 VS 2031
- Figure 20. South America VR Content Creation Sales Value, (2020-2031) & (US$ Million)
- Figure 21. South America VR Content Creation Sales Value by Country (%), 2024 VS 2031
- Figure 22. Middle East & Africa VR Content Creation Sales Value, (2020-2031) & (US$ Million)
- Figure 23. Middle East & Africa VR Content Creation Sales Value by Country (%), 2024 VS 2031
- Figure 24. USA VR Content Creation Sales Value, (2020-2031) & (US$ Million)
- Figure 25. USA VR Content Creation Sales Value by Customer (%), 2024 VS 2031
- Figure 26. USA VR Content Creation Sales Value by Application (%), 2024 VS 2031
- Figure 27. Europe VR Content Creation Sales Value, (2020-2031) & (US$ Million)
- Figure 28. Europe VR Content Creation Sales Value by Customer (%), 2024 VS 2031
- Figure 29. Europe VR Content Creation Sales Value by Application (%), 2024 VS 2031
- Figure 30. China VR Content Creation Sales Value, (2020-2031) & (US$ Million)
- Figure 31. China VR Content Creation Sales Value by Customer (%), 2024 VS 2031
- Figure 32. China VR Content Creation Sales Value by Application (%), 2024 VS 2031
- Figure 33. Japan VR Content Creation Sales Value, (2020-2031) & (US$ Million)
- Figure 34. Japan VR Content Creation Sales Value by Customer (%), 2024 VS 2031
- Figure 35. Japan VR Content Creation Sales Value by Application (%), 2024 VS 2031
- Figure 36. South Korea VR Content Creation Sales Value, (2020-2031) & (US$ Million)
- Figure 37. South Korea VR Content Creation Sales Value by Customer (%), 2024 VS 2031
- Figure 38. South Korea VR Content Creation Sales Value by Application (%), 2024 VS 2031
- Figure 39. Southeast Asia VR Content Creation Sales Value, (2020-2031) & (US$ Million)
- Figure 40. Southeast Asia VR Content Creation Sales Value by Customer (%), 2024 VS 2031
- Figure 41. Southeast Asia VR Content Creation Sales Value by Application (%), 2024 VS 2031
- Figure 42. India VR Content Creation Sales Value, (2020-2031) & (US$ Million)
- Figure 43. India VR Content Creation Sales Value by Customer (%), 2024 VS 2031
- Figure 44. India VR Content Creation Sales Value by Application (%), 2024 VS 2031
- Figure 45. VR Content Creation Industrial Chain
- Figure 46. Bottom-up and Top-down Approaches for This Report
- Figure 47. Data Triangulation
- Figure 48. Key Executives Interviewed
The global VR Content Creation market was valued at US$ 496.20 million in 2024 and is expected to reach US$ 3,254.96 million by 2031, with a CAGR of 33.86% during the forecast period 2025-2031.
The global key companies of VR Content Creation include Flowing Cloud Technology, Falcon's Beyond, Survios, Felix & Paul Studios, Archiact, Juego Studios, BlockchainAppsDeveloper, Game-Ace, Hengxin Shambala, etc. in 2024, the global five largest players hold a share approximately 8% in terms of revenue. The market concentration is very low, there are many small players in the market.
This report aims to provide a comprehensive presentation of the global market for VR Content Creation, focusing on the total sales revenue, key companies market share and ranking, together with an analysis of VR Content Creation by region & country, by Customer, and by Application.
The VR Content Creation market size, estimations, and forecasts are provided in terms of sales revenue ($ millions), considering 2024 as the base year, with history and forecast data for the period from 2020 to 2031.
Market Segmentation
By Company
- Flowing Cloud Technology
- Falcon's Beyond
- Survios
- Felix & Paul Studios
- Archiact
- Juego Studios
- BlockchainAppsDeveloper
- Game-Ace
- Hengxin Shambala
- Luminous XR
- Virtual Reality Company (VRC)
- 360 Labs
- 4Experience
- Khora
- VRdirect
- Panedia
- Koncept VR
- LetinVR
- Dream Verse
- 2nd.SIDE
- WHITESTAG
- Tsumiki Seisaku
- Silkroad Visual
- Liquona
- Avventura
Segment by Customer
- to B
- to C
Segment by Application
- Games
- Film and TV
- Medical
- Education
- Others
By Region
- North America
- USA
- Canada
- Mexico
- Asia-Pacific
- China
- Japan
- South Korea
- India
- Southeast Asia
- Australia
- Rest of Asia-Pacific
- Europe
- Germany
- France
- UK
- Italy
- Rest of Europe
- South America
- Brazil
- Rest of South America
- Middle East & Africa
- Middle East
- Africa
Chapter Outline
Chapter 1: Introduces the report scope of the report, global total market size. This chapter also provides the market dynamics, latest developments of the market, the driving factors and restrictive factors of the market, the challenges and risks faced by manufacturers in the industry, and the analysis of relevant policies in the industry.
Chapter 2: Detailed analysis of VR Content Creation company competitive landscape, revenue market share, latest development plan, merger, and acquisition information, etc.
Chapter 3: Provides the analysis of various market segments by Customer, covering the market size and development potential of each market segment, to help readers find the blue ocean market in different market segments.
Chapter 4: Provides the analysis of various market segments by Application, covering the market size and development potential of each market segment, to help readers find the blue ocean market in different downstream markets.
Chapter 5: Revenue of VR Content Creation in regional level. It provides a quantitative analysis of the market size and development potential of each region and introduces the market development, future development prospects, market space, and market size of each country in the world.
Chapter 6: Revenue of VR Content Creation in country level. It provides sigmate data by Customer, and by Application for each country/region.
Chapter 7: Provides profiles of key players, introducing the basic situation of the main companies in the market in detail, including product revenue, gross margin, product introduction, recent development, etc.
Chapter 8: Analysis of industrial chain, including the upstream and downstream of the industry.
Chapter 9: Conclusion.
Table of Contents
1 Market Overview
- 1.1 VR Content Creation Product Introduction
- 1.2 Global VR Content Creation Market Size Forecast (2020-2031)
- 1.3 VR Content Creation Market Trends & Drivers
- 1.3.1 VR Content Creation Industry Trends
- 1.3.2 VR Content Creation Market Drivers & Opportunity
- 1.3.3 VR Content Creation Market Challenges
- 1.3.4 VR Content Creation Market Restraints
- 1.4 Assumptions and Limitations
- 1.5 Study Objectives
- 1.6 Years Considered
2 Competitive Analysis by Company
- 2.1 Global VR Content Creation Players Revenue Ranking (2024)
- 2.2 Global VR Content Creation Revenue by Company (2020-2025)
- 2.3 Key Companies VR Content Creation Headquarter
- 2.4 Key Companies VR Content Creation Application
- 2.5 Key VR Content Creation Companies Established Time
- 2.6 VR Content Creation Market Competitive Analysis
- 2.6.1 VR Content Creation Market Concentration Rate (2020-2025)
- 2.6.2 Global 5 and 10 Largest Companies by VR Content Creation Revenue in 2024
- 2.6.3 Global Top Companies by Company Type (Tier 1, Tier 2, and Tier 3) & (based on the Revenue in VR Content Creation as of 2024)
3 Segmentation by Customer
- 3.1 Introduction by Customer
- 3.1.1 to B
- 3.1.2 to C
- 3.2 Global VR Content Creation Sales Value by Customer
- 3.2.1 Global VR Content Creation Sales Value by Customer (2020 VS 2024 VS 2031)
- 3.2.2 Global VR Content Creation Sales Value, by Customer (2020-2031)
- 3.2.3 Global VR Content Creation Sales Value, by Customer (%) (2020-2031)
4 Segmentation by Application
- 4.1 Introduction by Application
- 4.1.1 Games
- 4.1.2 Film and TV
- 4.1.3 Medical
- 4.1.4 Education
- 4.1.5 Others
- 4.2 Global VR Content Creation Sales Value by Application
- 4.2.1 Global VR Content Creation Sales Value by Application (2020 VS 2024 VS 2031)
- 4.2.2 Global VR Content Creation Sales Value, by Application (2020-2031)
- 4.2.3 Global VR Content Creation Sales Value, by Application (%) (2020-2031)
5 Segmentation by Region
- 5.1 Global VR Content Creation Sales Value by Region
- 5.1.1 Global VR Content Creation Sales Value by Region: 2020 VS 2024 VS 2031
- 5.1.2 Global VR Content Creation Sales Value by Region (2020-2025)
- 5.1.3 Global VR Content Creation Sales Value by Region (2026-2031)
- 5.1.4 Global VR Content Creation Sales Value by Region (%), (2020-2031)
- 5.2 North America
- 5.2.1 North America VR Content Creation Sales Value, 2020-2031
- 5.2.2 North America VR Content Creation Sales Value by Country (%), 2024 VS 2031
- 5.3 Europe
- 5.3.1 Europe VR Content Creation Sales Value, 2020-2031
- 5.3.2 Europe VR Content Creation Sales Value by Country (%), 2024 VS 2031
- 5.4 Asia Pacific
- 5.4.1 Asia Pacific VR Content Creation Sales Value, 2020-2031
- 5.4.2 Asia Pacific VR Content Creation Sales Value by Region (%), 2024 VS 2031
- 5.5 South America
- 5.5.1 South America VR Content Creation Sales Value, 2020-2031
- 5.5.2 South America VR Content Creation Sales Value by Country (%), 2024 VS 2031
- 5.6 Middle East & Africa
- 5.6.1 Middle East & Africa VR Content Creation Sales Value, 2020-2031
- 5.6.2 Middle East & Africa VR Content Creation Sales Value by Country (%), 2024 VS 2031
6 Segmentation by Key Countries/Regions
- 6.1 Key Countries/Regions VR Content Creation Sales Value Growth Trends, 2020 VS 2024 VS 2031
- 6.2 Key Countries/Regions VR Content Creation Sales Value, 2020-2031
- 6.3 USA
- 6.3.1 USA VR Content Creation Sales Value, 2020-2031
- 6.3.2 USA VR Content Creation Sales Value by Customer (%), 2024 VS 2031
- 6.3.3 USA VR Content Creation Sales Value by Application, 2024 VS 2031
- 6.4 Europe
- 6.4.1 Europe VR Content Creation Sales Value, 2020-2031
- 6.4.2 Europe VR Content Creation Sales Value by Customer (%), 2024 VS 2031
- 6.4.3 Europe VR Content Creation Sales Value by Application, 2024 VS 2031
- 6.5 China
- 6.5.1 China VR Content Creation Sales Value, 2020-2031
- 6.5.2 China VR Content Creation Sales Value by Customer (%), 2024 VS 2031
- 6.5.3 China VR Content Creation Sales Value by Application, 2024 VS 2031
- 6.6 Japan
- 6.6.1 Japan VR Content Creation Sales Value, 2020-2031
- 6.6.2 Japan VR Content Creation Sales Value by Customer (%), 2024 VS 2031
- 6.6.3 Japan VR Content Creation Sales Value by Application, 2024 VS 2031
- 6.7 South Korea
- 6.7.1 South Korea VR Content Creation Sales Value, 2020-2031
- 6.7.2 South Korea VR Content Creation Sales Value by Customer (%), 2024 VS 2031
- 6.7.3 South Korea VR Content Creation Sales Value by Application, 2024 VS 2031
- 6.8 Southeast Asia
- 6.8.1 Southeast Asia VR Content Creation Sales Value, 2020-2031
- 6.8.2 Southeast Asia VR Content Creation Sales Value by Customer (%), 2024 VS 2031
- 6.8.3 Southeast Asia VR Content Creation Sales Value by Application, 2024 VS 2031
- 6.9 India
- 6.9.1 India VR Content Creation Sales Value, 2020-2031
- 6.9.2 India VR Content Creation Sales Value by Customer (%), 2024 VS 2031
- 6.9.3 India VR Content Creation Sales Value by Application, 2024 VS 2031
7 Company Profiles
- 7.1 Flowing Cloud Technology
- 7.1.1 Flowing Cloud Technology Profile
- 7.1.2 Flowing Cloud Technology Main Business
- 7.1.3 Flowing Cloud Technology VR Content Creation Service/Projects
- 7.1.4 Flowing Cloud Technology VR Content Creation Revenue (US$ Million) & (2020-2025)
- 7.2 Falcon's Beyond
- 7.2.1 Falcon's Beyond Profile
- 7.2.2 Falcon's Beyond Main Business
- 7.2.3 Falcon's Beyond VR Content Creation Service/Projects
- 7.2.4 Falcon's Beyond VR Content Creation Revenue (US$ Million) & (2020-2025)
- 7.2.5 Falcon's Beyond Recent Developments
- 7.3 Survios
- 7.3.1 Survios Profile
- 7.3.2 Survios Main Business
- 7.3.3 Survios VR Content Creation Service/Projects
- 7.3.4 Survios VR Content Creation Revenue (US$ Million) & (2020-2025)
- 7.3.5 Survios Recent Developments
- 7.4 Felix & Paul Studios
- 7.4.1 Felix & Paul Studios Profile
- 7.4.2 Felix & Paul Studios Main Business
- 7.4.3 Felix & Paul Studios VR Content Creation Service/Projects
- 7.4.4 Felix & Paul Studios VR Content Creation Revenue (US$ Million) & (2020-2025)
- 7.5 Archiact
- 7.5.1 Archiact Profile
- 7.5.2 Archiact Main Business
- 7.5.3 Archiact VR Content Creation Service/Projects
- 7.5.4 Archiact VR Content Creation Revenue (US$ Million) & (2020-2025)
- 7.5.5 Archiact Recent Developments
- 7.6 Juego Studios
- 7.6.1 Juego Studios Profile
- 7.6.2 Juego Studios Main Business
- 7.6.3 Juego Studios VR Content Creation Service/Projects
- 7.6.4 Juego Studios VR Content Creation Revenue (US$ Million) & (2020-2025)
- 7.7 BlockchainAppsDeveloper
- 7.7.1 BlockchainAppsDeveloper Profile
- 7.7.2 BlockchainAppsDeveloper Main Business
- 7.7.3 BlockchainAppsDeveloper VR Content Creation Service/Projects
- 7.7.4 BlockchainAppsDeveloper VR Content Creation Revenue (US$ Million) & (2020-2025)
- 7.8 Game-Ace
- 7.8.1 Game-Ace Profile
- 7.8.2 Game-Ace Main Business
- 7.8.3 Game-Ace VR Content Creation Service/Projects
- 7.8.4 Game-Ace VR Content Creation Revenue (US$ Million) & (2020-2025)
- 7.9 Hengxin Shambala
- 7.9.1 Hengxin Shambala Profile
- 7.9.2 Hengxin Shambala Main Business
- 7.9.3 Hengxin Shambala VR Content Creation Service/Projects
- 7.9.4 Hengxin Shambala VR Content Creation Revenue (US$ Million) & (2020-2025)
- 7.10 Luminous XR
- 7.10.1 Luminous XR Profile
- 7.10.2 Luminous XR Main Business
- 7.10.3 Luminous XR VR Content Creation Service/Projects
- 7.10.4 Luminous XR VR Content Creation Revenue (US$ Million) & (2020-2025)
- 7.10.5 Luminous XR Recent Developments
- 7.11 Virtual Reality Company (VRC)
- 7.11.1 Virtual Reality Company (VRC) Profile
- 7.11.2 Virtual Reality Company (VRC) Main Business
- 7.11.3 Virtual Reality Company (VRC) VR Content Creation Service/Projects
- 7.11.4 Virtual Reality Company (VRC) VR Content Creation Revenue (US$ Million) & (2020-2025)
- 7.12 360 Labs
- 7.12.1 360 Labs Profile
- 7.12.2 360 Labs Main Business
- 7.12.3 360 Labs VR Content Creation Service/Projects
- 7.12.4 360 Labs VR Content Creation Revenue (US$ Million) & (2020-2025)
- 7.13 4Experience
- 7.13.1 4Experience Profile
- 7.13.2 4Experience Main Business
- 7.13.3 4Experience VR Content Creation Service/Projects
- 7.13.4 4Experience VR Content Creation Revenue (US$ Million) & (2020-2025)
- 7.14 Khora
- 7.14.1 Khora Profile
- 7.14.2 Khora Main Business
- 7.14.3 Khora VR Content Creation Service/Projects
- 7.14.4 Khora VR Content Creation Revenue (US$ Million) & (2020-2025)
- 7.15 VRdirect
- 7.15.1 VRdirect Profile
- 7.15.2 VRdirect Main Business
- 7.15.3 VRdirect VR Content Creation Service/Projects
- 7.15.4 VRdirect VR Content Creation Revenue (US$ Million) & (2020-2025)
- 7.16 Panedia
- 7.16.1 Panedia Profile
- 7.16.2 Panedia Main Business
- 7.16.3 Panedia VR Content Creation Service/Projects
- 7.16.4 Panedia VR Content Creation Revenue (US$ Million) & (2020-2025)
- 7.17 Koncept VR
- 7.17.1 Koncept VR Profile
- 7.17.2 Koncept VR Main Business
- 7.17.3 Koncept VR VR Content Creation Service/Projects
- 7.17.4 Koncept VR VR Content Creation Revenue (US$ Million) & (2020-2025)
- 7.18 LetinVR
- 7.18.1 LetinVR Profile
- 7.18.2 LetinVR Main Business
- 7.18.3 LetinVR VR Content Creation Service/Projects
- 7.18.4 LetinVR VR Content Creation Revenue (US$ Million) & (2020-2025)
- 7.19 Dream Verse (iQIYI)
- 7.19.1 Dream Verse Profile
- 7.19.2 Dream Verse Main Business
- 7.19.3 Dream Verse VR Content Creation Service/Projects
- 7.19.4 Dream Verse VR Content Creation Revenue (US$ Million) & (2020-2025)
- 7.19.5 Dream Verse Recent Developments
- 7.20 2nd.SIDE
- 7.20.1 2nd.SIDE Profile
- 7.20.2 2nd.SIDE Main Business
- 7.20.3 2nd.SIDE VR Content Creation Service/Projects
- 7.20.4 2nd.SIDE VR Content Creation Revenue (US$ Million) & (2020-2025)
- 7.21 WHITESTAG
- 7.21.1 WHITESTAG Profile
- 7.21.2 WHITESTAG Main Business
- 7.21.3 WHITESTAG VR Content Creation Service/Projects
- 7.21.4 WHITESTAG VR Content Creation Revenue (US$ Million) & (2020-2025)
- 7.22 Tsumiki Seisaku
- 7.22.1 Tsumiki Seisaku Profile
- 7.22.2 Tsumiki Seisaku Main Business
- 7.22.3 Tsumiki Seisaku VR Content Creation Service/Projects
- 7.22.4 Tsumiki Seisaku VR Content Creation Revenue (US$ Million) & (2020-2025)
- 7.23 Silkroad Visual
- 7.23.1 Silkroad Visual Profile
- 7.23.2 Silkroad Visual Main Business
- 7.23.3 Silkroad Visual VR Content Creation Service/Projects
- 7.23.4 Silkroad Visual VR Content Creation Revenue (US$ Million) & (2020-2025)
- 7.24 Liquona
- 7.24.1 Liquona Profile
- 7.24.2 Liquona Main Business
- 7.24.3 Liquona VR Content Creation Service/Projects
- 7.24.4 Liquona VR Content Creation Revenue (US$ Million) & (2020-2025)
- 7.25 Avventura
- 7.25.1 Avventura Profile
- 7.25.2 Avventura Main Business
- 7.25.3 Avventura VR Content Creation Service/Projects
- 7.25.4 Avventura VR Content Creation Revenue (US$ Million) & (2020-2025)
8 Industry Chain Analysis
- 8.1 VR Content Creation Industrial Chain
- 8.2 VR Content Creation Upstream Analysis
- 8.2.1 Upstream Products
- 8.2.2 Upstream Key Suppliers
- 8.3 Midstream Analysis
- 8.4 Downstream Analysis (Customers Analysis)
9 Research Findings and Conclusion
10 Appendix
- 10.1 Research Methodology
- 10.1.1 Methodology/Research Approach
- 10.1.2 Data Source
- 10.2 Author Details
- 10.3 Disclaimer
