|
|
市場調査レポート
商品コード
1101860
ゲーム内広告の世界市場-市場規模、シェア、業界動向:デバイスタイプ別(PC/ラップトップ、スマートフォン/タブレット)、タイプ別(静的広告、動的広告、アドバゲーム)、地域別-展望および予測(2022年~2028年)Global In-Game Advertising Market Size, Share & Industry Trends Analysis Report By Device Type (PC/Laptop, and Smartphone/Tablet), By Type (Static Ads, Dynamic Ads, and Averaging), By Regional Outlook and Forecast, 2022 - 2028 |
||||||
|
|
|||||||


| ゲーム内広告の世界市場-市場規模、シェア、業界動向:デバイスタイプ別(PC/ラップトップ、スマートフォン/タブレット)、タイプ別(静的広告、動的広告、アドバゲーム)、地域別-展望および予測(2022年~2028年) |
|
出版日: 2022年06月30日
発行: KBV Research
ページ情報: 英文 140 Pages
納期: 即納可能
|
- 全表示
- 概要
- 図表
- 目次
世界のゲーム内広告の市場規模は、予測期間中に10.1%のCAGRで成長し、2028年には122億米ドルに達すると予測されます。
モバイルゲーム数の増加、ゲーム内広告への投資の拡大、インターネット利用率の上昇は、ゲーム内広告市場の成長を促進しています。しかし、開発費の高騰とゲーム開発者の不足が、市場の成長を抑制しています。
当レポートでは、世界のゲーム内広告市場について調査しており、市場概要、市場分析、企業プロファイルなど、包括的な情報を提供しています。
目次
第1章 市場の範囲と調査手法
第2章 市場概要
- イントロダクション
- 市場に影響を与える主な要因
第3章 ゲーム内広告市場に展開された戦略
第4章 世界のゲーム内広告市場:デバイスタイプ別
- 世界のPC/ラップトップ市場:地域別
- 世界のスマートフォン/タブレット市場:地域別
第5章 世界のゲーム内広告市場:タイプ別
- 世界の静的広告市場:地域別
- 世界の動的広告市場:地域別
- 世界のアドバゲーム市場:地域別
第6章 世界のゲーム内広告市場:地域別
- 北米のゲーム内広告市場
- 欧州のゲーム内広告市場
- アジア太平洋のゲーム内広告市場
- ラテンアメリカ・中東・アフリカのゲーム内広告市場
第7章 企業プロファイル
- Google LLC
- Electronic Arts, Inc.
- Activision Blizzard, Inc.
- ironSource Ltd.
- WPP Plc
- Motive Interactive, Inc.
- Playwire LLC
- RapidFire, Inc.
- Anzu Virtual Reality Ltd.
LIST OF TABLES
- TABLE 1 Global In-Game Advertising Market, 2018 - 2021, USD Million
- TABLE 2 Global In-Game Advertising Market, 2022 - 2028, USD Million
- TABLE 3 Global In-Game Advertising Market by Device Type, 2018 - 2021, USD Million
- TABLE 4 Global In-Game Advertising Market by Device Type, 2022 - 2028, USD Million
- TABLE 5 Global PC/Laptop Market by Region, 2018 - 2021, USD Million
- TABLE 6 Global PC/Laptop Market by Region, 2022 - 2028, USD Million
- TABLE 7 Global Smartphone/Tablet Market by Region, 2018 - 2021, USD Million
- TABLE 8 Global Smartphone/Tablet Market by Region, 2022 - 2028, USD Million
- TABLE 9 Global In-Game Advertising Market by Type, 2018 - 2021, USD Million
- TABLE 10 Global In-Game Advertising Market by Type, 2022 - 2028, USD Million
- TABLE 11 Global Static Ads Market by Region, 2018 - 2021, USD Million
- TABLE 12 Global Static Ads Market by Region, 2022 - 2028, USD Million
- TABLE 13 Global Dynamic Ads Market by Region, 2018 - 2021, USD Million
- TABLE 14 Global Dynamic Ads Market by Region, 2022 - 2028, USD Million
- TABLE 15 Global Advergaming Market by Region, 2018 - 2021, USD Million
- TABLE 16 Global Advergaming Market by Region, 2022 - 2028, USD Million
- TABLE 17 Global In-Game Advertising Market by Region, 2018 - 2021, USD Million
- TABLE 18 Global In-Game Advertising Market by Region, 2022 - 2028, USD Million
- TABLE 19 North America In-Game Advertising Market, 2018 - 2021, USD Million
- TABLE 20 North America In-Game Advertising Market, 2022 - 2028, USD Million
- TABLE 21 North America In-Game Advertising Market by Device Type, 2018 - 2021, USD Million
- TABLE 22 North America In-Game Advertising Market by Device Type, 2022 - 2028, USD Million
- TABLE 23 North America PC/Laptop Market by Country, 2018 - 2021, USD Million
- TABLE 24 North America PC/Laptop Market by Country, 2022 - 2028, USD Million
- TABLE 25 North America Smartphone/Tablet Market by Country, 2018 - 2021, USD Million
- TABLE 26 North America Smartphone/Tablet Market by Country, 2022 - 2028, USD Million
- TABLE 27 North America In-Game Advertising Market by Type, 2018 - 2021, USD Million
- TABLE 28 North America In-Game Advertising Market by Type, 2022 - 2028, USD Million
- TABLE 29 North America Static Ads Market by Country, 2018 - 2021, USD Million
- TABLE 30 North America Static Ads Market by Country, 2022 - 2028, USD Million
- TABLE 31 North America Dynamic Ads Market by Country, 2018 - 2021, USD Million
- TABLE 32 North America Dynamic Ads Market by Country, 2022 - 2028, USD Million
- TABLE 33 North America Advergaming Market by Country, 2018 - 2021, USD Million
- TABLE 34 North America Advergaming Market by Country, 2022 - 2028, USD Million
- TABLE 35 North America In-Game Advertising Market by Country, 2018 - 2021, USD Million
- TABLE 36 North America In-Game Advertising Market by Country, 2022 - 2028, USD Million
- TABLE 37 US In-Game Advertising Market, 2018 - 2021, USD Million
- TABLE 38 US In-Game Advertising Market, 2022 - 2028, USD Million
- TABLE 39 US In-Game Advertising Market by Device Type, 2018 - 2021, USD Million
- TABLE 40 US In-Game Advertising Market by Device Type, 2022 - 2028, USD Million
- TABLE 41 US In-Game Advertising Market by Type, 2018 - 2021, USD Million
- TABLE 42 US In-Game Advertising Market by Type, 2022 - 2028, USD Million
- TABLE 43 Canada In-Game Advertising Market, 2018 - 2021, USD Million
- TABLE 44 Canada In-Game Advertising Market, 2022 - 2028, USD Million
- TABLE 45 Canada In-Game Advertising Market by Device Type, 2018 - 2021, USD Million
- TABLE 46 Canada In-Game Advertising Market by Device Type, 2022 - 2028, USD Million
- TABLE 47 Canada In-Game Advertising Market by Type, 2018 - 2021, USD Million
- TABLE 48 Canada In-Game Advertising Market by Type, 2022 - 2028, USD Million
- TABLE 49 Mexico In-Game Advertising Market, 2018 - 2021, USD Million
- TABLE 50 Mexico In-Game Advertising Market, 2022 - 2028, USD Million
- TABLE 51 Mexico In-Game Advertising Market by Device Type, 2018 - 2021, USD Million
- TABLE 52 Mexico In-Game Advertising Market by Device Type, 2022 - 2028, USD Million
- TABLE 53 Mexico In-Game Advertising Market by Type, 2018 - 2021, USD Million
- TABLE 54 Mexico In-Game Advertising Market by Type, 2022 - 2028, USD Million
- TABLE 55 Rest of North America In-Game Advertising Market, 2018 - 2021, USD Million
- TABLE 56 Rest of North America In-Game Advertising Market, 2022 - 2028, USD Million
- TABLE 57 Rest of North America In-Game Advertising Market by Device Type, 2018 - 2021, USD Million
- TABLE 58 Rest of North America In-Game Advertising Market by Device Type, 2022 - 2028, USD Million
- TABLE 59 Rest of North America In-Game Advertising Market by Type, 2018 - 2021, USD Million
- TABLE 60 Rest of North America In-Game Advertising Market by Type, 2022 - 2028, USD Million
- TABLE 61 Europe In-Game Advertising Market, 2018 - 2021, USD Million
- TABLE 62 Europe In-Game Advertising Market, 2022 - 2028, USD Million
- TABLE 63 Europe In-Game Advertising Market by Device Type, 2018 - 2021, USD Million
- TABLE 64 Europe In-Game Advertising Market by Device Type, 2022 - 2028, USD Million
- TABLE 65 Europe PC/Laptop Market by Country, 2018 - 2021, USD Million
- TABLE 66 Europe PC/Laptop Market by Country, 2022 - 2028, USD Million
- TABLE 67 Europe Smartphone/Tablet Market by Country, 2018 - 2021, USD Million
- TABLE 68 Europe Smartphone/Tablet Market by Country, 2022 - 2028, USD Million
- TABLE 69 Europe In-Game Advertising Market by Type, 2018 - 2021, USD Million
- TABLE 70 Europe In-Game Advertising Market by Type, 2022 - 2028, USD Million
- TABLE 71 Europe Static Ads Market by Country, 2018 - 2021, USD Million
- TABLE 72 Europe Static Ads Market by Country, 2022 - 2028, USD Million
- TABLE 73 Europe Dynamic Ads Market by Country, 2018 - 2021, USD Million
- TABLE 74 Europe Dynamic Ads Market by Country, 2022 - 2028, USD Million
- TABLE 75 Europe Advergaming Market by Country, 2018 - 2021, USD Million
- TABLE 76 Europe Advergaming Market by Country, 2022 - 2028, USD Million
- TABLE 77 Europe In-Game Advertising Market by Country, 2018 - 2021, USD Million
- TABLE 78 Europe In-Game Advertising Market by Country, 2022 - 2028, USD Million
- TABLE 79 Germany In-Game Advertising Market, 2018 - 2021, USD Million
- TABLE 80 Germany In-Game Advertising Market, 2022 - 2028, USD Million
- TABLE 81 Germany In-Game Advertising Market by Device Type, 2018 - 2021, USD Million
- TABLE 82 Germany In-Game Advertising Market by Device Type, 2022 - 2028, USD Million
- TABLE 83 Germany In-Game Advertising Market by Type, 2018 - 2021, USD Million
- TABLE 84 Germany In-Game Advertising Market by Type, 2022 - 2028, USD Million
- TABLE 85 UK In-Game Advertising Market, 2018 - 2021, USD Million
- TABLE 86 UK In-Game Advertising Market, 2022 - 2028, USD Million
- TABLE 87 UK In-Game Advertising Market by Device Type, 2018 - 2021, USD Million
- TABLE 88 UK In-Game Advertising Market by Device Type, 2022 - 2028, USD Million
- TABLE 89 UK In-Game Advertising Market by Type, 2018 - 2021, USD Million
- TABLE 90 UK In-Game Advertising Market by Type, 2022 - 2028, USD Million
- TABLE 91 France In-Game Advertising Market, 2018 - 2021, USD Million
- TABLE 92 France In-Game Advertising Market, 2022 - 2028, USD Million
- TABLE 93 France In-Game Advertising Market by Device Type, 2018 - 2021, USD Million
- TABLE 94 France In-Game Advertising Market by Device Type, 2022 - 2028, USD Million
- TABLE 95 France In-Game Advertising Market by Type, 2018 - 2021, USD Million
- TABLE 96 France In-Game Advertising Market by Type, 2022 - 2028, USD Million
- TABLE 97 Russia In-Game Advertising Market, 2018 - 2021, USD Million
- TABLE 98 Russia In-Game Advertising Market, 2022 - 2028, USD Million
- TABLE 99 Russia In-Game Advertising Market by Device Type, 2018 - 2021, USD Million
- TABLE 100 Russia In-Game Advertising Market by Device Type, 2022 - 2028, USD Million
- TABLE 101 Russia In-Game Advertising Market by Type, 2018 - 2021, USD Million
- TABLE 102 Russia In-Game Advertising Market by Type, 2022 - 2028, USD Million
- TABLE 103 Spain In-Game Advertising Market, 2018 - 2021, USD Million
- TABLE 104 Spain In-Game Advertising Market, 2022 - 2028, USD Million
- TABLE 105 Spain In-Game Advertising Market by Device Type, 2018 - 2021, USD Million
- TABLE 106 Spain In-Game Advertising Market by Device Type, 2022 - 2028, USD Million
- TABLE 107 Spain In-Game Advertising Market by Type, 2018 - 2021, USD Million
- TABLE 108 Spain In-Game Advertising Market by Type, 2022 - 2028, USD Million
- TABLE 109 Italy In-Game Advertising Market, 2018 - 2021, USD Million
- TABLE 110 Italy In-Game Advertising Market, 2022 - 2028, USD Million
- TABLE 111 Italy In-Game Advertising Market by Device Type, 2018 - 2021, USD Million
- TABLE 112 Italy In-Game Advertising Market by Device Type, 2022 - 2028, USD Million
- TABLE 113 Italy In-Game Advertising Market by Type, 2018 - 2021, USD Million
- TABLE 114 Italy In-Game Advertising Market by Type, 2022 - 2028, USD Million
- TABLE 115 Rest of Europe In-Game Advertising Market, 2018 - 2021, USD Million
- TABLE 116 Rest of Europe In-Game Advertising Market, 2022 - 2028, USD Million
- TABLE 117 Rest of Europe In-Game Advertising Market by Device Type, 2018 - 2021, USD Million
- TABLE 118 Rest of Europe In-Game Advertising Market by Device Type, 2022 - 2028, USD Million
- TABLE 119 Rest of Europe In-Game Advertising Market by Type, 2018 - 2021, USD Million
- TABLE 120 Rest of Europe In-Game Advertising Market by Type, 2022 - 2028, USD Million
- TABLE 121 Asia Pacific In-Game Advertising Market, 2018 - 2021, USD Million
- TABLE 122 Asia Pacific In-Game Advertising Market, 2022 - 2028, USD Million
- TABLE 123 Asia Pacific In-Game Advertising Market by Device Type, 2018 - 2021, USD Million
- TABLE 124 Asia Pacific In-Game Advertising Market by Device Type, 2022 - 2028, USD Million
- TABLE 125 Asia Pacific PC/Laptop Market by Country, 2018 - 2021, USD Million
- TABLE 126 Asia Pacific PC/Laptop Market by Country, 2022 - 2028, USD Million
- TABLE 127 Asia Pacific Smartphone/Tablet Market by Country, 2018 - 2021, USD Million
- TABLE 128 Asia Pacific Smartphone/Tablet Market by Country, 2022 - 2028, USD Million
- TABLE 129 Asia Pacific In-Game Advertising Market by Type, 2018 - 2021, USD Million
- TABLE 130 Asia Pacific In-Game Advertising Market by Type, 2022 - 2028, USD Million
- TABLE 131 Asia Pacific Static Ads Market by Country, 2018 - 2021, USD Million
- TABLE 132 Asia Pacific Static Ads Market by Country, 2022 - 2028, USD Million
- TABLE 133 Asia Pacific Dynamic Ads Market by Country, 2018 - 2021, USD Million
- TABLE 134 Asia Pacific Dynamic Ads Market by Country, 2022 - 2028, USD Million
- TABLE 135 Asia Pacific Advergaming Market by Country, 2018 - 2021, USD Million
- TABLE 136 Asia Pacific Advergaming Market by Country, 2022 - 2028, USD Million
- TABLE 137 Asia Pacific In-Game Advertising Market by Country, 2018 - 2021, USD Million
- TABLE 138 Asia Pacific In-Game Advertising Market by Country, 2022 - 2028, USD Million
- TABLE 139 China In-Game Advertising Market, 2018 - 2021, USD Million
- TABLE 140 China In-Game Advertising Market, 2022 - 2028, USD Million
- TABLE 141 China In-Game Advertising Market by Device Type, 2018 - 2021, USD Million
- TABLE 142 China In-Game Advertising Market by Device Type, 2022 - 2028, USD Million
- TABLE 143 China In-Game Advertising Market by Type, 2018 - 2021, USD Million
- TABLE 144 China In-Game Advertising Market by Type, 2022 - 2028, USD Million
- TABLE 145 Japan In-Game Advertising Market, 2018 - 2021, USD Million
- TABLE 146 Japan In-Game Advertising Market, 2022 - 2028, USD Million
- TABLE 147 Japan In-Game Advertising Market by Device Type, 2018 - 2021, USD Million
- TABLE 148 Japan In-Game Advertising Market by Device Type, 2022 - 2028, USD Million
- TABLE 149 Japan In-Game Advertising Market by Type, 2018 - 2021, USD Million
- TABLE 150 Japan In-Game Advertising Market by Type, 2022 - 2028, USD Million
- TABLE 151 India In-Game Advertising Market, 2018 - 2021, USD Million
- TABLE 152 India In-Game Advertising Market, 2022 - 2028, USD Million
- TABLE 153 India In-Game Advertising Market by Device Type, 2018 - 2021, USD Million
- TABLE 154 India In-Game Advertising Market by Device Type, 2022 - 2028, USD Million
- TABLE 155 India In-Game Advertising Market by Type, 2018 - 2021, USD Million
- TABLE 156 India In-Game Advertising Market by Type, 2022 - 2028, USD Million
- TABLE 157 South Korea In-Game Advertising Market, 2018 - 2021, USD Million
- TABLE 158 South Korea In-Game Advertising Market, 2022 - 2028, USD Million
- TABLE 159 South Korea In-Game Advertising Market by Device Type, 2018 - 2021, USD Million
- TABLE 160 South Korea In-Game Advertising Market by Device Type, 2022 - 2028, USD Million
- TABLE 161 South Korea In-Game Advertising Market by Type, 2018 - 2021, USD Million
- TABLE 162 South Korea In-Game Advertising Market by Type, 2022 - 2028, USD Million
- TABLE 163 Singapore In-Game Advertising Market, 2018 - 2021, USD Million
- TABLE 164 Singapore In-Game Advertising Market, 2022 - 2028, USD Million
- TABLE 165 Singapore In-Game Advertising Market by Device Type, 2018 - 2021, USD Million
- TABLE 166 Singapore In-Game Advertising Market by Device Type, 2022 - 2028, USD Million
- TABLE 167 Singapore In-Game Advertising Market by Type, 2018 - 2021, USD Million
- TABLE 168 Singapore In-Game Advertising Market by Type, 2022 - 2028, USD Million
- TABLE 169 Malaysia In-Game Advertising Market, 2018 - 2021, USD Million
- TABLE 170 Malaysia In-Game Advertising Market, 2022 - 2028, USD Million
- TABLE 171 Malaysia In-Game Advertising Market by Device Type, 2018 - 2021, USD Million
- TABLE 172 Malaysia In-Game Advertising Market by Device Type, 2022 - 2028, USD Million
- TABLE 173 Malaysia In-Game Advertising Market by Type, 2018 - 2021, USD Million
- TABLE 174 Malaysia In-Game Advertising Market by Type, 2022 - 2028, USD Million
- TABLE 175 Rest of Asia Pacific In-Game Advertising Market, 2018 - 2021, USD Million
- TABLE 176 Rest of Asia Pacific In-Game Advertising Market, 2022 - 2028, USD Million
- TABLE 177 Rest of Asia Pacific In-Game Advertising Market by Device Type, 2018 - 2021, USD Million
- TABLE 178 Rest of Asia Pacific In-Game Advertising Market by Device Type, 2022 - 2028, USD Million
- TABLE 179 Rest of Asia Pacific In-Game Advertising Market by Type, 2018 - 2021, USD Million
- TABLE 180 Rest of Asia Pacific In-Game Advertising Market by Type, 2022 - 2028, USD Million
- TABLE 181 LAMEA In-Game Advertising Market, 2018 - 2021, USD Million
- TABLE 182 LAMEA In-Game Advertising Market, 2022 - 2028, USD Million
- TABLE 183 LAMEA In-Game Advertising Market by Device Type, 2018 - 2021, USD Million
- TABLE 184 LAMEA In-Game Advertising Market by Device Type, 2022 - 2028, USD Million
- TABLE 185 LAMEA PC/Laptop Market by Country, 2018 - 2021, USD Million
- TABLE 186 LAMEA PC/Laptop Market by Country, 2022 - 2028, USD Million
- TABLE 187 LAMEA Smartphone/Tablet Market by Country, 2018 - 2021, USD Million
- TABLE 188 LAMEA Smartphone/Tablet Market by Country, 2022 - 2028, USD Million
- TABLE 189 LAMEA In-Game Advertising Market by Type, 2018 - 2021, USD Million
- TABLE 190 LAMEA In-Game Advertising Market by Type, 2022 - 2028, USD Million
- TABLE 191 LAMEA Static Ads Market by Country, 2018 - 2021, USD Million
- TABLE 192 LAMEA Static Ads Market by Country, 2022 - 2028, USD Million
- TABLE 193 LAMEA Dynamic Ads Market by Country, 2018 - 2021, USD Million
- TABLE 194 LAMEA Dynamic Ads Market by Country, 2022 - 2028, USD Million
- TABLE 195 LAMEA Advergaming Market by Country, 2018 - 2021, USD Million
- TABLE 196 LAMEA Advergaming Market by Country, 2022 - 2028, USD Million
- TABLE 197 LAMEA In-Game Advertising Market by Country, 2018 - 2021, USD Million
- TABLE 198 LAMEA In-Game Advertising Market by Country, 2022 - 2028, USD Million
- TABLE 199 Brazil In-Game Advertising Market, 2018 - 2021, USD Million
- TABLE 200 Brazil In-Game Advertising Market, 2022 - 2028, USD Million
- TABLE 201 Brazil In-Game Advertising Market by Device Type, 2018 - 2021, USD Million
- TABLE 202 Brazil In-Game Advertising Market by Device Type, 2022 - 2028, USD Million
- TABLE 203 Brazil In-Game Advertising Market by Type, 2018 - 2021, USD Million
- TABLE 204 Brazil In-Game Advertising Market by Type, 2022 - 2028, USD Million
- TABLE 205 Argentina In-Game Advertising Market, 2018 - 2021, USD Million
- TABLE 206 Argentina In-Game Advertising Market, 2022 - 2028, USD Million
- TABLE 207 Argentina In-Game Advertising Market by Device Type, 2018 - 2021, USD Million
- TABLE 208 Argentina In-Game Advertising Market by Device Type, 2022 - 2028, USD Million
- TABLE 209 Argentina In-Game Advertising Market by Type, 2018 - 2021, USD Million
- TABLE 210 Argentina In-Game Advertising Market by Type, 2022 - 2028, USD Million
- TABLE 211 UAE In-Game Advertising Market, 2018 - 2021, USD Million
- TABLE 212 UAE In-Game Advertising Market, 2022 - 2028, USD Million
- TABLE 213 UAE In-Game Advertising Market by Device Type, 2018 - 2021, USD Million
- TABLE 214 UAE In-Game Advertising Market by Device Type, 2022 - 2028, USD Million
- TABLE 215 UAE In-Game Advertising Market by Type, 2018 - 2021, USD Million
- TABLE 216 UAE In-Game Advertising Market by Type, 2022 - 2028, USD Million
- TABLE 217 Saudi Arabia In-Game Advertising Market, 2018 - 2021, USD Million
- TABLE 218 Saudi Arabia In-Game Advertising Market, 2022 - 2028, USD Million
- TABLE 219 Saudi Arabia In-Game Advertising Market by Device Type, 2018 - 2021, USD Million
- TABLE 220 Saudi Arabia In-Game Advertising Market by Device Type, 2022 - 2028, USD Million
- TABLE 221 Saudi Arabia In-Game Advertising Market by Type, 2018 - 2021, USD Million
- TABLE 222 Saudi Arabia In-Game Advertising Market by Type, 2022 - 2028, USD Million
- TABLE 223 South Africa In-Game Advertising Market, 2018 - 2021, USD Million
- TABLE 224 South Africa In-Game Advertising Market, 2022 - 2028, USD Million
- TABLE 225 South Africa In-Game Advertising Market by Device Type, 2018 - 2021, USD Million
- TABLE 226 South Africa In-Game Advertising Market by Device Type, 2022 - 2028, USD Million
- TABLE 227 South Africa In-Game Advertising Market by Type, 2018 - 2021, USD Million
- TABLE 228 South Africa In-Game Advertising Market by Type, 2022 - 2028, USD Million
- TABLE 229 Nigeria In-Game Advertising Market, 2018 - 2021, USD Million
- TABLE 230 Nigeria In-Game Advertising Market, 2022 - 2028, USD Million
- TABLE 231 Nigeria In-Game Advertising Market by Device Type, 2018 - 2021, USD Million
- TABLE 232 Nigeria In-Game Advertising Market by Device Type, 2022 - 2028, USD Million
- TABLE 233 Nigeria In-Game Advertising Market by Type, 2018 - 2021, USD Million
- TABLE 234 Nigeria In-Game Advertising Market by Type, 2022 - 2028, USD Million
- TABLE 235 Rest of LAMEA In-Game Advertising Market, 2018 - 2021, USD Million
- TABLE 236 Rest of LAMEA In-Game Advertising Market, 2022 - 2028, USD Million
- TABLE 237 Rest of LAMEA In-Game Advertising Market by Device Type, 2018 - 2021, USD Million
- TABLE 238 Rest of LAMEA In-Game Advertising Market by Device Type, 2022 - 2028, USD Million
- TABLE 239 Rest of LAMEA In-Game Advertising Market by Type, 2018 - 2021, USD Million
- TABLE 240 Rest of LAMEA In-Game Advertising Market by Type, 2022 - 2028, USD Million
- TABLE 241 Key Information - Google LLC
- TABLE 242 Key information - Electronic Arts, Inc.
- TABLE 243 Key Information - Activision Blizzard, Inc.
- TABLE 244 Key Information - ironSource Ltd.
- TABLE 245 Key Information - WPP Plc
- TABLE 246 Key information - Motive Interactive, Inc.
- TABLE 247 Key Information - Playwire LLC
- TABLE 248 Key Information - RapidFire, Inc.
- TABLE 249 Key Information - Anzu Virtual Reality Ltd.
List of Figures
- FIG 1 Methodology for the research
- FIG 2 Global In-Game Advertising Market Share by Device Type, 2021
- FIG 3 Global In-Game Advertising Market Share by Device Type, 2028
- FIG 4 Global In-Game Advertising Market by Device Type, 2018 - 2028, USD Million
- FIG 5 Global In-Game Advertising Market Share by Type, 2021
- FIG 6 Global In-Game Advertising Market Share by Type, 2028
- FIG 7 Global In-Game Advertising Market by Type, 2018 - 2028, USD Million
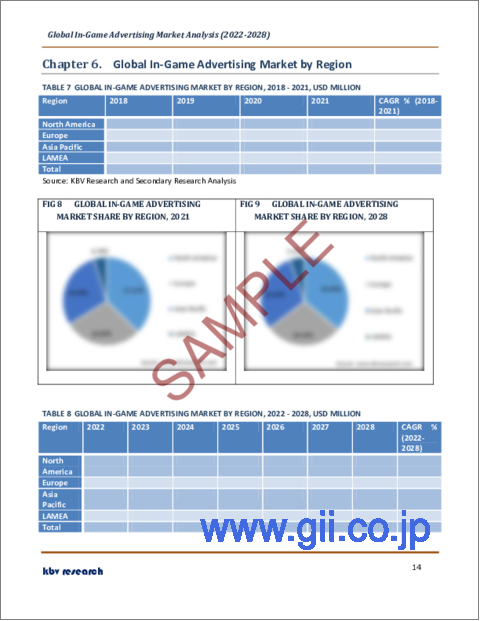
- FIG 8 Global In-Game Advertising Market Share by Region, 2021
- FIG 9 Global In-Game Advertising Market Share by Region, 2028
- FIG 10 Global In-Game Advertising Market by Region, 2018 - 2028, USD Million
The Global In-Game Advertising Market size is expected to reach $12.2 billion by 2028, rising at a market growth of 10.1% CAGR during the forecast period.
Computer and video games both have in-game advertising. Advertisements are being interwoven into mobile and computer games. Pop-up messaging, on-screen commercials, cut-scenes, billboards, and backdrop displays are kinds of in-game advertising. Static (non-changeable) adverts, dynamic (changeable) commercials, and advergaming (a game developed as an advertisement) are all examples of in-game advertising.
The growing internet penetration is one of the primary factors driving the growth of the in-game advertising market. The rising popularity of social and mobile gaming is likely to boost the market for in-game advertising. Commercials, cut scenes, billboards, and background panels with in-game advertising can all be unified into mobile and desktop games.
Static IGAs, like product placement in movies, can't be modified once they've been coded into the game unless it's online. In contrast to traditional media, IGA enables gamers to engage with the virtual product. For example, In Splinter Cell, catching terrorists requires the use of in-game Sony Ericsson phones. Dynamic IGAs, unlike static IGAs, are not limited to a pre-programmed size or location defined by the developer and publisher and allow the advertiser to modify the advertisement display. To make a realistic gaming world, a number of games use billboard-like adverts or product placement. Many sports games include these adverts to mimic the massive advertising seen in professional sports.
IGA and advergaming have been widely accepted by the advertising industry as successful strategies to reach people aged 16 to 34. IGA is viewed as a key tool for reaching out to a generation of young boys who prefer to relax by playing video games rather than watching television. IGA is a specialty of several advertising firms or ad networks, and even more, conventional advertising agencies have tried it.
COVID-19 Impact Analysis
The COVID-19 pandemic is disrupting a number of businesses, including digital advertising. Businesses are rethinking their marketing strategy in light of the COVID-19 outbreak and discussing if now is the ideal time to run internet ads. COVID-19 has a favorable impact on the in-game advertising market because most end users now utilize digital devices to access the internet, and with the conclusion of the pandemic unknown, many businesses are preparing to move the advertising investments to digital platforms. Greater technology improvements, as well as growing consumer hours invested in internet gaming, are predicted to propel the in-game advertisement market.
Market Growth Factors
Increasing growth in number of mobile games
Growing acceptance of various mobile games all across the industry is being pushed by an increase in demand for in-game advertising. Marketers may now contact customers in a brand-safe environment due to in-game advertising. As a huge number of developers sold ad space to commercialize the content, there has been a rise in the proportion of free-to-play mobile games with in-game advertising. On mobile phones, tablets, wearable, PDAs, portable media players, and graphing calculators, mobile games are simple to play.
Higher investment for in-game advertising and rising usage of internet
With the increased availability of fast and low-cost internet services, the internet is becoming more widely used. The internet is the most revolutionary and rapidly evolving technology. With the widespread use of cell phones for gaming purposes, internet penetration has increased. The number of internet users has grown in latest years. Over the past couple of years, many people have gone online for the first time each day.
Market Restraining Factors
Higher expenses and a dearth of creativity among game developer
Even if the cost of developing mobile games has fallen, averaging and mobile advertising deliver a costly campaign. Averaging games must employ novel tactics in order to develop interest and provide uniqueness in the game, which will set it apart from other games on the market. This will hold the player's interest for a longer period of time. This is due to the link between the two, the game generated must be pushed to improve awareness of the game, which will also inform people about the product.
Device type Outlook
Based on the Device Type, the In-Game Advertising Market is bifurcated into PC/Laptop and Smartphone/Tablet. The Smartphone/Tablet garnered a significant revenue share in the In-Game Advertising market in 2021. These gadgets is highly popular among the young and employed population. This is because smartphones are portable i.e., easy to carry and simple to handle. Manufacturers of smartphones are making changes in order to make it more user friendly as well as beneficial for game developer and advertising agency.
Type Outlook
Based on the Type, the In-Game Advertising Market is divided into Static Ads, Dynamic Ads, and Advergaming. The Static Ad segment acquired the highest revenue share in the In-Game Advertising market in 2021. Advertisements that do not alter are known as static ads. Some promoters employ static advertisements to boost brand recognition and reach a big audience. It's easy to confuse a static ad with a dynamic ad when it contains a banner or adverts in video games.
Regional Outlook
Based on the Region, the In-Game Advertising market is analyzed in North America, Europe, Asia-Pacific, and LAMEA. North America emerged as the leading region in the In-Game Advertising market with largest revenue share in 2021. This is due to the high sales of smartphones, PCs, laptops, and other electronic devices, the North American area is likely to grow. As developers increasingly use games as a medium of advertisement, the number of high-quality new games for tablets smartphones, and consoles are expanding.
The market research report covers the analysis of key stake holders of the market. Key companies profiled in the report include Google LLC, Electronic Arts, Inc., Activision Blizzard, Inc., ironSource Ltd., WPP Plc, Motive Interactive, Inc., Playwire LLC, RapidFire, Inc., and Anzu Virtual Reality Ltd.
Strategies deployed in In-Game Advertising Market
May-2022: Activision Blizzard formed a partnership with Tyroo Technologies, an Asia-Pacific ad tech platform. This partnership would bring prospects for brands throughout regions to use in-gaming advertising and connect with players in a fan-first integrated advertising experience across mobile gaming.
May-2022: Activision Blizzard came into a partnership with Livewire, a full-stack framework for Laravel that makes building dynamic interfaces. This partnership aimed to offer brands and marketers the ability to engage ANZ's largest mobile gaming audiences, by blended in-game ads and custom creative implementations.
Mar-2022: Anzu came into a partnership with Oracle Moat, ad measurement and marketing analytics suite. This partnership aimed to deliver advertisers with third-party viewability verifications and in-view metrics, calculating the percentage of the creative on-screen, the ad size, the time in view, and the angle. In addition, Oracle Moat would work to verify impression delivery and detect invalid traffic throughout the running in in-game banner and video formats.
Sep-2021: Anzu came into a partnership with HUMAN Security, the global leader in collective protection against sophisticated bot attacks and fraud. This partnership aimed to protect the in-game advertising space by detecting invalid traffic, general invalid traffic, and sophisticated invalid traffic within Anzu's programmatic gaming inventory over mobile and PC.
Jul-2021: Electronic Arts came into a partnership with Hi-Rez Studios, an independent video game company. This partnership aimed to display video advertisements within PC and console games.
May-2021: Anzu came into a partnership with Bidease, a fully transparent demand-side platform for mobile marketers. This partnership aimed to enable Bidease to enhance advertising capabilities in the mobile gaming market and offer a wide advertiser network of non-intrusive cost-effective in-game ad formats. Moreover, advertisers would have access to Anzu's premium mobile inventory, comprising titles by Vivid Games and Next Wave Multimedia.
Feb-2021: WPP formed a partnership with TikTok, a short-form video hosting service. This partnership enabled WPP clients to gain unique access and capabilities on the TikTok platform. In addition, WPP would have early access to advertising products in development, ensuring WPP and its clients stay at the forefront of innovation as TikTok further develops its suite of products for brands.
Nov-2020: WPP came into a partnership with Anzu, an ad-tech startup specializing in integrating advertising into video games. This partnership aimed to bring commonly accepted advertising standards to the esports and gaming space.
Jul-2019: Anzu formed a partnership with CHEQ, a military-grade cybersecurity company. This partnership aimed to provide the first-ever ad-verification solution for console gaming. In addition, this partnership aimed to enable the dynamic serving of programmatic ads unified directly into game play, under a viewable, brand-safe, and fraud-free environment.
Aug-2018: Google formed a partnership with Unity Technologies, a video game software development company. This partnership aimed to enable Google advertisers to directly access Unity's global mobile gaming inventory. In addition, developers would have access to a broader group of major advertisers across the world than Unity itself can reach through its advertising solutions, and that should aid developers to make more ad money as well.
Scope of the Study
Market Segments covered in the Report:
By Device Type
- PC/Laptop
- Smartphone/Tablet
By Type
- Static Ads
- Dynamic Ads
- Advergaming
By Geography
- North America
- US
- Canada
- Mexico
- Rest of North America
- Europe
- Germany
- UK
- France
- Russia
- Spain
- Italy
- Rest of Europe
- Asia Pacific
- China
- Japan
- India
- South Korea
- Singapore
- Malaysia
- Rest of Asia Pacific
- LAMEA
- Brazil
- Argentina
- UAE
- Saudi Arabia
- South Africa
- Nigeria
- Rest of LAMEA
Companies Profiled
- Google LLC
- Electronic Arts, Inc.
- Activision Blizzard, Inc.
- ironSource Ltd.
- WPP Plc
- Motive Interactive, Inc.
- Playwire LLC
- RapidFire, Inc.
- Anzu Virtual Reality Ltd.
Unique Offerings from KBV Research
- Exhaustive coverage
- Highest number of market tables and figures
- Subscription based model available
- Guaranteed best price
- Assured post sales research support with 10% customization free
Table of Contents
Chapter 1. Market Scope & Methodology
- 1.1 Market Definition
- 1.2 Objectives
- 1.3 Market Scope
- 1.4 Segmentation
- 1.4.1 Global In-Game Advertising Market, by Device Type
- 1.4.2 Global In-Game Advertising Market, by Type
- 1.4.3 Global In-Game Advertising Market, by Geography
- 1.5 Methodology for the research
Chapter 2. Market Overview
- 2.1 Introduction
- 2.1.1 Overview
- 2.1.1.1 Market Composition and Scenario
- 2.1.1 Overview
- 2.2 Key Factors Impacting the Market
- 2.2.1 Market Drivers
- 2.2.2 Market Restraints
Chapter 3. Strategies deployed in In-Game Advertising Market
Chapter 4. Global In-Game Advertising Market by Device Type
- 4.1 Global PC/Laptop Market by Region
- 4.2 Global Smartphone/Tablet Market by Region
Chapter 5. Global In-Game Advertising Market by Type
- 5.1 Global Static Ads Market by Region
- 5.2 Global Dynamic Ads Market by Region
- 5.3 Global Advergaming Market by Region
Chapter 6. Global In-Game Advertising Market by Region
- 6.1 North America In-Game Advertising Market
- 6.1.1 North America In-Game Advertising Market by Device Type
- 6.1.1.1 North America PC/Laptop Market by Country
- 6.1.1.2 North America Smartphone/Tablet Market by Country
- 6.1.2 North America In-Game Advertising Market by Type
- 6.1.2.1 North America Static Ads Market by Country
- 6.1.2.2 North America Dynamic Ads Market by Country
- 6.1.2.3 North America Advergaming Market by Country
- 6.1.3 North America In-Game Advertising Market by Country
- 6.1.3.1 US In-Game Advertising Market
- 6.1.3.1.1 US In-Game Advertising Market by Device Type
- 6.1.3.1.2 US In-Game Advertising Market by Type
- 6.1.3.2 Canada In-Game Advertising Market
- 6.1.3.2.1 Canada In-Game Advertising Market by Device Type
- 6.1.3.2.2 Canada In-Game Advertising Market by Type
- 6.1.3.3 Mexico In-Game Advertising Market
- 6.1.3.3.1 Mexico In-Game Advertising Market by Device Type
- 6.1.3.3.2 Mexico In-Game Advertising Market by Type
- 6.1.3.4 Rest of North America In-Game Advertising Market
- 6.1.3.4.1 Rest of North America In-Game Advertising Market by Device Type
- 6.1.3.4.2 Rest of North America In-Game Advertising Market by Type
- 6.1.3.1 US In-Game Advertising Market
- 6.1.1 North America In-Game Advertising Market by Device Type
- 6.2 Europe In-Game Advertising Market
- 6.2.1 Europe In-Game Advertising Market by Device Type
- 6.2.1.1 Europe PC/Laptop Market by Country
- 6.2.1.2 Europe Smartphone/Tablet Market by Country
- 6.2.2 Europe In-Game Advertising Market by Type
- 6.2.2.1 Europe Static Ads Market by Country
- 6.2.2.2 Europe Dynamic Ads Market by Country
- 6.2.2.3 Europe Advergaming Market by Country
- 6.2.3 Europe In-Game Advertising Market by Country
- 6.2.3.1 Germany In-Game Advertising Market
- 6.2.3.1.1 Germany In-Game Advertising Market by Device Type
- 6.2.3.1.2 Germany In-Game Advertising Market by Type
- 6.2.3.2 UK In-Game Advertising Market
- 6.2.3.2.1 UK In-Game Advertising Market by Device Type
- 6.2.3.2.2 UK In-Game Advertising Market by Type
- 6.2.3.3 France In-Game Advertising Market
- 6.2.3.3.1 France In-Game Advertising Market by Device Type
- 6.2.3.3.2 France In-Game Advertising Market by Type
- 6.2.3.4 Russia In-Game Advertising Market
- 6.2.3.4.1 Russia In-Game Advertising Market by Device Type
- 6.2.3.4.2 Russia In-Game Advertising Market by Type
- 6.2.3.5 Spain In-Game Advertising Market
- 6.2.3.5.1 Spain In-Game Advertising Market by Device Type
- 6.2.3.5.2 Spain In-Game Advertising Market by Type
- 6.2.3.6 Italy In-Game Advertising Market
- 6.2.3.6.1 Italy In-Game Advertising Market by Device Type
- 6.2.3.6.2 Italy In-Game Advertising Market by Type
- 6.2.3.7 Rest of Europe In-Game Advertising Market
- 6.2.3.7.1 Rest of Europe In-Game Advertising Market by Device Type
- 6.2.3.7.2 Rest of Europe In-Game Advertising Market by Type
- 6.2.3.1 Germany In-Game Advertising Market
- 6.2.1 Europe In-Game Advertising Market by Device Type
- 6.3 Asia Pacific In-Game Advertising Market
- 6.3.1 Asia Pacific In-Game Advertising Market by Device Type
- 6.3.1.1 Asia Pacific PC/Laptop Market by Country
- 6.3.1.2 Asia Pacific Smartphone/Tablet Market by Country
- 6.3.2 Asia Pacific In-Game Advertising Market by Type
- 6.3.2.1 Asia Pacific Static Ads Market by Country
- 6.3.2.2 Asia Pacific Dynamic Ads Market by Country
- 6.3.2.3 Asia Pacific Advergaming Market by Country
- 6.3.3 Asia Pacific In-Game Advertising Market by Country
- 6.3.3.1 China In-Game Advertising Market
- 6.3.3.1.1 China In-Game Advertising Market by Device Type
- 6.3.3.1.2 China In-Game Advertising Market by Type
- 6.3.3.2 Japan In-Game Advertising Market
- 6.3.3.2.1 Japan In-Game Advertising Market by Device Type
- 6.3.3.2.2 Japan In-Game Advertising Market by Type
- 6.3.3.3 India In-Game Advertising Market
- 6.3.3.3.1 India In-Game Advertising Market by Device Type
- 6.3.3.3.2 India In-Game Advertising Market by Type
- 6.3.3.4 South Korea In-Game Advertising Market
- 6.3.3.4.1 South Korea In-Game Advertising Market by Device Type
- 6.3.3.4.2 South Korea In-Game Advertising Market by Type
- 6.3.3.5 Singapore In-Game Advertising Market
- 6.3.3.5.1 Singapore In-Game Advertising Market by Device Type
- 6.3.3.5.2 Singapore In-Game Advertising Market by Type
- 6.3.3.6 Malaysia In-Game Advertising Market
- 6.3.3.6.1 Malaysia In-Game Advertising Market by Device Type
- 6.3.3.6.2 Malaysia In-Game Advertising Market by Type
- 6.3.3.7 Rest of Asia Pacific In-Game Advertising Market
- 6.3.3.7.1 Rest of Asia Pacific In-Game Advertising Market by Device Type
- 6.3.3.7.2 Rest of Asia Pacific In-Game Advertising Market by Type
- 6.3.3.1 China In-Game Advertising Market
- 6.3.1 Asia Pacific In-Game Advertising Market by Device Type
- 6.4 LAMEA In-Game Advertising Market
- 6.4.1 LAMEA In-Game Advertising Market by Device Type
- 6.4.1.1 LAMEA PC/Laptop Market by Country
- 6.4.1.2 LAMEA Smartphone/Tablet Market by Country
- 6.4.2 LAMEA In-Game Advertising Market by Type
- 6.4.2.1 LAMEA Static Ads Market by Country
- 6.4.2.2 LAMEA Dynamic Ads Market by Country
- 6.4.2.3 LAMEA Advergaming Market by Country
- 6.4.3 LAMEA In-Game Advertising Market by Country
- 6.4.3.1 Brazil In-Game Advertising Market
- 6.4.3.1.1 Brazil In-Game Advertising Market by Device Type
- 6.4.3.1.2 Brazil In-Game Advertising Market by Type
- 6.4.3.2 Argentina In-Game Advertising Market
- 6.4.3.2.1 Argentina In-Game Advertising Market by Device Type
- 6.4.3.2.2 Argentina In-Game Advertising Market by Type
- 6.4.3.3 UAE In-Game Advertising Market
- 6.4.3.3.1 UAE In-Game Advertising Market by Device Type
- 6.4.3.3.2 UAE In-Game Advertising Market by Type
- 6.4.3.4 Saudi Arabia In-Game Advertising Market
- 6.4.3.4.1 Saudi Arabia In-Game Advertising Market by Device Type
- 6.4.3.4.2 Saudi Arabia In-Game Advertising Market by Type
- 6.4.3.5 South Africa In-Game Advertising Market
- 6.4.3.5.1 South Africa In-Game Advertising Market by Device Type
- 6.4.3.5.2 South Africa In-Game Advertising Market by Type
- 6.4.3.6 Nigeria In-Game Advertising Market
- 6.4.3.6.1 Nigeria In-Game Advertising Market by Device Type
- 6.4.3.6.2 Nigeria In-Game Advertising Market by Type
- 6.4.3.7 Rest of LAMEA In-Game Advertising Market
- 6.4.3.7.1 Rest of LAMEA In-Game Advertising Market by Device Type
- 6.4.3.7.2 Rest of LAMEA In-Game Advertising Market by Type
- 6.4.3.1 Brazil In-Game Advertising Market
- 6.4.1 LAMEA In-Game Advertising Market by Device Type
Chapter 7. Company Profiles
- 7.1 Google LLC
- 7.1.1 Company Overview
- 7.1.2 Financial Analysis
- 7.1.3 Segmental and Regional Analysis
- 7.1.4 Research & Development Expense
- 7.1.5 Recent strategies and developments:
- 7.1.5.1 Partnerships, Collaborations, and Agreements:
- 7.2 Electronic Arts, Inc.
- 7.2.1 Company Overview
- 7.2.2 Financial Analysis
- 7.2.3 Research & Development Expenses
- 7.2.4 Recent strategies and developments:
- 7.2.4.1 Partnerships, Collaborations, and Agreements:
- 7.3 Activision Blizzard, Inc.
- 7.3.1 Company Overview
- 7.3.2 Financial Analysis
- 7.3.3 Segmental and Regional Analysis
- 7.3.4 Recent strategies and developments:
- 7.3.4.1 Partnerships, Collaborations, and Agreements:
- 7.4 ironSource Ltd.
- 7.4.1 Company Overview
- 7.4.2 Financial Analysis
- 7.4.3 Regional Analysis
- 7.4.4 Research & Development Expense
- 7.5 WPP Plc
- 7.5.1 Company Overview
- 7.5.2 Financial Analysis
- 7.5.3 Segmental and Regional Analysis
- 7.5.4 Recent strategies and developments:
- 7.5.4.1 Partnerships, Collaborations, and Agreements:
- 7.6 Motive Interactive, Inc.
- 7.6.1 Company Overview
- 7.7 Playwire LLC
- 7.7.1 Company Overview
- 7.8 RapidFire, Inc.
- 7.8.1 Company Overview
- 7.9 Anzu Virtual Reality Ltd.
- 7.9.1 Company Overview
- 7.9.2 Recent strategies and developments:
- 7.9.2.1 Partnerships, Collaborations, and Agreements: