|
|
市場調査レポート
商品コード
1130698
ゲーム内広告 (IGA) の世界市場In-Game Advertising (IGA): Global Markets |
||||||
|
|
|||||||


| ゲーム内広告 (IGA) の世界市場 |
|
出版日: 2022年09月27日
発行: BCC Research
ページ情報: 英文 130 Pages
納期: 即納可能
|
- 全表示
- 概要
- 図表
- 目次
世界のゲーム内広告 (IGA) の市場規模は、2022年の78億米ドルから2027年には139億米ドルに拡大し、2022年から2027年までのCAGRは12.2%と予測されています。
動画広告の部門は、2022年の39億米ドルから2027年には73億米ドルに増加し、2022年から2027年までのCAGRは13.6%と予測されています。静止画広告の部門は、2022年の27億米ドルから2027年には42億米ドルに増加し、2022年から2027年までのCAGRは9.6%と推定されています。
当レポートでは、世界のゲーム内広告 (IGA) の市場を調査し、市場および技術の概要、市場影響因子の分析、市場規模の推移・予測、各種区分・地域/主要国別の内訳、競合環境、主要企業のプロファイルなどをまとめています。
目次
第1章 イントロダクション
第2章 サマリー・ハイライト
第3章 市場概要
- 市場影響因子
- 利用事例の分析
第4章 市場力学・動向
- イントロダクション
- 市場促進要因
- 市場抑制要因
- 市場課題
- 市場機会
- 市場動向
- バーチャルリアリティ(VR)
- メタバース
- 5G技術
- クラウドゲーミング
第5章 市場内訳:広告タイプ別
- 静止画広告
- 動画広告
- アドバゲーミング
第6章 市場内訳:デバイスタイプ別
- PC/ラップトップ
- スマートフォン・タブレット
第7章 市場内訳:エンドユーザー別
- X世代
- Y世代・ミレニアル世代
- Z世代
第8章 市場内訳:地域別
- 北米
- 欧州
- アジア太平洋
- その他の地域
第9章 競合情勢
- 主要企業
- IGA価格モデル
- 戦略分析
第10章 企業プロファイル
- ACTIVISION BLIZZARD INC.
- ADVERTY AB
- ALPHABET INC.
- ANZU VIRTUAL REALITY LTD.
- BIDSTACK GROUP PLC
- DENTSU GROUP INC.
- ELECTRONIC ARTS INC.
- FRAMEPLAY
- FREAKOUT HOLDINGS INC.
- GADSME
- INMOBI
- IRONSOURCE LTD.
- LANDVAULT
- META PLATFORMS INC.
- NEXTPLAY TECHNOLOGIES INC.
- OVERWOLF LTD.
- RAPIDFIRE INC.
- SAYOLLO INC.
- VIANT TECHNOLOGY LLC
- VIVENDI SE
第11章 付録:略語
List of Tables
- Summary Table : Global Market for IGA, by Type of Ad, Through 2027
- Table 1 : IGA Use Cases
- Table 2 : Global Market for IGA, by Type of Ad, Through 2027
- Table 3 : Global Market for Static Ads in IGA, by Region, Through 2027
- Table 4 : Global Market for Dynamic Ads in IGA, by Region, Through 2027
- Table 5 : Global Market for Advergaming in IGA, by Region, Through 2027
- Table 6 : Global Market for IGA, by Device Type, Through 2027
- Table 7 : Global Market for PC/Laptop Devices in IGA, by Region, Through 2027
- Table 8 : Global Market for Smartphone/Tablet Devices in IGA, by Region, Through 2027
- Table 9 : Global Market for IGA, by End User, Through 2027
- Table 10 : Global Market for IGA Used by Gen Xers, by Region, Through 2027
- Table 11 : Global Market for IGA by Gen Y/Millennial End Users, by Region, Through 2027
- Table 12 : Global Market for IGA by Gen Z End Users, by Region, Through 2027
- Table 13 : Global Market for IGA, by Region, Through 2027
- Table 14 : North American Market for IGA, by Country, Through 2027
- Table 15 : North American Market for IGA, by Type of Ad, Through 2027
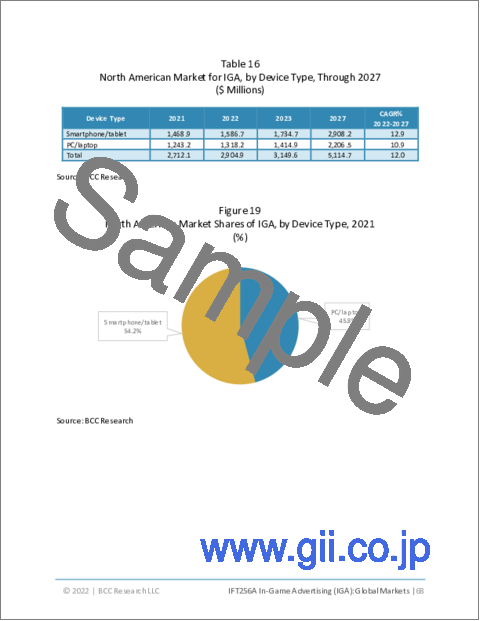
- Table 16 : North American Market for IGA, by Device Type, Through 2027
- Table 17 : North American Market for IGA, by End User, Through 2027
- Table 18 : European Market for IGA, by Country, Through 2027
- Table 19 : European Market for IGA, by Type of Ad, Through 2027
- Table 20 : European Market for IGA, by Device Type, Through 2027
- Table 21 : European Market for IGA, by End User, Through 2027
- Table 22 : Asia-Pacific Market for IGA, by Country, Through 2027
- Table 23 : Asia-Pacific Market for IGA, by Type of Ad, Through 2027
- Table 24 : Asia-Pacific Market for IGA, by Device Type, Through 2027
- Table 25 : Asia-Pacific Market for IGA, by End User, Through 2027
- Table 26 : RoW Market for IGA, by Sub-region, Through 2027
- Table 27 : RoW Market for IGA, by Type of Ad, Through 2027
- Table 28 : RoW Market for IGA, by Device Type, Through 2027
- Table 29 : RoW Market for IGA, by End User, Through 2027
- Table 30 : Top 20 Players in the IGA Market, 2021
- Table 31 : Market Ranking of Established IGA Vendors in 2021
- Table 32 : Market Ranking of Medium-sized IGA Vendors in 2021
- Table 33 : Market Ranking of Small IGA Vendors in 2021
- Table 34 : Pricing Models of IGA Vendors
- Table 35 : Product Launches and Developments, September 2020 to August 2022
- Table 36 : Agreements, Collaborations and Partnerships, September 2020 to August 2022
- Table 37 : M&A, 2020-2022
- Table 38 : Investments and Funding, January 2021 to June 2022
- Table 39 : Activision Blizzard Inc.: Company Snapshot
- Table 40 : Activision Blizzard, Inc.: Product Information
- Table 41 : Activision Blizzard, Inc.: Annual Revenue, 2019-2021
- Table 42 : Adverty AB: Company Snapshot
- Table 43 : Adverty AB: Product Information
- Table 44 : Adverty AB: Annual Revenue, 2019-2021
- Table 45 : Alphabet Inc.: Company Snapshot
- Table 46 : Alphabet Inc.: Product Information
- Table 47 : Alphabet Inc.: Annual Revenue, 2019-2021
- Table 48 : Anzu Virtual Reality Ltd.: Company Snapshot
- Table 49 : Anzu Virtual Reality Ltd.: Product Information
- Table 50 : Bidstack Group PLC: Company Snapshot
- Table 51 : Bidstack Group PLC: Product Information
- Table 52 : Bidstack Group PLC: Annual Revenue, 2019-2021
- Table 53 : Dentsu Group Inc.: Company Snapshot
- Table 54 : Dentsu Group Inc.: Product Information
- Table 55 : Dentsu Group Inc.: Annual Revenue, 2019-2021
- Table 56 : Electronic Arts Inc.: Company Snapshot
- Table 57 : Electronic Arts Inc.: Product Information
- Table 58 : Electronic Arts Inc.: Annual Revenue, 2019-2021
- Table 59 : Frameplay: Company Snapshot
- Table 60 : Frameplay: Product Information
- Table 61 : FreakOut Holdings Inc.: Company Snapshot
- Table 62 : FreakOut Holdings Inc.: Product Information
- Table 63 : FreakOut Holdings inc.: Annual Revenue, 2019-2021
- Table 64 : Gadsme: Company Snapshot
- Table 65 : Gadsme: Product Information
- Table 66 : InMobi: Company Snapshot
- Table 67 : InMobi: Product Information
- Table 68 : ironSource Ltd.: Company Snapshot
- Table 69 : IronSource Ltd.: Product Information
- Table 70 : IronSource Ltd.: Annual Revenue, 2019-2021
- Table 71 : Landvault: Company Snapshot
- Table 72 : LandVault: Product Information
- Table 73 : Meta Platforms Inc.: Company Snapshot
- Table 74 : Meta Platforms Inc.: Product Information
- Table 75 : Meta Platforms Inc.: Annual Revenue, 2019-2021
- Table 76 : NextPlay Technologies Inc.: Company Snapshot
- Table 77 : NextPlay Technologies Inc.: Product Information
- Table 78 : NextPlay Technologies Inc.: Annual Revenue, 2019-2021
- Table 79 : Overwolf Ltd.: Company Snapshot
- Table 80 : Overwolf Ltd.: Product Information
- Table 81 : RapidFire Inc.: Company Snapshot
- Table 82 : RapidFire Inc.: Product Information
- Table 83 : Sayollo Inc.: Company Snapshot
- Table 84 : Sayollo, Inc.: Product Information
- Table 85 : Viant Technology LLC: Company Snapshot
- Table 86 : Viant Technology: Product Information
- Table 87 : Viant Technology: Annual Revenue, 2019-2021
- Table 88 : Vivendi SE: Company Snapshot
- Table 89 : Vivendi SE: Product Information
- Table 90 : Vivendi SE: Annual Revenue, 2019-2021
- Table 91 : Abbreviations Used in This Report
List of Figures
Figure A : Top-down and Bottom-up Approach for Global Market for IGA
- Summary Figure : Global Market Shares of IGA, by Type of Ad, 2021
- Figure 1 : Critical Reasons for the Growth of IGA, According to Advertisers, 2021
- Figure 2 : Porter's Five Forces Analysis
- Figure 3 : IGA Market Dynamics
- Figure 4 : 5G Connectivity and Adoption Rates, Through 2025
- Figure 5 : Global Market Shares of IGA, by Type of Ad, 2021
- Figure 6 : Global Market Shares of Static Ads in IGA, by Region, 2021
- Figure 7 : Global Market Shares of Dynamic Ads in IGA, by Region, 2021
- Figure 8 : Global Market Shares of Advergaming in IGA, by Region, 2021
- Figure 9 : Global Market Shares of IGA, by Device Type, 2021
- Figure 10 : Global Market Shares of PC/Laptop Devices in IGA, by Region, 2021
- Figure 11 : Global Market Shares of Smartphone/Tablet Devices in IGA, by Region, 2021
- Figure 12 : Global Market Shares of IGA, by End User, 2021
- Figure 13 : Global Market Shares of I GA Used by Gen Xers, by Region, 2021
- Figure 14 : Global Market Shares of IGA by Gen Y/Millennial End Users, by Region, 2021
- Figure 15 : Global Market Shares of IGA by Gen Z End Users, by Region, 2021
- Figure 16 : Global Market Shares of IGA, by Region, 2021
- Figure 17 : North American Market Shares of IGA, by Country, 2021
- Figure 18 : North American Market Shares of IGA, by Type of Ad, 2021
- Figure 19 : North American Market Shares of IGA, by Device Type, 2021
- Figure 20 : North American Market Shares of IGA, by End User, 2021
- Figure 21 : European Market Shares of IGA, by Country, 2021
- Figure 22 : European Market Shares of IGA, by Type of Ad, 2021
- Figure 23 : European Market Shares of IGA, by Device Type, 2021
- Figure 24 : European Market Shares of IGA, by End User, 2021
- Figure 25 : Asia-Pacific Market Shares of IGA, by Country, 2021
- Figure 26 : Asia-Pacific Market Shares of IGA, by Type of Ad, 2021
- Figure 27 : Asia-Pacific Market Shares of IGA, by Device Type, 2021
- Figure 28 : Asia-Pacific Market Shares of IGA, by End User, 2021
- Figure 29 : RoW Market Shares of IGA, by Sub-region, 2021
- Figure 30 : RoW Market Shares of IGA, by Type of Ad, 2021
- Figure 31 : RoW Market Shares of IGA, by Device Type, 2021
- Figure 32 : RoW Market Shares of IGA, by End User, 2021
- Figure 33 : Activision Blizzard, Inc.: Sales Share, by Business Segment, 2021
- Figure 34 : Activision Blizzard, Inc.: Sales Share, by Region, 2021
- Figure 35 : Adverty AB: Sales Share, by Region/Country, 2021
- Figure 36 : Alphabet Inc.: Sales Share, by Business Segment, 2021
- Figure 37 : Alphabet Inc.: Sales Share, by Region/Country, 2021
- Figure 38 : Bidstack Group PLC: Sales Share, by Region/Country, 2021
- Figure 39 : Dentsu Group Inc.: Sales Share, by Platform Segment, 2021
- Figure 40 : Dentsu Group Inc.: Sales Share, by Region/Country, 2021
- Figure 41 : Electronic Arts Inc.: Sales Share, by Platform Segment, 2021
- Figure 42 : Electronic Arts Inc.: Sales Share, by Region, 2021
- Figure 43 : FreakOut Holdings inc.: Sales Share, by Segment, 2021
- Figure 44 : FreakOut Holdings Inc.: Sales Share, by Region/Country, 2021
- Figure 45 : IronSource Ltd.: Sales Share, by Business Segment, 2021
- Figure 46 : IronSource Ltd.: Sales Share, by Region/Country, 2021
- Figure 47 : Meta Platforms Inc.: Sales Share, by Platform Segment, 2021
- Figure 48 : Meta Platforms Inc.: Sales Share, by Region/Country, 2021
- Figure 49 : NextPlay Technologies Inc.: Sales Share, by Segment, 2021
- Figure 50 : NextPlay Technologies Inc.: Sales Share, by Region/Country, 2021
- Figure 51 : Vivendi SE: Sales Share, by Business Segment, 2021
- Figure 52 : Vivendi SE: Sales Share, by Region/Country, 2021
Highlights:
The global in-game advertising (IGA) market should reach $13.9 billion by 2027 from $7.8 billion in 2022 at a compound annual growth rate (CAGR) of 12.2% for the forecast period of 2022 to 2027.
Dynamic ads segment of the global IGA market is expected to grow from $3.9 billion in 2022 to $7.3 billion in 2027 at a CAGR of 13.6% for the forecast period of 2022 to 2027.
Static ads segment of the global IGA market is expected to grow from $2.7 billion in 2022 to $4.2 billion in 2027 at a CAGR of 9.6% for the forecast period of 2022 to 2027.
Report Scope:
This report provides an overview of the global market for IGA and analyzes market trends. Using 2021 as the base year, the report provides estimated market data for the forecast period of 2022 through 2027. This report also offers insights on the drivers, restraints and opportunities for the market, which were gathered through primary and secondary research. It also covers various market factors, including COVID-19 impact, Porter's Five Forces, PEST analysis and use case analysis.
This report has been prepared in a simple, easy-to-understand format, with tables and charts/figures. The report's scope includes a detailed study of global and regional markets by advertising type, device type and end user. The qualitative and quantitative data of all segments are provided in the report. The report examines each segment, determines its current market size and estimates its future market sizes with compound annual growth rates (CAGRs).
The report also provides profiles of the significant IGA players and their strategies for enhancing their market presence. The report also discusses the competitive landscape, with a ranking of the top IGA providers in 2021.
Report Includes:
- 42 data tables and 50 additional tables
- A comprehensive overview of the global market for in-game advertising (IGA)
- Analyses of the global market trends, with market revenue data for 2021, estimates for 2022, forecasts for 2023, and projections of compound annual growth rates (CAGRs) through 2027
- Estimation of the actual market size and revenue forecast for in-game advertising market, and corresponding market share analysis based on type of ads, device, end-user, and region
- Updated information on market opportunities and drivers, key shifts and regulations, industry specific challenges, and other region-specific macroeconomic factors that will shape this market demand in the coming years (2022-2027)
- Coverage of the technological, economic, and business considerations of the in-game advertising industry, and its vendor landscape
- Latest information on the recent market developments, merger and acquisition deals, partnerships, agreements, collaborations, and other strategic alliances within global in-game advertising market
- Market share analysis of the key market participants in global IGA market, their product portfolio, research priorities, and the company competitive landscape
- Descriptive company profiles of the market leading players, including Alphabet Inc., Dentsu Group Inc., FreakOut Holdings Inc., Meta Platforms Inc. and Vivendi SE
Table of Contents
Chapter 1 Introduction
- 1.1 Study Goals and Objectives
- 1.2 Reasons for Doing This Study
- 1.3 Scope of Report
- 1.4 Information Sources
- 1.5 Research Methodology
- 1.6 Intended Audience
- 1.7 Geographic Breakdown
- 1.8 Analyst's Credentials
- 1.9 BCC Custom Research
- 1.10 Related BCC Research Reports
Chapter 2 Summary and Highlights
Chapter 3 Market Overview
- 3.1 Introduction
- 3.1.1 Market Evolution/History
- 3.2 Market Factors
- 3.2.1 COVID-19 Impact
- 3.2.2 Porter's Five Forces Analysis
- 3.2.3 PEST Analysis
- 3.3 Use-Case Analysis
Chapter 4 Market Dynamics and Trends
- 4.1 Introduction
- 4.1.1 Market Drivers
- 4.1.2 Market Restraints
- 4.1.3 Market Challenges
- 4.1.4 Market Opportunities
- 4.2 Market Trends
- 4.2.1 Virtual Reality (VR)
- 4.2.2 Metaverse
- 4.2.3 5G Technology
- 4.2.4 Cloud Gaming
Chapter 5 Market Breakdown by Type of Ad
- 5.1 Introduction
- 5.2 Static Ads
- 5.2.1 Regional Markets for Static Ads
- 5.3 Dynamic Ads
- 5.3.1 Types of DIGA
- 5.3.2 Regional Markets for Dynamic Ads
- 5.4 Advergaming
- 5.4.1 Regional Markets for Advergaming
Chapter 6 Market Breakdown by Device Type
- 6.1 Introduction
- 6.2 PC/Laptop
- 6.2.1 Regional Markets for PC/Laptop Devices
- 6.3 Smartphones/Tablets
- 6.3.1 Regional Markets for Smartphone/Tablet Devices
Chapter 7 Market Breakdown by End User
- 7.1 Introduction
- 7.2 Gen X
- 7.2.1 Regional Markets for Gen X
- 7.3 Gen Y/Millennials
- 7.3.1 Regional Markets for Millennials
- 7.4 Gen Z
- 7.4.1 Regional Markets for Gen Z
Chapter 8 Market Breakdown by Region
- 8.1 Introduction
- 8.2 North American Market Outlook
- 8.2.1 North American Market, by Country
- 8.2.2 North American Market, by Segment
- 8.3 European Market Outlook
- 8.3.1 European Market, by Country
- 8.3.2 European Market, by Segments
- 8.4 Asia-Pacific Market Outlook
- 8.4.1 Asia-Pacific Market, by Country
- 8.4.2 Asia-Pacific Market, by Segment
- 8.5 Rest of the World Market Outlook
- 8.5.1 South America
- 8.5.2 RoW Market, by Segment
Chapter 9 Competitive Landscape
- 9.1 Top Companies
- 9.1.1 Market Ranking of IGA Players
- 9.2 IGA Pricing Models
- 9.3 Strategic Analysis
- 9.3.1 Product Launches and Developments
- 9.3.2 Agreements, Collaborations and Partnerships
- 9.3.3 Mergers and Acquisitions
- 9.3.4 Investments and Funding
Chapter 10 Company Profiles
- ACTIVISION BLIZZARD INC.
- ADVERTY AB
- ALPHABET INC.
- ANZU VIRTUAL REALITY LTD.
- BIDSTACK GROUP PLC
- DENTSU GROUP INC.
- ELECTRONIC ARTS INC.
- FRAMEPLAY
- FREAKOUT HOLDINGS INC.
- GADSME
- INMOBI
- IRONSOURCE LTD.
- LANDVAULT
- META PLATFORMS INC.
- NEXTPLAY TECHNOLOGIES INC.
- OVERWOLF LTD.
- RAPIDFIRE INC.
- SAYOLLO INC.
- VIANT TECHNOLOGY LLC
- VIVENDI SE