|
|
市場調査レポート
商品コード
1654630
会話型AIの世界市場:2025-2029年Global Conversational AI Market: 2025-2029 |
||||||
|
|||||||
|
|||||||

| 会話型AIの世界市場:2025-2029年 |
|
出版日: 2025年02月18日
発行: Juniper Research Ltd
ページ情報: 英文
納期: 即日から翌営業日
|

全表示
- 概要
- 目次
"会話AIは今後3年間で世界でに570億米ドルの収益を生み出す見通し"
| 主要統計 | |
|---|---|
| 2025年の総収益: | 146億米ドル |
| 2029年の総収益: | 308億米ドル |
| 2025~2029年の市場成長率: | 110% |
| 予測期間: | 2025-2029年 |
当調査スイートは、進化する会話型AI市場を促進する主要要因の包括的な分析で構成されており、特にビジネスコミュニケーションの自動化を促進する技術的進歩に焦点を当てています。本レポートにより、会話型AIベンダーや通信サービスプロバイダーなどのステークホルダーは、会話型AIの主な投資機会がどこにあるかを理解することができます。
会話AI市場レポートには、個別に購入可能ないくつかのオプションが含まれています。これには、会話型AI市場の企業導入と今後の成長に関する市場予測へのアクセスや、最新の市場動向と機会に焦点を当てた詳細な調査が含まれます。また、会話型AI分野の主要企業の分析を含む競合リーダーボードなどの資料も含まれています。
主な特徴
- 市場力学:会話AI市場の将来展望に関する詳細な洞察を提供し、生成AIとエージェントAIがビジネスコミュニケーションの自動化の将来に与える影響など、今後の市場成長の主な促進要因を評価します。採用を促進する技術的進歩、コスト予測可能性の重要性、会話型メッセージングの使用事例に対する企業需要の増加など、今年の会話型AI市場の成長に影響を与える主な要因を取り上げています。また、この調査では、銀行・金融、小売、ヘルスケア、運輸などの主要産業における会話型AIサービスに対する企業の需要についても調査しています。さらに、61カ国の市場機会を評価する国別準備指数も含まれており、会話型AIベンダーにとって今年注目すべき国を特定しています。
- 主な要点と戦略的提言:会話型AI市場における主な発展機会、業界動向、知見を詳細に分析し、ステークホルダーに対する主要な戦略的提言を添えています。
- ベンチマーク業界予測:会話型AIを導入する企業の総数や会話型AIからの収益総額の5年予測を含む、会話型AIの市場規模と予測を提供します。また、ウェブベース、アプリベース、オーバーザトップ (OTT) ベース、リッチコミュニケーションサービス (RCS) ベースのチャットボットやボイスボットなど、チャットボットのタイプ別にチャットボットの総ユーザー数やアクセス数を予測しています。また、各チャットボットタイプの会話型コマースの収益についても調査しています。
- Juniper Researchの競合リーダーボード:会話型AIベンダー22社の能力を評価します。
サンプルビュー
市場データ・予測レポート
市場動向・戦略レポート
現在の市場情勢を包括的に分析し、戦略的な提言を行います。
市場データ&予測レポート
当調査スイートには、68の表と31,000を超えるデータポイントの市場予測データ一式へのアクセスが含まれています。調査スイートには以下の指標が含まれます:
- チャットボットの総ユーザー数とアクセス数:
- ウェブベース
- アプリベース
- OTTベース
- RCSベース
- ボイスボット
- 会話型コマースへの総支出額
- 会話型AIを導入している企業の総数
- 会話型AIによる総収益
Juniper Research Interactive Forecast Excelには以下の機能があります:
- 統計分析:データ期間中のすべての地域と国について表示され、特定の指標を検索できます。グラフは簡単に変更でき、クリップボードにエクスポートできます。
- 国別データツール:このツールでは、予測期間中のすべての主要地域と国の指標を見ることができます。検索バーで表示する指標を絞り込むことができます。
- 国別比較ツール:ユーザーは国を選択し、特定の国についてそれぞれを比較することができます。このツールには、グラフをエクスポートする機能が含まれています。
- What-if分析:5つのインタラクティブなシナリオを通じて、ユーザーは予測の前提条件と比較することができます。
目次
市場動向と戦略
第1章 重要ポイントと戦略的推奨事項
- 重要ポイント
- 戦略的推奨事項
第2章 将来の市場見通し
- 将来の市場展望- 会話型AI
- 会話型AI市場の主な促進要因
- 会話型AIの導入を促進する技術の進歩
- 会話型AIサービスのコスト削減とコスト予測可能性による導入率の向上
- 会話型メッセージングに対する消費者の需要の増加
- 将来の市場展望- 会話型コマース
- 会話型コマース市場の主な促進要因
- スーパーアプリの人気の高まり
- 会話型コマース市場の主な促進要因
- 規制状況のナビゲート
- ガードレールを作成する際のガイダンスの提供
第3章 業界の需要
- 業界の需要
- 銀行・金融
- 小売
- ヘルスケア
- 輸送
第4章 国別準備指数
- 会話型AI国別準備指数
- 重点市場
- 成長市場
- 飽和市場
- 新興国市場
競合リーダーボード
第1章 競合リーダーボード
第2章 ベンダープロファイル
- AWS
- Cisco Webex
- CM.com
- Cognigy
- Genesys
- Gupshup
- IBM
- Infobip
- IntelePeer
- Kore.ai
- LivePerson
- Microsoft Azure
- Route Mobile
- Sinch
- Soprano Design
- Sprinklr
- Tata Communications
- Unifonic
- Vonage
- Yellow.ai
- Zendesk
- Juniper Researchリーダーボード評価調査手法
- 制限と解釈
- 関連調査
データと予測
第1章 主要な市場予測と要点
- 会話型AI市場の概要と将来の見通し
- 予測手法
- チャットボットユーザー数
第2章 会話型コマース
- チャットボットによる会話型コマース
- ウェブベースチャットボット:予測手法
- アプリベースチャットボット:予測手法
- RCSベースチャットボット:予測手法
- OTTベースチャットボット:予測手法
- 音声ボット:予測手法
- アクセスされたチャットボット数
- 会話型コマースによる支出額
第3章 会話型AIサービスの支出額
- 会話型AIサービスの支出額
- 予測手法
- 会話型AIを活用した企業
- 会話型AIサービスの収益
'Conversational AI to Generate $57 Billion of Revenue Globally Over Next Three Years'
| KEY STATISTICS | |
|---|---|
| Total revenue in 2025: | $14.6bn |
| Total revenue in 2029: | $30.8bn |
| Market growth 2025-2029: | 110% |
| Forecast period: | 2025-2029 |
Overview
Our latest "Conversational AI" research suite comprises a comprehensive analysis of the key factors driving this evolving market in 2025, with specific focus on technological advancements enabling greater automation of business communications; including generative AI and agentic AI. The report enables stakeholders, from conversational AI vendors and communication service providers, to understand where the key investment opportunities are for conversational AI next year.
The conversational AI market report includes several different options that can be purchased separately. This includes access to a market forecast of the enterprise adoption and future growth of the conversational AI market, and a detailed study highlighting the latest market trends and opportunities. It also includes a Competitor Leaderboard document containing an analysis of the major players in the conversational AI space. The coverage can also be purchased as a full research suite, containing all these elements and including a substantial discount.
The study will provide stakeholders with key information on how to succeed in the conversational AI market, particularly as the market moves at a rapid pace. With many vendors offering competing conversational AI services, the report provides insight into the tools vendors must offer to provide the highest value to enterprises. Its extensive coverage makes the conversational AI research suite an incredibly valuable resource for examining the future of this market.
Key Features
- Market Dynamics: Provides detailed insight into the future outlook of the conversational AI market; assessing key drivers to future market growth, including the impact that generative AI and agentic AI will have on the future of business communication automation. It addresses the key factors that will impact the growth of the conversational AI market this year, including the technological advancements driving adoption, the importance of cost predictability, and increased enterprise demand for conversational messaging use cases. The research also explores enterprise demand for conversational AI services across key industries, including banking and finance, retail, healthcare, and transport. Moreover, it includes a Country Readiness Index which assesses the market opportunities across 61 countries, identifying countries which must be of focus for conversational AI vendors this year.
- Key Takeaways & Strategic Recommendations: In-depth analysis of key development opportunities, industry trends and findings within the conversational AI market; accompanied by key strategic recommendations for stakeholders.
- Benchmark Industry Forecasts: This provides market size and forecasts for conversational AI, including 5-year forecasts for total number of enterprises implementing conversational AI, and total revenue from conversational AI. It also forecasts the total number of chatbot users and accesses by chatbot type, including web-based, app-based, over-the-top (OTT)-based, and rich communications services (RCS)-based chatbots, as well as voicebots. It also looks at conversational commerce revenue across each chatbot type.
- Juniper Research Competitor Leaderboard: Key industry player capability and capacity assessment for 22 conversational AI vendors, via the Juniper Research Competitor Leaderboard.
SAMPLE VIEW
Market Data & Forecasting Report
The numbers tell you what's happening, but our written report details why, alongside the methodologies.
Market Trends & Strategies Report
A comprehensive analysis of the current market landscape, alongside strategic recommendations.
Market Data & Forecasting Report
The market-leading research suite for the "Conversational AI" market includes access to the full set of market forecast data of 68 tables and over 31,000 datapoints. Metrics in the research suite include:
- Total Number of Chatbot Users and Accesses, split into:
- Web-based
- App-based
- OTT-based
- RCS-based
- Voicebots
- Total Spend on Conversational Commerce
- Total Number of Businesses Implementing Conversational AI
- Total Revenue from Conversational AI
Juniper Research Interactive Forecast Excel contains the following functionality:
- Statistics Analysis: Users benefit from the ability to search for specific metrics, displayed for all regions and countries across the data period. Graphs are easily modified and can be exported to the clipboard.
- Country Data Tool: This tool lets users look at metrics for all key regions and countries in the forecast period. Users can refine the metrics displayed via a search bar.
- Country Comparison Tool: Users can select countries and compare each of them for specific countries. The ability to export graphs is included in this tool.
- What-if Analysis: Here, users can compare forecast metrics against their own assumptions, via five interactive scenarios.
Market Trends & Strategies Report
This market study examines the "Conversational AI" landscape in detail; assessing the impact of technological advancements with large language models and agentic AI frameworks. The report delivers an in-depth analysis of the strategic opportunities for vendors; addressing key technological advancements, industry demand, and considerations for navigating the regulatory landscape surrounding AI.
It also evaluates country level opportunities for conversational AI growth via Juniper Research's Country Readiness Index; identifying the key markets that conversational AI vendors should focus on next year.
Competitor Leaderboard Report
This Conversational AI market study includes a Competitor Leaderboard report, which provides detailed evaluation and market positioning of 22 conversational AI vendors. The vendors are positioned as established leaders, leading challengers, or disruptors and challengers based on product and capability assessments.
Juniper Research Competitor Leaderboard for Conversational AI, includes the following key players:
|
|
This document is centred around the Juniper Research Competitor Leaderboard; a vendor positioning tool that provides an at-a-glance view of the competitive landscape in a market, backed by a robust methodology.
Table of Contents
Market Trends & Strategies
1. Key Takeaways & Strategic Recommendations
- 1.1 Key Takeaways
- 1.2. Strategic Recommendations
2. Future Market Outlook
- 2.1. Introduction
- 2.2. Future Market Outlook - Conversational AI
- Figure 2.1: Total Conversational AI Service Revenue ($m), 2025-2029, Split by 8 Key Regions
- Figure 2.2: Total Number of Chatbot Users in 2025 (m), Split by 8 Key Regions
- 2.2.1 Key Drivers of the Conversational AI Market
- i. Technological Advancements Driving Conversational AI Adoption
- ii. Reduced Cost and Cost Predictability of Conversational AI Services will Drive Higher Adoption Rates
- iii. Increased Consumer Demand for Conversational Messaging
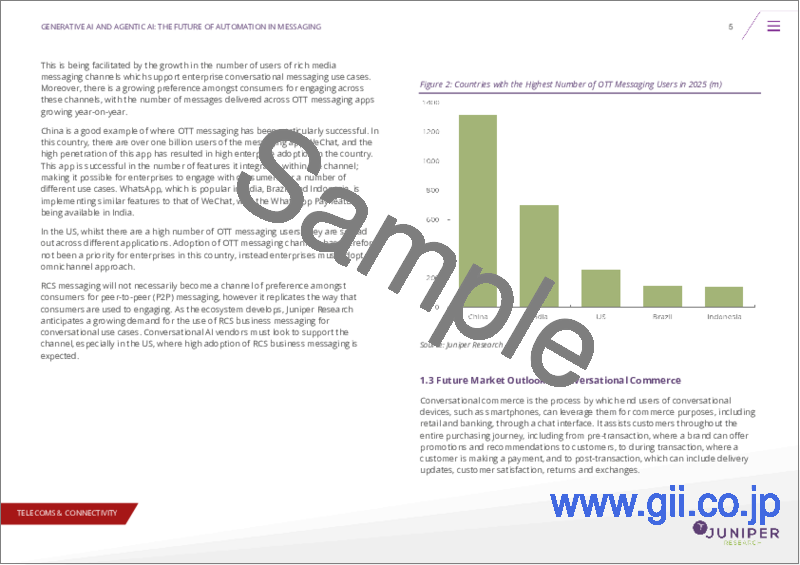
- Figure 2.3: Countries With the Highest Number of OTT Messaging Users in 2025 (m)
- 2.3. Future Market Outlook - Conversational Commerce
- Figure 2.4: Total Spend on Goods or Services via Chatbots ($m), 2025-2029, Split by 8 Key Regions
- 2.3.1. Key Drivers of the Conversational Commerce Market
- i. Growing Popularity of Superapps
- 2.4. Navigating the Regulatory Landscape
- i. Provide Guidance when Creating Guardrails
3. Industry Demand
- 3.1.1. Industry Demand
- i. Banking and Finance
- ii. Retail
- iii. Healthcare
- iv. Transport
4. Country Readiness Index
- 4.1. Conversational AI Country Readiness Index
- Figure 4.1: Countries in Each Region
- Table 4.2: Juniper Research Conversational AI Country Readiness Index: Scoring Criteria
- Figure 4.3: Juniper Research Country Readiness Index - Conversational AI
- Table 4.4: Conversational AI Country Readiness Index: Market Segments
- 4.1.1. Focus Markets
- i. Focus Markets Have Started to Implement More Comprehensive AI Regulations and Frameworks
- Figure 4.5: Proportion of B2C Businesses Implementing Conversational AI (%), Key Focus Markets in West Europe in 2025
- ii. Notable Deployments of Conversational AI Will Accelerate Enterprise Adoption
- i. Focus Markets Have Started to Implement More Comprehensive AI Regulations and Frameworks
- 4.1.2. Growth Markets
- i. High Number of OTT Messaging Users
- Figure 4.6: Proportion of Mobile Subscribers that are Active OTT Messaging Users in Growth Markets in 2025 (%)
- i. High Number of OTT Messaging Users
- 4.1.3. Saturated Markets
- i. High A2P Traffic but Limited Opportunity for Conversational Messaging Across Rich Media Channels
- Figure 4.7: Proportion of Mobile Subscribers that are Active OTT Messaging Users (%) in Saturated Markets in 2025
- i. High A2P Traffic but Limited Opportunity for Conversational Messaging Across Rich Media Channels
- 4.1.4. Developing Markets
- i. Lower A2P Messaging Traffic Volumes Indicates Lower Enterprise Readiness for Conversational AI
- Figure 4.8: Average Number of A2P Messages Received per Mobile Subscriber per Month in Select Developing Markets, Compared with Select Focus Markets
- Table 4.9: Juniper Research Country Readiness Index Heatmap: North America
- i. Lower A2P Messaging Traffic Volumes Indicates Lower Enterprise Readiness for Conversational AI
Competitor Leaderboard
1. Competitor Leaderboard
- Table 1.1: Juniper Research Leaderboard: Conversational AI Vendors Included & Product Portfolio
- Figure 1.2: Juniper Research Competitor Leaderboard: Conversational AI Vendors
- Figure 1.3: Juniper Research Leaderboard: Conversational AI Vendors & Positioning
- Figure 1.4: Juniper Research Competitor Leaderboard Heatmap: Conversational AI Vendors: Part 1 of 2
- Table 1.5: Juniper Research Competitor Leaderboard Heatmap: Conversational AI Vendors - Part 2 of 2
2. Vendor Profiles
- 2.1.1. AWS
- i. Corporate Information
- Table 2.1: AWS' Revenue ($bn), 2021-2023
- ii. Geographical Spread
- Figure 2.2: Amazon Web Service Infrastructure Deployments Map, 2023
- iii. Key Clients & Strategic Partnerships
- iv. High-level View of Offerings
- v. Juniper Research's View: Key Strengths & Strategic Development Opportunities
- 2.1.2. Cisco Webex
- i. Corporate Information
- Table 2.3: Cisco's Relevant Acquisitions, 2023 - Present
- Table 2.4: Cisco's Selected Financial Information ($bn), 2021-2023
- ii. Geographical Spread
- iii. Key Clients & Strategic Partnerships
- iv. High-level View of Offerings
- v. Juniper Research's View: Key Strengths & Strategic Development Opportunities
- i. Corporate Information
- 2.1.3. CM.com
- i. Corporate Information
- Table 2.5: Acquisitions Made by CM.com, 2021-present
- Table 2.6: CM.com's Select Financial Information (Euro-m), 2022-2023
- ii. Geographical Spread
- iii. Key Clients & Strategic Partnerships
- iv. High-level View of Offerings
- v. Juniper Research's View: Key Strengths & Strategic Development Opportunities
- i. Corporate Information
- 2.1.4. Cognigy
- i. Corporate Information
- ii. Geographical Spread
- iii. Key Clients & Strategic Partnerships
- iv. High-level View of Offerings
- Figure 2.7: Cognigy.AI Platform
- v. Juniper Research's View: Key Strengths & Strategic Development Opportunities
- 2.1.5. Genesys
- i. Corporate Information
- ii. Geographical Spread
- iii. Key Clients & Strategic Partnerships
- iv. High-level View of Offerings
- v. Juniper Research's View: Key Strengths & Strategic Development Opportunities
- 2.1.6. Google
- i. Corporate Information
- Table 2.8: Google's Relevant Acquisitions, 2014-present
- Table 2.9: Google's Select Financial Information ($billion), 2022-2023
- ii. Geographical Spread
- iii. Key Clients & Strategic Partnerships
- iv. High-level View of Offerings
- v. Juniper Research's View: Key Strengths & Strategic Development Opportunities
- i. Corporate Information
- 2.1.7. Gupshup
- i. Corporate Information
- Table 2.10: Gupshup's Acquisitions, 2021-present
- ii. Geographical Spread
- iii. Key Clients & Strategic Partnerships
- iv. High-level View of Offerings
- v. Juniper Research's View: Key Strengths & Strategic Development Opportunities
- i. Corporate Information
- 2.1.8. IBM
- i. Corporate Information
- Table 2.11: IBM's Select Financial Information ($m), 2022-2023
- Table 2.12: IBM Recent Acquisitions Relevant to its AI and Software Solutions, 2023-present
- ii. Geographical Spread
- iii. Key Clients & Strategic Partnerships
- iv. High-level View of Offerings
- v. Juniper Research's View: Key Strengths & Strategic Development Opportunities
- i. Corporate Information
- 2.1.9. Infobip
- i. Corporate Information
- Table 2.13: Infobip's Acquisitions - April 2021 to Present
- ii. Geographical Spread
- iii. Key Clients & Strategic Partnerships
- iv. High-level View of Offerings
- v. Juniper Research's View: Key Strengths & Strategic Development Opportunities
- i. Corporate Information
- 2.1.10. IntelePeer
- i. Corporate Information
- ii. Geographical Spread
- iii. Key Clients & Strategic Partnerships
- iv. High-level View of Offerings
- v. Juniper Research's View: Key Strengths & Strategic Development Opportunities
- 2.1.11. Kore.ai
- i. Corporate Information
- ii. Geographical Spread
- iii. Key Clients & Strategic Partnerships
- iv. High-level View of Offerings
- v. Juniper Research's View: Key Strengths & Strategic Development Opportunities
- 2.1.12. LivePerson
- i. Corporate Information
- Table 2.14: LivePerson's Financial Revenue ($m) 2021-2023, Split by Segment
- Table 2.15: LivePerson Acquisitions 2018-present
- ii. Geographical Spread
- iii. Key Clients & Strategic Partnerships
- iv. High-level View of Offerings
- v. Juniper Research's View: Key Strengths & Strategic Development Opportunities
- i. Corporate Information
- 2.1.13. Microsoft Azure
- i. Corporate Information
- Table 2.16: Relevant Microsoft Acquisitions, 2018-present
- Table 2.17: Microsoft's Select Financial Information ($billion), FY 2022-FY 2024
- ii. Geographical Spread
- iii. Key Clients & Strategic Partnerships
- iv. High-level View of Offerings
- v. Juniper Research's View: Key Strengths & Strategic Development Opportunities
- i. Corporate Information
- 2.1.14. Route Mobile
- i. Corporate Information
- Table 2.18: Route Mobile's Financial Information (Indian Rupee Cr), FY 2021-22 - FY 2023-24
- ii. Geographical Spread
- iii. Key Clients & Strategic Partnerships
- iv. High-level View of Offerings
- v. Juniper Research's View: Key Strengths & Strategic Development Opportunities
- i. Corporate Information
- 2.1.15. Sinch
- i. Corporate Information
- Table 2.19: Sinch's Most Recent Acquisitions, 2020-2021
- Table 2.20: Sinch's Select Financial Information (SEKm), 2022-2023
- ii. Geographical Spread
- iii. Key Clients & Strategic Partnerships
- iv. High-level View of Offerings
- v. Juniper Research's View: Key Strengths & Strategic Development Opportunities
- i. Corporate Information
- 2.1.16. Soprano Design
- i. Corporate Information
- ii. Geographical Spread
- Figure 2.21: Soprano Design's Global Reach and Support Network
- iii. Key Clients & Strategic Partnerships
- iv. High-level View of Offerings
- v. Juniper Research's View: Key Strengths & Strategic Development Opportunities
- 2.1.17. Sprinklr
- i. Corporate Information
- Table 2.22: Sprinklr's Select Financial Information ($m), FY 2022-FY 2024
- ii. Geographical Spread
- iii. Key Clients & Strategic Partnerships
- iv. High-level View of Offerings
- v. Juniper Research's View: Key Strengths & Strategic Development Opportunities
- i. Corporate Information
- 2.1.18. Tata Communications
- i. Corporate Information
- Table 2.23: Tata Communications' Select Financial Information (Indian Rupee in crore), FY 2022-23 & FY 2023-24
- ii. Geographical Spread
- iii. Key Clients & Strategic Partnerships
- iv. High-level View of Offerings
- v. Juniper Research's View: Key Strengths & Strategic Development Opportunities
- i. Corporate Information
- 2.1.19. Unifonic
- i. Corporate Information
- ii. Geographical Spread
- iii. Key Clients & Strategic Partnerships
- iv. High-level View of Offerings
- v. Juniper Research's View: Key Strengths & Strategic Development Opportunities
- 2.1.20. Vonage
- i. Corporate Information
- ii. Geographical Spread
- iii. Key Clients & Strategic Partnerships
- iv. High-level View of Offerings
- v. Juniper Research's View: Key Strengths & Strategic Development Opportunities
- 2.1.21. Yellow.ai
- i. Corporate Information
- ii. Geographical Spread
- iii. Key Clients & Strategic Partnerships
- iv. High-level View of Offerings
- v. Juniper Research's View: Key Strengths & Strategic Development Opportunities
- 2.1.22. Zendesk
- i. Corporate Information
- ii. Geographical Spread
- iii. Key Clients & Strategic Partnerships
- iv. High-level View of Offerings
- v. Juniper Research's View: Key Strengths & Strategic Development Opportunities
- i. Corporate Information
- 2.2. Juniper Research Leaderboard Assessment Methodology
- 2.3. Limitations & Interpretations
- Table 2.24: Juniper Research Competitor Leaderboard Scoring Criteria
- 2.4. Related Research
Data & Forecasting
1. Key Market Forecasts & Takeaways
- 1.1. Conversational AI Market Summary & Future Outlook
- Conversational AI Market Summary Forecast Methodology
- Figure 1.1: Conversational AI Market Summary Forecast Methodology
- Chatbot Users
- Figure & Table 1.2: Total Number of Chatbot Users (m), Split by 8 Key Regions, 2025-2029
- Conversational AI Market Summary Forecast Methodology
2. Conversational Commerce
- Conversational Commerce over Chatbots
- Web-based Chatbots Forecast Methodology
- App-based Chatbots Forecast Methodology
- RCS-based Chatbots Forecast Methodology
- OTT-based Chatbots Forecast Methodology
- Voice Bots Forecast Methodology
- Figure 2.1: Web-based Chatbots Forecast Methodology
- Figure 2.2: App-based Chatbots Forecast Methodology
- Figure 2.3: RCS-based Chatbots Forecast Methodology
- Figure 2.4: OTT-based Chatbots Forecast Methodology
- Figure 2.5: Voice Bots Forecast Methodology
- 2.1.1. Chatbots Accessed
- Figure & Table 2.6: Total Number of Chatbots Accessed (m), Split by Chatbot Technologies, 2025-2029
- 2.1.2. Spend over Conversational Commerce
- Figure & Table 2.7: Total Spend over Conversational Commerce Channels ($m), Split by Chatbot Technologies, 2025-2029
3. Conversational AI Service Spend
- 3.1. Conversational AI Service Spend
- 3.1.1. Conversational AI Service Spend Forecast Methodology
- Figure 3.1: Conversational AI Service Spend Forecast Methodology
- 3.1.2. Businesses Using Conversational AI
- Figure & Table 3.2: Total Number of Businesses Using Conversational AI Services (m), Split by 8 Key Regions, 2025-2029
- 3.1.3. Conversational AI Service Revenue
- Figure & Table 3.3: Total Conversational AI Services Revenue ($m), Split by 8 Key Regions, 2025-2029
- 3.1.1. Conversational AI Service Spend Forecast Methodology
