|
|
市場調査レポート
商品コード
1626686
フィットネスアプリの世界市場 2025-2029年Global Fitness App Market 2025-2029 |
||||||

|
|||||||
カスタマイズ可能
|
|||||||

| フィットネスアプリの世界市場 2025-2029年 |
|
出版日: 2024年12月19日
発行: TechNavio
ページ情報: 英文 203 Pages
納期: 即納可能
|

全表示
- 概要
- 図表
- 目次
フィットネスアプリの世界市場 2025-2029年
フィットネスアプリ市場は2024-2029年に1,016億米ドル、予測期間中のCAGRは24.2%で成長すると予測されます。当レポートでは、フィットネスアプリ市場の全体的な分析、市場規模・予測、動向、成長促進要因、課題、約25のベンダーを網羅したベンダー分析などを掲載しています。
現在の市場シナリオ、最新動向と促進要因、市場環境全体に関する最新分析を提供しています。慢性疾患の増加、ウェアラブルデバイスの採用拡大、ヨガやエアロビクス、総合格闘技(MMA)に対する顧客の関心の高まりなど、健康管理の強化が市場を牽引しています。
| 市場範囲 | |
|---|---|
| 基準年 | 2025 |
| 終了年 | 2029 |
| 予測期間 | 2025-2029 |
| 成長モメンタム | 加速 |
| 前年比2025年 | 19.2% |
| CAGR | 24.2% |
| 増分額 | 1,016億米ドル |
本調査では、ビデオワークアウト機能を統合した革新的なコーチングプラットフォームアプローチが、今後数年間のフィットネスアプリ市場成長を牽引する主要因の1つであると特定しています。また、ベンダー間のM&Aや提携の増加、フィットネスアプリへの投資の増加が、市場の大きな需要につながります。
目次
第1章 エグゼクティブサマリー
- 市場概要
第2章 Technavio別分析
- 価格・ライフサイクル・顧客購入バスケット・採用率・購入基準の分析
- インプットの重要性と差別化の要因
- 混乱の要因
- 促進要因と課題の影響
第3章 市場情勢
- 市場エコシステム
- 市場の特徴
- バリューチェーン分析
第4章 市場規模
- 市場の定義
- 市場セグメント分析
- 市場規模 2024
- 市場の見通し 2024-2029
第5章 市場規模実績
- フィットネスアプリの世界市場 2019-2023
- 性別セグメント分析 2019-2023
- 用途別セグメント分析 2019-2023
- 地域別セグメント分析 2019-2023
- 国別セグメント分析 2019-2023
第6章 定性分析
- AIの影響:フィットネスアプリの世界市場
第7章 ファイブフォース分析
- ファイブフォースの要約
- 買い手の交渉力
- 供給企業の交渉力
- 新規参入業者の脅威
- 代替品の脅威
- 競争の脅威
- 市況
第8章 市場セグメンテーション:性別
- 市場セグメント
- 比較:男女別
- 女性:市場規模と予測 2024-2029
- 男性:市場規模と予測 2024-2029
- 市場機会:男女別
第9章 市場セグメンテーション:用途別
- 市場セグメント
- 比較:用途別
- ライフスタイルモニタリング:市場規模と予測 2024-2029
- 健康モニタリング:市場規模と予測 2024-2029
- その他:市場規模と予測 2024-2029
- 市場機会:用途別
第10章 顧客情勢
- 顧客情勢の概要
第11章 地域別情勢
- 地域別セグメンテーション
- 比較:地域:
- 北米:市場規模と予測 2024-2029
- アジア太平洋:市場規模と予測 2024-2029
- 欧州:市場規模と予測 2024-2029
- 南米:市場規模と予測 2024-2029
- 中東・アフリカ:市場規模と予測 2024-2029
- 米国:市場規模と予測 2024-2029
- 中国:市場規模と予測 2024-2029
- 日本:市場規模と予測 2024-2029
- 韓国:市場規模と予測 2024-2029
- カナダ:市場規模と予測 2024-2029
- メキシコ:市場規模と予測 2024-2029
- ドイツ:市場規模と予測 2024-2029
- ブラジル:市場規模と予測 2024-2029
- 英国:市場規模と予測 2024-2029
- フランス:市場規模と予測 2024-2029
- 市場機会:地域情勢別
第12章 促進要因・課題・機会・抑制要因
- 市場促進要因
- 市場の課題
- 促進要因と課題の影響
- 市場の機会・抑制要因
第13章 競合情勢
- 概要
- 競合情勢
- 混乱の状況
- 業界のリスク
第14章 競合分析
- 企業プロファイル
- 企業ランキング指数
- 企業の市場ポジショニング
- Adidas AG
- Alphabet Inc.
- ASICS Corp.
- Azumio Inc.
- BetterMe Ltd.
- Diverse Retails Pvt. Ltd.
- Fiit Ltd.
- Fitness Connection
- Fooducate Ltd.
- Garmin Ltd.
- Jefit Inc.
- MINDBODY Inc.
- Nike Inc.
- Samsung Electronics Co. Ltd.
- Under Armour Inc.
第15章 付録
Exhibits:
- Exhibits1: Executive Summary - Chart on Market Overview
- Exhibits2: Executive Summary - Data Table on Market Overview
- Exhibits3: Executive Summary - Chart on Global Market Characteristics
- Exhibits4: Executive Summary - Chart on Market By Geographical Landscape
- Exhibits5: Executive Summary - Chart on Market Segmentation by Gender
- Exhibits6: Executive Summary - Chart on Market Segmentation by Application
- Exhibits7: Executive Summary - Chart on Incremental Growth
- Exhibits8: Executive Summary - Data Table on Incremental Growth
- Exhibits9: Executive Summary - Chart on Company Market Positioning
- Exhibits10: Analysis of price sensitivity, lifecycle, customer purchase basket, adoption rates, and purchase criteria
- Exhibits11: Overview on criticality of inputs and factors of differentiation
- Exhibits12: Overview on factors of disruption
- Exhibits13: Impact of drivers and challenges in 2024 and 2029
- Exhibits14: Parent Market
- Exhibits15: Data Table on - Parent Market
- Exhibits16: Market characteristics analysis
- Exhibits17: Value chain analysis
- Exhibits18: Offerings of companies included in the market definition
- Exhibits19: Market segments
- Exhibits20: Chart on Global - Market size and forecast 2024-2029 ($ billion)
- Exhibits21: Data Table on Global - Market size and forecast 2024-2029 ($ billion)
- Exhibits22: Chart on Global Market: Year-over-year growth 2024-2029 (%)
- Exhibits23: Data Table on Global Market: Year-over-year growth 2024-2029 (%)
- Exhibits24: Historic Market Size - Data Table on Global Fitness App Market 2019 - 2023 ($ billion)
- Exhibits25: Historic Market Size - Gender Segment 2019 - 2023 ($ billion)
- Exhibits26: Historic Market Size - Application Segment 2019 - 2023 ($ billion)
- Exhibits27: Historic Market Size - Geography Segment 2019 - 2023 ($ billion)
- Exhibits28: Historic Market Size - Country Segment 2019 - 2023 ($ billion)
- Exhibits29: Five forces analysis - Comparison between 2024 and 2029
- Exhibits30: Bargaining power of buyers - Impact of key factors 2024 and 2029
- Exhibits31: Bargaining power of suppliers - Impact of key factors in 2024 and 2029
- Exhibits32: Threat of new entrants - Impact of key factors in 2024 and 2029
- Exhibits33: Threat of substitutes - Impact of key factors in 2024 and 2029
- Exhibits34: Threat of rivalry - Impact of key factors in 2024 and 2029
- Exhibits35: Chart on Market condition - Five forces 2024 and 2029
- Exhibits36: Chart on Gender - Market share 2024-2029 (%)
- Exhibits37: Data Table on Gender - Market share 2024-2029 (%)
- Exhibits38: Chart on Comparison by Gender
- Exhibits39: Data Table on Comparison by Gender
- Exhibits40: Chart on Female - Market size and forecast 2024-2029 ($ billion)
- Exhibits41: Data Table on Female - Market size and forecast 2024-2029 ($ billion)
- Exhibits42: Chart on Female - Year-over-year growth 2024-2029 (%)
- Exhibits43: Data Table on Female - Year-over-year growth 2024-2029 (%)
- Exhibits44: Chart on Male - Market size and forecast 2024-2029 ($ billion)
- Exhibits45: Data Table on Male - Market size and forecast 2024-2029 ($ billion)
- Exhibits46: Chart on Male - Year-over-year growth 2024-2029 (%)
- Exhibits47: Data Table on Male - Year-over-year growth 2024-2029 (%)
- Exhibits48: Market opportunity by Gender ($ billion)
- Exhibits49: Data Table on Market opportunity by Gender ($ billion)
- Exhibits50: Chart on Application - Market share 2024-2029 (%)
- Exhibits51: Data Table on Application - Market share 2024-2029 (%)
- Exhibits52: Chart on Comparison by Application
- Exhibits53: Data Table on Comparison by Application
- Exhibits54: Chart on Lifestyle monitoring - Market size and forecast 2024-2029 ($ billion)
- Exhibits55: Data Table on Lifestyle monitoring - Market size and forecast 2024-2029 ($ billion)
- Exhibits56: Chart on Lifestyle monitoring - Year-over-year growth 2024-2029 (%)
- Exhibits57: Data Table on Lifestyle monitoring - Year-over-year growth 2024-2029 (%)
- Exhibits58: Chart on Health monitoring - Market size and forecast 2024-2029 ($ billion)
- Exhibits59: Data Table on Health monitoring - Market size and forecast 2024-2029 ($ billion)
- Exhibits60: Chart on Health monitoring - Year-over-year growth 2024-2029 (%)
- Exhibits61: Data Table on Health monitoring - Year-over-year growth 2024-2029 (%)
- Exhibits62: Chart on Others - Market size and forecast 2024-2029 ($ billion)
- Exhibits63: Data Table on Others - Market size and forecast 2024-2029 ($ billion)
- Exhibits64: Chart on Others - Year-over-year growth 2024-2029 (%)
- Exhibits65: Data Table on Others - Year-over-year growth 2024-2029 (%)
- Exhibits66: Market opportunity by Application ($ billion)
- Exhibits67: Data Table on Market opportunity by Application ($ billion)
- Exhibits68: Analysis of price sensitivity, lifecycle, customer purchase basket, adoption rates, and purchase criteria
- Exhibits69: Chart on Market share By Geographical Landscape 2024-2029 (%)
- Exhibits70: Data Table on Market share By Geographical Landscape 2024-2029 (%)
- Exhibits71: Chart on Geographic comparison
- Exhibits72: Data Table on Geographic comparison
- Exhibits73: Chart on North America - Market size and forecast 2024-2029 ($ billion)
- Exhibits74: Data Table on North America - Market size and forecast 2024-2029 ($ billion)
- Exhibits75: Chart on North America - Year-over-year growth 2024-2029 (%)
- Exhibits76: Data Table on North America - Year-over-year growth 2024-2029 (%)
- Exhibits77: Chart on APAC - Market size and forecast 2024-2029 ($ billion)
- Exhibits78: Data Table on APAC - Market size and forecast 2024-2029 ($ billion)
- Exhibits79: Chart on APAC - Year-over-year growth 2024-2029 (%)
- Exhibits80: Data Table on APAC - Year-over-year growth 2024-2029 (%)
- Exhibits81: Chart on Europe - Market size and forecast 2024-2029 ($ billion)
- Exhibits82: Data Table on Europe - Market size and forecast 2024-2029 ($ billion)
- Exhibits83: Chart on Europe - Year-over-year growth 2024-2029 (%)
- Exhibits84: Data Table on Europe - Year-over-year growth 2024-2029 (%)
- Exhibits85: Chart on South America - Market size and forecast 2024-2029 ($ billion)
- Exhibits86: Data Table on South America - Market size and forecast 2024-2029 ($ billion)
- Exhibits87: Chart on South America - Year-over-year growth 2024-2029 (%)
- Exhibits88: Data Table on South America - Year-over-year growth 2024-2029 (%)
- Exhibits89: Chart on Middle East and Africa - Market size and forecast 2024-2029 ($ billion)
- Exhibits90: Data Table on Middle East and Africa - Market size and forecast 2024-2029 ($ billion)
- Exhibits91: Chart on Middle East and Africa - Year-over-year growth 2024-2029 (%)
- Exhibits92: Data Table on Middle East and Africa - Year-over-year growth 2024-2029 (%)
- Exhibits93: Chart on US - Market size and forecast 2024-2029 ($ billion)
- Exhibits94: Data Table on US - Market size and forecast 2024-2029 ($ billion)
- Exhibits95: Chart on US - Year-over-year growth 2024-2029 (%)
- Exhibits96: Data Table on US - Year-over-year growth 2024-2029 (%)
- Exhibits97: Chart on China - Market size and forecast 2024-2029 ($ billion)
- Exhibits98: Data Table on China - Market size and forecast 2024-2029 ($ billion)
- Exhibits99: Chart on China - Year-over-year growth 2024-2029 (%)
- Exhibits100: Data Table on China - Year-over-year growth 2024-2029 (%)
- Exhibits101: Chart on Japan - Market size and forecast 2024-2029 ($ billion)
- Exhibits102: Data Table on Japan - Market size and forecast 2024-2029 ($ billion)
- Exhibits103: Chart on Japan - Year-over-year growth 2024-2029 (%)
- Exhibits104: Data Table on Japan - Year-over-year growth 2024-2029 (%)
- Exhibits105: Chart on South Korea - Market size and forecast 2024-2029 ($ billion)
- Exhibits106: Data Table on South Korea - Market size and forecast 2024-2029 ($ billion)
- Exhibits107: Chart on South Korea - Year-over-year growth 2024-2029 (%)
- Exhibits108: Data Table on South Korea - Year-over-year growth 2024-2029 (%)
- Exhibits109: Chart on Canada - Market size and forecast 2024-2029 ($ billion)
- Exhibits110: Data Table on Canada - Market size and forecast 2024-2029 ($ billion)
- Exhibits111: Chart on Canada - Year-over-year growth 2024-2029 (%)
- Exhibits112: Data Table on Canada - Year-over-year growth 2024-2029 (%)
- Exhibits113: Chart on Mexico - Market size and forecast 2024-2029 ($ billion)
- Exhibits114: Data Table on Mexico - Market size and forecast 2024-2029 ($ billion)
- Exhibits115: Chart on Mexico - Year-over-year growth 2024-2029 (%)
- Exhibits116: Data Table on Mexico - Year-over-year growth 2024-2029 (%)
- Exhibits117: Chart on Germany - Market size and forecast 2024-2029 ($ billion)
- Exhibits118: Data Table on Germany - Market size and forecast 2024-2029 ($ billion)
- Exhibits119: Chart on Germany - Year-over-year growth 2024-2029 (%)
- Exhibits120: Data Table on Germany - Year-over-year growth 2024-2029 (%)
- Exhibits121: Chart on Brazil - Market size and forecast 2024-2029 ($ billion)
- Exhibits122: Data Table on Brazil - Market size and forecast 2024-2029 ($ billion)
- Exhibits123: Chart on Brazil - Year-over-year growth 2024-2029 (%)
- Exhibits124: Data Table on Brazil - Year-over-year growth 2024-2029 (%)
- Exhibits125: Chart on UK - Market size and forecast 2024-2029 ($ billion)
- Exhibits126: Data Table on UK - Market size and forecast 2024-2029 ($ billion)
- Exhibits127: Chart on UK - Year-over-year growth 2024-2029 (%)
- Exhibits128: Data Table on UK - Year-over-year growth 2024-2029 (%)
- Exhibits129: Chart on France - Market size and forecast 2024-2029 ($ billion)
- Exhibits130: Data Table on France - Market size and forecast 2024-2029 ($ billion)
- Exhibits131: Chart on France - Year-over-year growth 2024-2029 (%)
- Exhibits132: Data Table on France - Year-over-year growth 2024-2029 (%)
- Exhibits133: Market opportunity By Geographical Landscape ($ billion)
- Exhibits134: Data Tables on Market opportunity By Geographical Landscape ($ billion)
- Exhibits135: Impact of drivers and challenges in 2024 and 2029
- Exhibits136: Overview on criticality of inputs and factors of differentiation
- Exhibits137: Overview on factors of disruption
- Exhibits138: Impact of key risks on business
- Exhibits139: Companies covered
- Exhibits140: Company ranking index
- Exhibits141: Matrix on companies position and classification
- Exhibits142: Adidas AG - Overview
- Exhibits143: Adidas AG - Business segments
- Exhibits144: Adidas AG - Key news
- Exhibits145: Adidas AG - Key offerings
- Exhibits146: Adidas AG - Segment focus
- Exhibits147: SWOT
- Exhibits148: Alphabet Inc. - Overview
- Exhibits149: Alphabet Inc. - Business segments
- Exhibits150: Alphabet Inc. - Key offerings
- Exhibits151: Alphabet Inc. - Segment focus
- Exhibits152: SWOT
- Exhibits153: ASICS Corp. - Overview
- Exhibits154: ASICS Corp. - Product / Service
- Exhibits155: ASICS Corp. - Key news
- Exhibits156: ASICS Corp. - Key offerings
- Exhibits157: SWOT
- Exhibits158: Azumio Inc. - Overview
- Exhibits159: Azumio Inc. - Product / Service
- Exhibits160: Azumio Inc. - Key offerings
- Exhibits161: SWOT
- Exhibits162: BetterMe Ltd. - Overview
- Exhibits163: BetterMe Ltd. - Product / Service
- Exhibits164: BetterMe Ltd. - Key offerings
- Exhibits165: SWOT
- Exhibits166: Diverse Retails Pvt. Ltd. - Overview
- Exhibits167: Diverse Retails Pvt. Ltd. - Product / Service
- Exhibits168: Diverse Retails Pvt. Ltd. - Key offerings
- Exhibits169: SWOT
- Exhibits170: Fiit Ltd. - Overview
- Exhibits171: Fiit Ltd. - Product / Service
- Exhibits172: Fiit Ltd. - Key offerings
- Exhibits173: SWOT
- Exhibits174: Fitness Connection - Overview
- Exhibits175: Fitness Connection - Product / Service
- Exhibits176: Fitness Connection - Key offerings
- Exhibits177: SWOT
- Exhibits178: Fooducate Ltd. - Overview
- Exhibits179: Fooducate Ltd. - Product / Service
- Exhibits180: Fooducate Ltd. - Key offerings
- Exhibits181: SWOT
- Exhibits182: Garmin Ltd. - Overview
- Exhibits183: Garmin Ltd. - Business segments
- Exhibits184: Garmin Ltd. - Key news
- Exhibits185: Garmin Ltd. - Key offerings
- Exhibits186: Garmin Ltd. - Segment focus
- Exhibits187: SWOT
- Exhibits188: Jefit Inc. - Overview
- Exhibits189: Jefit Inc. - Product / Service
- Exhibits190: Jefit Inc. - Key offerings
- Exhibits191: SWOT
- Exhibits192: MINDBODY Inc. - Overview
- Exhibits193: MINDBODY Inc. - Product / Service
- Exhibits194: MINDBODY Inc. - Key offerings
- Exhibits195: SWOT
- Exhibits196: Nike Inc. - Overview
- Exhibits197: Nike Inc. - Business segments
- Exhibits198: Nike Inc. - Key news
- Exhibits199: Nike Inc. - Key offerings
- Exhibits200: Nike Inc. - Segment focus
- Exhibits201: SWOT
- Exhibits202: Samsung Electronics Co. Ltd. - Overview
- Exhibits203: Samsung Electronics Co. Ltd. - Business segments
- Exhibits204: Samsung Electronics Co. Ltd. - Key news
- Exhibits205: Samsung Electronics Co. Ltd. - Key offerings
- Exhibits206: Samsung Electronics Co. Ltd. - Segment focus
- Exhibits207: SWOT
- Exhibits208: Under Armour Inc. - Overview
- Exhibits209: Under Armour Inc. - Business segments
- Exhibits210: Under Armour Inc. - Key news
- Exhibits211: Under Armour Inc. - Key offerings
- Exhibits212: Under Armour Inc. - Segment focus
- Exhibits213: SWOT
- Exhibits214: Inclusions checklist
- Exhibits215: Exclusions checklist
- Exhibits216: Currency conversion rates for US$
- Exhibits217: Research methodology
- Exhibits218: Information sources
- Exhibits219: Data validation
- Exhibits220: Validation techniques employed for market sizing
- Exhibits221: Data synthesis
- Exhibits222: 360 degree market analysis
- Exhibits223: List of abbreviations
Fitness App Market 2025-2029
The fitness app market is forecasted to grow by USD 101.60 bn during 2024-2029, accelerating at a CAGR of 24.2% during the forecast period. The report on the fitness app market provides a holistic analysis, market size and forecast, trends, growth drivers, and challenges, as well as vendor analysis covering around 25 vendors.
The report offers an up-to-date analysis regarding the current market scenario, the latest trends and drivers, and the overall market environment. The market is driven by empowering health management amid rising incidence of chronic diseases, growing adoption of wearable devices, and rising customer interest in yoga, aerobics, and mixed martial arts (MMA).
| Market Scope | |
|---|---|
| Base Year | 2025 |
| End Year | 2029 |
| Series Year | 2025-2029 |
| Growth Momentum | Accelerate |
| YOY 2025 | 19.2% |
| CAGR | 24.2% |
| Incremental Value | $101.60 bn |
Technavio's fitness app market is segmented as below:
By Gender
- Female
- Male
By Application
- Lifestyle monitoring
- Health monitoring
- Others
By Geographical Landscape
- North America
- APAC
- Europe
- South America
- Middle East and Africa
This study identifies the innovative coaching platform approach with integrated video workout features as one of the prime reasons driving the fitness app market growth during the next few years. Also, increasing number of mergers and acquisitions and collaborations among vendors and rising investments in fitness apps will lead to sizable demand in the market.
The report on the fitness app market covers the following areas:
- Fitness App Market sizing
- Fitness App Market forecast
- Fitness App Market industry analysis
The robust vendor analysis is designed to help clients improve their market position, and in line with this, this report provides a detailed analysis of several leading fitness app market vendors that include Adidas AG, Alphabet Inc., ASICS Corp., Azumio Inc., BetterMe Ltd., Diverse Retails Pvt. Ltd., Fiit Ltd., Fitness Connection, Fooducate Ltd., Garmin Ltd., Jefit Inc., MINDBODY Inc., Nike Inc., PEAR Sports LLC, Polar Electro Oy, Samsung Electronics Co. Ltd., Under Armour Inc., Wahoo Fitness LLC, WellDoc Inc., and YAZIO GmbH. Also, the fitness app market analysis report includes information on upcoming trends and challenges that will influence market growth. This is to help companies strategize and leverage all forthcoming growth opportunities.
The study was conducted using an objective combination of primary and secondary information including inputs from key participants in the industry. The report contains a comprehensive market and vendor landscape in addition to an analysis of the key vendors.
The publisher presents a detailed picture of the market by the way of study, synthesis, and summation of data from multiple sources by an analysis of key parameters such as profit, pricing, competition, and promotions. It presents various market facets by identifying the key industry influencers. The data presented is comprehensive, reliable, and a result of extensive primary and secondary research. The market research reports provide a complete competitive landscape and an in-depth vendor selection methodology and analysis using qualitative and quantitative research to forecast accurate market growth.
Table of Contents
1 Executive Summary
- 1.1 Market overview
- Executive Summary - Chart on Market Overview
- Executive Summary - Data Table on Market Overview
- Executive Summary - Chart on Global Market Characteristics
- Executive Summary - Chart on Market By Geographical Landscape
- Executive Summary - Chart on Market Segmentation by Gender
- Executive Summary - Chart on Market Segmentation by Application
- Executive Summary - Chart on Incremental Growth
- Executive Summary - Data Table on Incremental Growth
- Executive Summary - Chart on Company Market Positioning
2 Technavio Analysis
- 2.1 Analysis of price sensitivity, lifecycle, customer purchase basket, adoption rates, and purchase criteria
- Analysis of price sensitivity, lifecycle, customer purchase basket, adoption rates, and purchase criteria
- 2.2 Criticality of inputs and Factors of differentiation
- Overview on criticality of inputs and factors of differentiation
- 2.3 Factors of disruption
- Overview on factors of disruption
- 2.4 Impact of drivers and challenges
- Impact of drivers and challenges in 2024 and 2029
3 Market Landscape
- 3.1 Market ecosystem
- Parent Market
- Data Table on - Parent Market
- 3.2 Market characteristics
- Market characteristics analysis
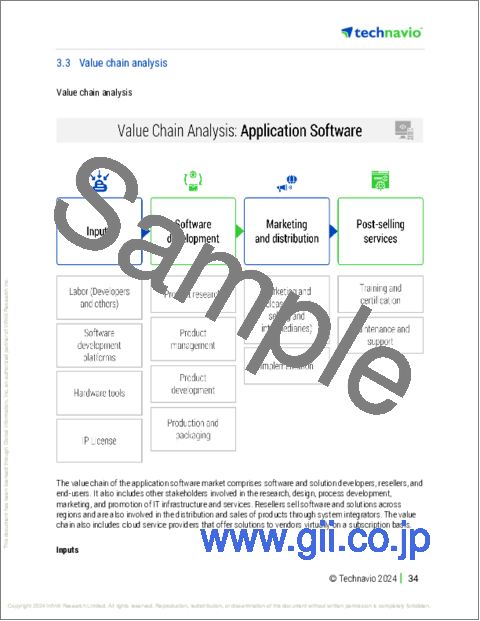
- 3.3 Value chain analysis
- Value chain analysis
4 Market Sizing
- 4.1 Market definition
- Offerings of companies included in the market definition
- 4.2 Market segment analysis
- Market segments
- 4.3 Market size 2024
- 4.4 Market outlook: Forecast for 2024-2029
- Chart on Global - Market size and forecast 2024-2029 ($ billion)
- Data Table on Global - Market size and forecast 2024-2029 ($ billion)
- Chart on Global Market: Year-over-year growth 2024-2029 (%)
- Data Table on Global Market: Year-over-year growth 2024-2029 (%)
5 Historic Market Size
- 5.1 Global Fitness App Market 2019 - 2023
- Historic Market Size - Data Table on Global Fitness App Market 2019 - 2023 ($ billion)
- 5.2 Gender segment analysis 2019 - 2023
- Historic Market Size - Gender Segment 2019 - 2023 ($ billion)
- 5.3 Application segment analysis 2019 - 2023
- Historic Market Size - Application Segment 2019 - 2023 ($ billion)
- 5.4 Geography segment analysis 2019 - 2023
- Historic Market Size - Geography Segment 2019 - 2023 ($ billion)
- 5.5 Country segment analysis 2019 - 2023
- Historic Market Size - Country Segment 2019 - 2023 ($ billion)
6 Qualitative Analysis
- 6.1 Impact of AI on the Global Fitness App Market
7 Five Forces Analysis
- 7.1 Five forces summary
- Five forces analysis - Comparison between 2024 and 2029
- 7.2 Bargaining power of buyers
- Bargaining power of buyers - Impact of key factors 2024 and 2029
- 7.3 Bargaining power of suppliers
- Bargaining power of suppliers - Impact of key factors in 2024 and 2029
- 7.4 Threat of new entrants
- Threat of new entrants - Impact of key factors in 2024 and 2029
- 7.5 Threat of substitutes
- Threat of substitutes - Impact of key factors in 2024 and 2029
- 7.6 Threat of rivalry
- Threat of rivalry - Impact of key factors in 2024 and 2029
- 7.7 Market condition
- Chart on Market condition - Five forces 2024 and 2029
8 Market Segmentation by Gender
- 8.1 Market segments
- Chart on Gender - Market share 2024-2029 (%)
- Data Table on Gender - Market share 2024-2029 (%)
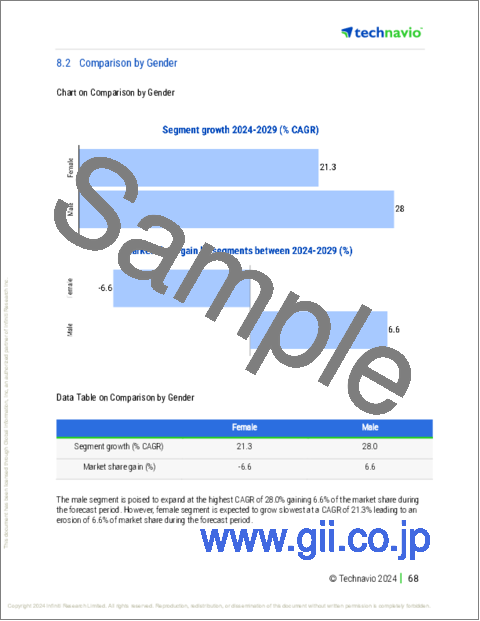
- 8.2 Comparison by Gender
- Chart on Comparison by Gender
- Data Table on Comparison by Gender
- 8.3 Female - Market size and forecast 2024-2029
- Chart on Female - Market size and forecast 2024-2029 ($ billion)
- Data Table on Female - Market size and forecast 2024-2029 ($ billion)
- Chart on Female - Year-over-year growth 2024-2029 (%)
- Data Table on Female - Year-over-year growth 2024-2029 (%)
- 8.4 Male - Market size and forecast 2024-2029
- Chart on Male - Market size and forecast 2024-2029 ($ billion)
- Data Table on Male - Market size and forecast 2024-2029 ($ billion)
- Chart on Male - Year-over-year growth 2024-2029 (%)
- Data Table on Male - Year-over-year growth 2024-2029 (%)
- 8.5 Market opportunity by Gender
- Market opportunity by Gender ($ billion)
- Data Table on Market opportunity by Gender ($ billion)
9 Market Segmentation by Application
- 9.1 Market segments
- Chart on Application - Market share 2024-2029 (%)
- Data Table on Application - Market share 2024-2029 (%)
- 9.2 Comparison by Application
- Chart on Comparison by Application
- Data Table on Comparison by Application
- 9.3 Lifestyle monitoring - Market size and forecast 2024-2029
- Chart on Lifestyle monitoring - Market size and forecast 2024-2029 ($ billion)
- Data Table on Lifestyle monitoring - Market size and forecast 2024-2029 ($ billion)
- Chart on Lifestyle monitoring - Year-over-year growth 2024-2029 (%)
- Data Table on Lifestyle monitoring - Year-over-year growth 2024-2029 (%)
- 9.4 Health monitoring - Market size and forecast 2024-2029
- Chart on Health monitoring - Market size and forecast 2024-2029 ($ billion)
- Data Table on Health monitoring - Market size and forecast 2024-2029 ($ billion)
- Chart on Health monitoring - Year-over-year growth 2024-2029 (%)
- Data Table on Health monitoring - Year-over-year growth 2024-2029 (%)
- 9.5 Others - Market size and forecast 2024-2029
- Chart on Others - Market size and forecast 2024-2029 ($ billion)
- Data Table on Others - Market size and forecast 2024-2029 ($ billion)
- Chart on Others - Year-over-year growth 2024-2029 (%)
- Data Table on Others - Year-over-year growth 2024-2029 (%)
- 9.6 Market opportunity by Application
- Market opportunity by Application ($ billion)
- Data Table on Market opportunity by Application ($ billion)
10 Customer Landscape
- 10.1 Customer landscape overview
- Analysis of price sensitivity, lifecycle, customer purchase basket, adoption rates, and purchase criteria
11 Geographic Landscape
- 11.1 Geographic segmentation
- Chart on Market share By Geographical Landscape 2024-2029 (%)
- Data Table on Market share By Geographical Landscape 2024-2029 (%)
- 11.2 Geographic comparison
- Chart on Geographic comparison
- Data Table on Geographic comparison
- 11.3 North America - Market size and forecast 2024-2029
- Chart on North America - Market size and forecast 2024-2029 ($ billion)
- Data Table on North America - Market size and forecast 2024-2029 ($ billion)
- Chart on North America - Year-over-year growth 2024-2029 (%)
- Data Table on North America - Year-over-year growth 2024-2029 (%)
- 11.4 APAC - Market size and forecast 2024-2029
- Chart on APAC - Market size and forecast 2024-2029 ($ billion)
- Data Table on APAC - Market size and forecast 2024-2029 ($ billion)
- Chart on APAC - Year-over-year growth 2024-2029 (%)
- Data Table on APAC - Year-over-year growth 2024-2029 (%)
- 11.5 Europe - Market size and forecast 2024-2029
- Chart on Europe - Market size and forecast 2024-2029 ($ billion)
- Data Table on Europe - Market size and forecast 2024-2029 ($ billion)
- Chart on Europe - Year-over-year growth 2024-2029 (%)
- Data Table on Europe - Year-over-year growth 2024-2029 (%)
- 11.6 South America - Market size and forecast 2024-2029
- Chart on South America - Market size and forecast 2024-2029 ($ billion)
- Data Table on South America - Market size and forecast 2024-2029 ($ billion)
- Chart on South America - Year-over-year growth 2024-2029 (%)
- Data Table on South America - Year-over-year growth 2024-2029 (%)
- 11.7 Middle East and Africa - Market size and forecast 2024-2029
- Chart on Middle East and Africa - Market size and forecast 2024-2029 ($ billion)
- Data Table on Middle East and Africa - Market size and forecast 2024-2029 ($ billion)
- Chart on Middle East and Africa - Year-over-year growth 2024-2029 (%)
- Data Table on Middle East and Africa - Year-over-year growth 2024-2029 (%)
- 11.8 US - Market size and forecast 2024-2029
- Chart on US - Market size and forecast 2024-2029 ($ billion)
- Data Table on US - Market size and forecast 2024-2029 ($ billion)
- Chart on US - Year-over-year growth 2024-2029 (%)
- Data Table on US - Year-over-year growth 2024-2029 (%)
- 11.9 China - Market size and forecast 2024-2029
- Chart on China - Market size and forecast 2024-2029 ($ billion)
- Data Table on China - Market size and forecast 2024-2029 ($ billion)
- Chart on China - Year-over-year growth 2024-2029 (%)
- Data Table on China - Year-over-year growth 2024-2029 (%)
- 11.10 Japan - Market size and forecast 2024-2029
- Chart on Japan - Market size and forecast 2024-2029 ($ billion)
- Data Table on Japan - Market size and forecast 2024-2029 ($ billion)
- Chart on Japan - Year-over-year growth 2024-2029 (%)
- Data Table on Japan - Year-over-year growth 2024-2029 (%)
- 11.11 South Korea - Market size and forecast 2024-2029
- Chart on South Korea - Market size and forecast 2024-2029 ($ billion)
- Data Table on South Korea - Market size and forecast 2024-2029 ($ billion)
- Chart on South Korea - Year-over-year growth 2024-2029 (%)
- Data Table on South Korea - Year-over-year growth 2024-2029 (%)
- 11.12 Canada - Market size and forecast 2024-2029
- Chart on Canada - Market size and forecast 2024-2029 ($ billion)
- Data Table on Canada - Market size and forecast 2024-2029 ($ billion)
- Chart on Canada - Year-over-year growth 2024-2029 (%)
- Data Table on Canada - Year-over-year growth 2024-2029 (%)
- 11.13 Mexico - Market size and forecast 2024-2029
- Chart on Mexico - Market size and forecast 2024-2029 ($ billion)
- Data Table on Mexico - Market size and forecast 2024-2029 ($ billion)
- Chart on Mexico - Year-over-year growth 2024-2029 (%)
- Data Table on Mexico - Year-over-year growth 2024-2029 (%)
- 11.14 Germany - Market size and forecast 2024-2029
- Chart on Germany - Market size and forecast 2024-2029 ($ billion)
- Data Table on Germany - Market size and forecast 2024-2029 ($ billion)
- Chart on Germany - Year-over-year growth 2024-2029 (%)
- Data Table on Germany - Year-over-year growth 2024-2029 (%)
- 11.15 Brazil - Market size and forecast 2024-2029
- Chart on Brazil - Market size and forecast 2024-2029 ($ billion)
- Data Table on Brazil - Market size and forecast 2024-2029 ($ billion)
- Chart on Brazil - Year-over-year growth 2024-2029 (%)
- Data Table on Brazil - Year-over-year growth 2024-2029 (%)
- 11.16 UK - Market size and forecast 2024-2029
- Chart on UK - Market size and forecast 2024-2029 ($ billion)
- Data Table on UK - Market size and forecast 2024-2029 ($ billion)
- Chart on UK - Year-over-year growth 2024-2029 (%)
- Data Table on UK - Year-over-year growth 2024-2029 (%)
- 11.17 France - Market size and forecast 2024-2029
- Chart on France - Market size and forecast 2024-2029 ($ billion)
- Data Table on France - Market size and forecast 2024-2029 ($ billion)
- Chart on France - Year-over-year growth 2024-2029 (%)
- Data Table on France - Year-over-year growth 2024-2029 (%)
- 11.18 Market opportunity By Geographical Landscape
- Market opportunity By Geographical Landscape ($ billion)
- Data Tables on Market opportunity By Geographical Landscape ($ billion)
12 Drivers, Challenges, and Opportunity/Restraints
- 12.1 Market drivers
- 12.2 Market challenges
- 12.3 Impact of drivers and challenges
- Impact of drivers and challenges in 2024 and 2029
- 12.4 Market opportunities/restraints
13 Competitive Landscape
- 13.1 Overview
- 13.2 Competitive Landscape
- Overview on criticality of inputs and factors of differentiation
- 13.3 Landscape disruption
- Overview on factors of disruption
- 13.4 Industry risks
- Impact of key risks on business
14 Competitive Analysis
- 14.1 Companies profiled
- Companies covered
- 14.2 Company ranking index
- Company ranking index
- 14.3 Market positioning of companies
- Matrix on companies position and classification
- 14.4 Adidas AG
- Adidas AG - Overview
- Adidas AG - Business segments
- Adidas AG - Key news
- Adidas AG - Key offerings
- Adidas AG - Segment focus
- SWOT
- 14.5 Alphabet Inc.
- Alphabet Inc. - Overview
- Alphabet Inc. - Business segments
- Alphabet Inc. - Key offerings
- Alphabet Inc. - Segment focus
- SWOT
- 14.6 ASICS Corp.
- ASICS Corp. - Overview
- ASICS Corp. - Product / Service
- ASICS Corp. - Key news
- ASICS Corp. - Key offerings
- SWOT
- 14.7 Azumio Inc.
- Azumio Inc. - Overview
- Azumio Inc. - Product / Service
- Azumio Inc. - Key offerings
- SWOT
- 14.8 BetterMe Ltd.
- BetterMe Ltd. - Overview
- BetterMe Ltd. - Product / Service
- BetterMe Ltd. - Key offerings
- SWOT
- 14.9 Diverse Retails Pvt. Ltd.
- Diverse Retails Pvt. Ltd. - Overview
- Diverse Retails Pvt. Ltd. - Product / Service
- Diverse Retails Pvt. Ltd. - Key offerings
- SWOT
- 14.10 Fiit Ltd.
- Fiit Ltd. - Overview
- Fiit Ltd. - Product / Service
- Fiit Ltd. - Key offerings
- SWOT
- 14.11 Fitness Connection
- Fitness Connection - Overview
- Fitness Connection - Product / Service
- Fitness Connection - Key offerings
- SWOT
- 14.12 Fooducate Ltd.
- Fooducate Ltd. - Overview
- Fooducate Ltd. - Product / Service
- Fooducate Ltd. - Key offerings
- SWOT
- 14.13 Garmin Ltd.
- Garmin Ltd. - Overview
- Garmin Ltd. - Business segments
- Garmin Ltd. - Key news
- Garmin Ltd. - Key offerings
- Garmin Ltd. - Segment focus
- SWOT
- 14.14 Jefit Inc.
- Jefit Inc. - Overview
- Jefit Inc. - Product / Service
- Jefit Inc. - Key offerings
- SWOT
- 14.15 MINDBODY Inc.
- MINDBODY Inc. - Overview
- MINDBODY Inc. - Product / Service
- MINDBODY Inc. - Key offerings
- SWOT
- 14.16 Nike Inc.
- Nike Inc. - Overview
- Nike Inc. - Business segments
- Nike Inc. - Key news
- Nike Inc. - Key offerings
- Nike Inc. - Segment focus
- SWOT
- 14.17 Samsung Electronics Co. Ltd.
- Samsung Electronics Co. Ltd. - Overview
- Samsung Electronics Co. Ltd. - Business segments
- Samsung Electronics Co. Ltd. - Key news
- Samsung Electronics Co. Ltd. - Key offerings
- Samsung Electronics Co. Ltd. - Segment focus
- SWOT
- 14.18 Under Armour Inc.
- Under Armour Inc. - Overview
- Under Armour Inc. - Business segments
- Under Armour Inc. - Key news
- Under Armour Inc. - Key offerings
- Under Armour Inc. - Segment focus
- SWOT
15 Appendix
- 15.1 Scope of the report
- 15.2 Inclusions and exclusions checklist
- Inclusions checklist
- Exclusions checklist
- 15.3 Currency conversion rates for US$
- Currency conversion rates for US$
- 15.4 Research methodology
- Research methodology
- 15.5 Data procurement
- Information sources
- 15.6 Data validation
- Data validation
- 15.7 Validation techniques employed for market sizing
- Validation techniques employed for market sizing
- 15.8 Data synthesis
- Data synthesis
- 15.9 360 degree market analysis
- 360 degree market analysis
- 15.10 List of abbreviations
- List of abbreviations

