|
|
市場調査レポート
商品コード
1557636
カフェとバーの世界市場 2024-2028Global Cafes and Bars Market 2024-2028 |
||||||

|
|||||||
カスタマイズ可能
|
|||||||


| カフェとバーの世界市場 2024-2028 |
|
出版日: 2024年08月05日
発行: TechNavio
ページ情報: 英文 170 Pages
納期: 即納可能
|

全表示
- 概要
- 図表
- 目次
カフェとバー市場は2023-2028年に688億米ドル、予測期間中のCAGRは4.36%で成長すると予測されます。
当レポートでは、カフェとバー市場の全体的な分析、市場規模・予測、動向、成長促進要因、課題、約25のベンダーを網羅したベンダー分析などを掲載しています。
現在の市場シナリオ、最新動向と促進要因、市場環境全体に関する最新分析を提供しています。市場は、カフェの増加、都市化の進展と消費者のライフスタイルの変化、間食や嗜好品消費の増加によって牽引されています。
| 市場範囲 | |
|---|---|
| 基準年 | 2024 |
| 終了年 | 2028 |
| 予測期間 | 2024-2028 |
| 成長モメンタム | 加速 |
| 前年比2024年 | 4.12% |
| CAGR | 4.36% |
| 増分額 | 688億米ドル |
本調査では、今後数年間のカフェとバー市場の成長を促進する主な理由の一つとして、食品メニューの革新とカスタマイズに対する需要を挙げています。また、グルテンフリー食品に対する需要の増加や、ミレニアル世代におけるコーヒーやクラフトビールの人気の高まりも、市場の大きな需要につながると思われます。
目次
第1章 エグゼクティブサマリー
- 市場概要
第2章 市場情勢
- 市場エコシステム
- 市場の特徴
- バリューチェーン分析
第3章 市場規模の評価
- 市場の定義
- 市場セグメント分析
- 市場規模 2023
- 市場の見通し 2023-2028
第4章 市場規模実績
- カフェとバーの世界市場 2018-2022
- 製品別セグメント分析 2018-2022
- タイプ別セグメント分析 2018-2022
- 地域別セグメント分析 2018-2022
- 国別セグメント分析 2018-2022
第5章 ファイブフォース分析
- ファイブフォースの要約
- 買い手の交渉力
- 供給企業の交渉力
- 新規参入業者の脅威
- 代替品の脅威
- 競争の脅威
- 市況
第6章 市場セグメンテーション:製品別
- 市場セグメンテーション
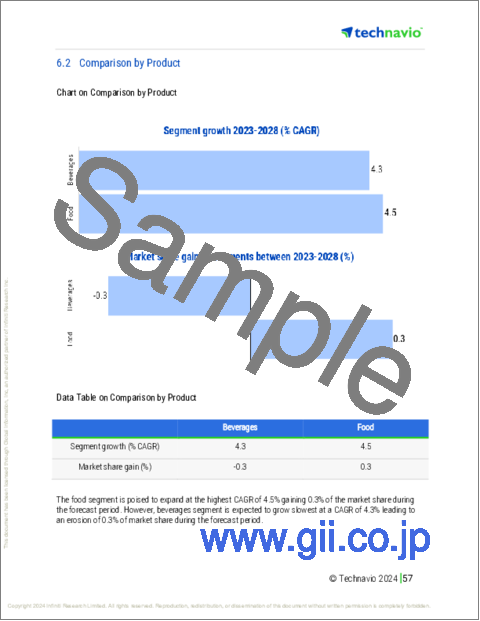
- 比較:製品別
- 飲料:市場規模と予測 2023-2028
- 食品:市場規模と予測 2023-2028
- 市場機会:製品別
第7章 市場セグメンテーション:タイプ別
- 市場セグメンテーション
- 比較:タイプ別
- バーとパブ:市場規模と予測 2023-2028
- カフェ:市場規模と予測 2023-2028
- スペシャルティコーヒーショップ:市場規模と予測 2023-2028
- 市場機会:タイプ別
第8章 顧客情勢
- 顧客情勢の概要
第9章 地域別情勢
- 地域別セグメンテーション
- 地域別比較
- 欧州:市場規模と予測 2023-2028
- アジア太平洋:市場規模と予測 2023-2028
- 北米:市場規模と予測 2023-2028
- 中東・アフリカ:市場規模と予測 2023-2028
- 南米:市場規模と予測 2023-2028
- 米国:市場規模と予測 2023-2028
- 中国:市場規模と予測 2023-2028
- 日本:市場規模と予測 2023-2028
- 英国:市場規模と予測 2023-2028
- フランス:市場規模と予測 2023-2028
- 市場機会:地域情勢別
第10章 促進要因・課題・機会・抑制要因
- 市場促進要因
- 市場の課題
- 促進要因と課題の影響
- 市場の機会・抑制要因
第11章 競合情勢
- 概要
- 競合情勢
- 混乱の状況
- 業界のリスク
第12章 競合分析
- 企業プロファイル
- 企業の市場ポジショニング
- Caffe Nero Group Ltd
- Caribou Coffee Operating Co. Inc.
- Coffee Day Enterprises Ltd.
- Doutor Coffee Co. Ltd.
- Ediya Co. Ltd.
- Inspire Brands Inc.
- JAB Holding Co.
- Jollibee Foods Corp.
- LUIGI LAVAZZA SpA
- McDonald Corp.
- Restaurant Brands International Inc.
- Starbucks Corp.
- Stonegate Pub Co. Ltd.
- The Coca Cola Co.
- Whitbread PLC
第13章 付録
Exhibits:
- Exhibits1: Executive Summary - Chart on Market Overview
- Exhibits2: Executive Summary - Data Table on Market Overview
- Exhibits3: Executive Summary - Chart on Global Market Characteristics
- Exhibits4: Executive Summary - Chart on Market By Geographical Landscape
- Exhibits5: Executive Summary - Chart on Market Segmentation by Product
- Exhibits6: Executive Summary - Chart on Market Segmentation by Type
- Exhibits7: Executive Summary - Chart on Incremental Growth
- Exhibits8: Executive Summary - Data Table on Incremental Growth
- Exhibits9: Executive Summary - Chart on Company Market Positioning
- Exhibits10: Parent Market
- Exhibits11: Data Table on - Parent Market
- Exhibits12: Market characteristics analysis
- Exhibits13: Value Chain Analysis
- Exhibits14: Offerings of companies included in the market definition
- Exhibits15: Market segments
- Exhibits16: Chart on Global - Market size and forecast 2023-2028 ($ billion)
- Exhibits17: Data Table on Global - Market size and forecast 2023-2028 ($ billion)
- Exhibits18: Chart on Global Market: Year-over-year growth 2023-2028 (%)
- Exhibits19: Data Table on Global Market: Year-over-year growth 2023-2028 (%)
- Exhibits20: Historic Market Size - Data Table on Global Cafes And Bars Market 2018 - 2022 ($ billion)
- Exhibits21: Historic Market Size - Product Segment 2018 - 2022 ($ billion)
- Exhibits22: Historic Market Size - Type Segment 2018 - 2022 ($ billion)
- Exhibits23: Historic Market Size - Geography Segment 2018 - 2022 ($ billion)
- Exhibits24: Historic Market Size - Country Segment 2018 - 2022 ($ billion)
- Exhibits25: Five forces analysis - Comparison between 2023 and 2028
- Exhibits26: Bargaining power of buyers - Impact of key factors 2023 and 2028
- Exhibits27: Bargaining power of suppliers - Impact of key factors in 2023 and 2028
- Exhibits28: Threat of new entrants - Impact of key factors in 2023 and 2028
- Exhibits29: Threat of substitutes - Impact of key factors in 2023 and 2028
- Exhibits30: Threat of rivalry - Impact of key factors in 2023 and 2028
- Exhibits31: Chart on Market condition - Five forces 2023 and 2028
- Exhibits32: Chart on Product - Market share 2023-2028 (%)
- Exhibits33: Data Table on Product - Market share 2023-2028 (%)
- Exhibits34: Chart on Comparison by Product
- Exhibits35: Data Table on Comparison by Product
- Exhibits36: Chart on Beverages - Market size and forecast 2023-2028 ($ billion)
- Exhibits37: Data Table on Beverages - Market size and forecast 2023-2028 ($ billion)
- Exhibits38: Chart on Beverages - Year-over-year growth 2023-2028 (%)
- Exhibits39: Data Table on Beverages - Year-over-year growth 2023-2028 (%)
- Exhibits40: Chart on Food - Market size and forecast 2023-2028 ($ billion)
- Exhibits41: Data Table on Food - Market size and forecast 2023-2028 ($ billion)
- Exhibits42: Chart on Food - Year-over-year growth 2023-2028 (%)
- Exhibits43: Data Table on Food - Year-over-year growth 2023-2028 (%)
- Exhibits44: Market opportunity by Product ($ billion)
- Exhibits45: Data Table on Market opportunity by Product ($ billion)
- Exhibits46: Chart on Type - Market share 2023-2028 (%)
- Exhibits47: Data Table on Type - Market share 2023-2028 (%)
- Exhibits48: Chart on Comparison by Type
- Exhibits49: Data Table on Comparison by Type
- Exhibits50: Chart on Bars and pubs - Market size and forecast 2023-2028 ($ billion)
- Exhibits51: Data Table on Bars and pubs - Market size and forecast 2023-2028 ($ billion)
- Exhibits52: Chart on Bars and pubs - Year-over-year growth 2023-2028 (%)
- Exhibits53: Data Table on Bars and pubs - Year-over-year growth 2023-2028 (%)
- Exhibits54: Chart on Cafes - Market size and forecast 2023-2028 ($ billion)
- Exhibits55: Data Table on Cafes - Market size and forecast 2023-2028 ($ billion)
- Exhibits56: Chart on Cafes - Year-over-year growth 2023-2028 (%)
- Exhibits57: Data Table on Cafes - Year-over-year growth 2023-2028 (%)
- Exhibits58: Chart on Specialty coffee shops - Market size and forecast 2023-2028 ($ billion)
- Exhibits59: Data Table on Specialty coffee shops - Market size and forecast 2023-2028 ($ billion)
- Exhibits60: Chart on Specialty coffee shops - Year-over-year growth 2023-2028 (%)
- Exhibits61: Data Table on Specialty coffee shops - Year-over-year growth 2023-2028 (%)
- Exhibits62: Market opportunity by Type ($ billion)
- Exhibits63: Data Table on Market opportunity by Type ($ billion)
- Exhibits64: Analysis of price sensitivity, lifecycle, customer purchase basket, adoption rates, and purchase criteria
- Exhibits65: Chart on Market share By Geographical Landscape 2023-2028 (%)
- Exhibits66: Data Table on Market share By Geographical Landscape 2023-2028 (%)
- Exhibits67: Chart on Geographic comparison
- Exhibits68: Data Table on Geographic comparison
- Exhibits69: Chart on Europe - Market size and forecast 2023-2028 ($ billion)
- Exhibits70: Data Table on Europe - Market size and forecast 2023-2028 ($ billion)
- Exhibits71: Chart on Europe - Year-over-year growth 2023-2028 (%)
- Exhibits72: Data Table on Europe - Year-over-year growth 2023-2028 (%)
- Exhibits73: Chart on APAC - Market size and forecast 2023-2028 ($ billion)
- Exhibits74: Data Table on APAC - Market size and forecast 2023-2028 ($ billion)
- Exhibits75: Chart on APAC - Year-over-year growth 2023-2028 (%)
- Exhibits76: Data Table on APAC - Year-over-year growth 2023-2028 (%)
- Exhibits77: Chart on North America - Market size and forecast 2023-2028 ($ billion)
- Exhibits78: Data Table on North America - Market size and forecast 2023-2028 ($ billion)
- Exhibits79: Chart on North America - Year-over-year growth 2023-2028 (%)
- Exhibits80: Data Table on North America - Year-over-year growth 2023-2028 (%)
- Exhibits81: Chart on Middle East and Africa - Market size and forecast 2023-2028 ($ billion)
- Exhibits82: Data Table on Middle East and Africa - Market size and forecast 2023-2028 ($ billion)
- Exhibits83: Chart on Middle East and Africa - Year-over-year growth 2023-2028 (%)
- Exhibits84: Data Table on Middle East and Africa - Year-over-year growth 2023-2028 (%)
- Exhibits85: Chart on South America - Market size and forecast 2023-2028 ($ billion)
- Exhibits86: Data Table on South America - Market size and forecast 2023-2028 ($ billion)
- Exhibits87: Chart on South America - Year-over-year growth 2023-2028 (%)
- Exhibits88: Data Table on South America - Year-over-year growth 2023-2028 (%)
- Exhibits89: Chart on US - Market size and forecast 2023-2028 ($ billion)
- Exhibits90: Data Table on US - Market size and forecast 2023-2028 ($ billion)
- Exhibits91: Chart on US - Year-over-year growth 2023-2028 (%)
- Exhibits92: Data Table on US - Year-over-year growth 2023-2028 (%)
- Exhibits93: Chart on China - Market size and forecast 2023-2028 ($ billion)
- Exhibits94: Data Table on China - Market size and forecast 2023-2028 ($ billion)
- Exhibits95: Chart on China - Year-over-year growth 2023-2028 (%)
- Exhibits96: Data Table on China - Year-over-year growth 2023-2028 (%)
- Exhibits97: Chart on Japan - Market size and forecast 2023-2028 ($ billion)
- Exhibits98: Data Table on Japan - Market size and forecast 2023-2028 ($ billion)
- Exhibits99: Chart on Japan - Year-over-year growth 2023-2028 (%)
- Exhibits100: Data Table on Japan - Year-over-year growth 2023-2028 (%)
- Exhibits101: Chart on UK - Market size and forecast 2023-2028 ($ billion)
- Exhibits102: Data Table on UK - Market size and forecast 2023-2028 ($ billion)
- Exhibits103: Chart on UK - Year-over-year growth 2023-2028 (%)
- Exhibits104: Data Table on UK - Year-over-year growth 2023-2028 (%)
- Exhibits105: Chart on France - Market size and forecast 2023-2028 ($ billion)
- Exhibits106: Data Table on France - Market size and forecast 2023-2028 ($ billion)
- Exhibits107: Chart on France - Year-over-year growth 2023-2028 (%)
- Exhibits108: Data Table on France - Year-over-year growth 2023-2028 (%)
- Exhibits109: Market opportunity By Geographical Landscape ($ billion)
- Exhibits110: Data Tables on Market opportunity By Geographical Landscape ($ billion)
- Exhibits111: Impact of drivers and challenges in 2023 and 2028
- Exhibits112: Overview on criticality of inputs and factors of differentiation
- Exhibits113: Overview on factors of disruption
- Exhibits114: Impact of key risks on business
- Exhibits115: Companies covered
- Exhibits116: Matrix on companies position and classification
- Exhibits117: Caffe Nero Group Ltd - Overview
- Exhibits118: Caffe Nero Group Ltd - Product / Service
- Exhibits119: Caffe Nero Group Ltd - Key offerings
- Exhibits120: Caribou Coffee Operating Co. Inc. - Overview
- Exhibits121: Caribou Coffee Operating Co. Inc. - Product / Service
- Exhibits122: Caribou Coffee Operating Co. Inc. - Key offerings
- Exhibits123: Coffee Day Enterprises Ltd. - Overview
- Exhibits124: Coffee Day Enterprises Ltd. - Business segments
- Exhibits125: Coffee Day Enterprises Ltd. - Key offerings
- Exhibits126: Coffee Day Enterprises Ltd. - Segment focus
- Exhibits127: Doutor Coffee Co. Ltd. - Overview
- Exhibits128: Doutor Coffee Co. Ltd. - Product / Service
- Exhibits129: Doutor Coffee Co. Ltd. - Key offerings
- Exhibits130: Ediya Co. Ltd. - Overview
- Exhibits131: Ediya Co. Ltd. - Product / Service
- Exhibits132: Ediya Co. Ltd. - Key offerings
- Exhibits133: Inspire Brands Inc. - Overview
- Exhibits134: Inspire Brands Inc. - Product / Service
- Exhibits135: Inspire Brands Inc. - Key offerings
- Exhibits136: JAB Holding Co. - Overview
- Exhibits137: JAB Holding Co. - Product / Service
- Exhibits138: JAB Holding Co. - Key offerings
- Exhibits139: Jollibee Foods Corp. - Overview
- Exhibits140: Jollibee Foods Corp. - Business segments
- Exhibits141: Jollibee Foods Corp. - Key offerings
- Exhibits142: Jollibee Foods Corp. - Segment focus
- Exhibits143: LUIGI LAVAZZA SpA - Overview
- Exhibits144: LUIGI LAVAZZA SpA - Product / Service
- Exhibits145: LUIGI LAVAZZA SpA - Key offerings
- Exhibits146: McDonald Corp. - Overview
- Exhibits147: McDonald Corp. - Business segments
- Exhibits148: McDonald Corp. - Key news
- Exhibits149: McDonald Corp. - Key offerings
- Exhibits150: McDonald Corp. - Segment focus
- Exhibits151: Restaurant Brands International Inc. - Overview
- Exhibits152: Restaurant Brands International Inc. - Business segments
- Exhibits153: Restaurant Brands International Inc. - Key news
- Exhibits154: Restaurant Brands International Inc. - Key offerings
- Exhibits155: Restaurant Brands International Inc. - Segment focus
- Exhibits156: Starbucks Corp. - Overview
- Exhibits157: Starbucks Corp. - Business segments
- Exhibits158: Starbucks Corp. - Key news
- Exhibits159: Starbucks Corp. - Key offerings
- Exhibits160: Starbucks Corp. - Segment focus
- Exhibits161: Stonegate Pub Co. Ltd. - Overview
- Exhibits162: Stonegate Pub Co. Ltd. - Business segments
- Exhibits163: Stonegate Pub Co. Ltd. - Key offerings
- Exhibits164: Stonegate Pub Co. Ltd. - Segment focus
- Exhibits165: The Coca Cola Co. - Overview
- Exhibits166: The Coca Cola Co. - Business segments
- Exhibits167: The Coca Cola Co. - Key news
- Exhibits168: The Coca Cola Co. - Key offerings
- Exhibits169: The Coca Cola Co. - Segment focus
- Exhibits170: Whitbread PLC - Overview
- Exhibits171: Whitbread PLC - Business segments
- Exhibits172: Whitbread PLC - Key offerings
- Exhibits173: Whitbread PLC - Segment focus
- Exhibits174: Inclusions checklist
- Exhibits175: Exclusions checklist
- Exhibits176: Currency conversion rates for US$
- Exhibits177: Research methodology
- Exhibits178: Information sources
- Exhibits179: Data validation
- Exhibits180: Validation techniques employed for market sizing
- Exhibits181: Data synthesis
- Exhibits182: 360 degree market analysis
- Exhibits183: List of abbreviations
The cafes and bars market is forecasted to grow by USD 68.8 bn during 2023-2028, accelerating at a CAGR of 4.36% during the forecast period. The report on the cafes and bars market provides a holistic analysis, market size and forecast, trends, growth drivers, and challenges, as well as vendor analysis covering around 25 vendors.
The report offers an up-to-date analysis regarding the current market scenario, the latest trends and drivers, and the overall market environment. The market is driven by increasing number of cafes, rising urbanization and changing consumer lifestyles, and increased snacking and indulgence consumption.
Technavio's cafes and bars market is segmented as below:
| Market Scope | |
|---|---|
| Base Year | 2024 |
| End Year | 2028 |
| Series Year | 2024-2028 |
| Growth Momentum | Accelerate |
| YOY 2024 | 4.12% |
| CAGR | 4.36% |
| Incremental Value | $68.8bn |
By Product
- Beverages
- Food
By Type
- Bars and pubs
- Cafes
- Specialty coffee shops
By Geographical Landscape
- Europe
- APAC
- North America
- Middle East and Africa
- South America
This study identifies the demand for innovation and customization in food menus as one of the prime reasons driving the cafes and bars market growth during the next few years. Also, increase in demand for gluten-free food and rising popularity of coffee and craft beer among millennials will lead to sizable demand in the market.
The report on the cafes and bars market covers the following areas:
- Cafes and bars market sizing
- Cafes and bars market forecast
- Cafes and bars market industry analysis
The robust vendor analysis is designed to help clients improve their market position, and in line with this, this report provides a detailed analysis of several leading cafes and bars market vendors that include Berkshire Hathaway Inc., BJs Restaurants Inc., Brinker International Inc., Caffe Nero Group Ltd, Caribou Coffee Operating Co. Inc., Coffee Day Enterprises Ltd., Doutor Coffee Co. Ltd., Ediya Co. Ltd., Inspire Brands Inc., JAB Holding Co., Jollibee Foods Corp., LUIGI LAVAZZA SpA, McDonald Corp., Red Robin Gourmet Burgers Inc., Restaurant Brands International Inc., Starbucks Corp., Stonegate Pub Co. Ltd., The Coca Cola Co., Whitbread PLC, and YUM Brands Inc.. Also, the cafes and bars market analysis report includes information on upcoming trends and challenges that will influence market growth. This is to help companies strategize and leverage all forthcoming growth opportunities.
The study was conducted using an objective combination of primary and secondary information including inputs from key participants in the industry. The report contains a comprehensive market and vendor landscape in addition to an analysis of the key vendors.
The publisher presents a detailed picture of the market by the way of study, synthesis, and summation of data from multiple sources by an analysis of key parameters such as profit, pricing, competition, and promotions. It presents various market facets by identifying the key industry influencers. The data presented is comprehensive, reliable, and a result of extensive research - both primary and secondary. The market research reports provide a complete competitive landscape and an in-depth vendor selection methodology and analysis using qualitative and quantitative research to forecast the accurate market growth.
Table of Contents
1 Executive Summary
- 1.1 Market overview
- Executive Summary - Chart on Market Overview
- Executive Summary - Data Table on Market Overview
- Executive Summary - Chart on Global Market Characteristics
- Executive Summary - Chart on Market By Geographical Landscape
- Executive Summary - Chart on Market Segmentation by Product
- Executive Summary - Chart on Market Segmentation by Type
- Executive Summary - Chart on Incremental Growth
- Executive Summary - Data Table on Incremental Growth
- Executive Summary - Chart on Company Market Positioning
2 Market Landscape
- 2.1 Market ecosystem
- Parent Market
- Data Table on - Parent Market
- 2.2 Market characteristics
- Market characteristics analysis
- 2.3 Value chain analysis
- Value Chain Analysis
3 Market Sizing
- 3.1 Market definition
- Offerings of companies included in the market definition
- 3.2 Market segment analysis
- Market segments
- 3.3 Market size 2023
- 3.4 Market outlook: Forecast for 2023-2028
- Chart on Global - Market size and forecast 2023-2028 ($ billion)
- Data Table on Global - Market size and forecast 2023-2028 ($ billion)
- Chart on Global Market: Year-over-year growth 2023-2028 (%)
- Data Table on Global Market: Year-over-year growth 2023-2028 (%)
4 Historic Market Size
- 4.1 Global Cafes And Bars Market 2018 - 2022
- Historic Market Size - Data Table on Global Cafes And Bars Market 2018 - 2022 ($ billion)
- 4.2 Product segment analysis 2018 - 2022
- Historic Market Size - Product Segment 2018 - 2022 ($ billion)
- 4.3 Type segment analysis 2018 - 2022
- Historic Market Size - Type Segment 2018 - 2022 ($ billion)
- 4.4 Geography segment analysis 2018 - 2022
- Historic Market Size - Geography Segment 2018 - 2022 ($ billion)
- 4.5 Country segment analysis 2018 - 2022
- Historic Market Size - Country Segment 2018 - 2022 ($ billion)
5 Five Forces Analysis
- 5.1 Five forces summary
- Five forces analysis - Comparison between 2023 and 2028
- 5.2 Bargaining power of buyers
- Bargaining power of buyers - Impact of key factors 2023 and 2028
- 5.3 Bargaining power of suppliers
- Bargaining power of suppliers - Impact of key factors in 2023 and 2028
- 5.4 Threat of new entrants
- Threat of new entrants - Impact of key factors in 2023 and 2028
- 5.5 Threat of substitutes
- Threat of substitutes - Impact of key factors in 2023 and 2028
- 5.6 Threat of rivalry
- Threat of rivalry - Impact of key factors in 2023 and 2028
- 5.7 Market condition
- Chart on Market condition - Five forces 2023 and 2028
6 Market Segmentation by Product
- 6.1 Market segments
- Chart on Product - Market share 2023-2028 (%)
- Data Table on Product - Market share 2023-2028 (%)
- 6.2 Comparison by Product
- Chart on Comparison by Product
- Data Table on Comparison by Product
- 6.3 Beverages - Market size and forecast 2023-2028
- Chart on Beverages - Market size and forecast 2023-2028 ($ billion)
- Data Table on Beverages - Market size and forecast 2023-2028 ($ billion)
- Chart on Beverages - Year-over-year growth 2023-2028 (%)
- Data Table on Beverages - Year-over-year growth 2023-2028 (%)
- 6.4 Food - Market size and forecast 2023-2028
- Chart on Food - Market size and forecast 2023-2028 ($ billion)
- Data Table on Food - Market size and forecast 2023-2028 ($ billion)
- Chart on Food - Year-over-year growth 2023-2028 (%)
- Data Table on Food - Year-over-year growth 2023-2028 (%)
- 6.5 Market opportunity by Product
- Market opportunity by Product ($ billion)
- Data Table on Market opportunity by Product ($ billion)
7 Market Segmentation by Type
- 7.1 Market segments
- Chart on Type - Market share 2023-2028 (%)
- Data Table on Type - Market share 2023-2028 (%)
- 7.2 Comparison by Type
- Chart on Comparison by Type
- Data Table on Comparison by Type
- 7.3 Bars and pubs - Market size and forecast 2023-2028
- Chart on Bars and pubs - Market size and forecast 2023-2028 ($ billion)
- Data Table on Bars and pubs - Market size and forecast 2023-2028 ($ billion)
- Chart on Bars and pubs - Year-over-year growth 2023-2028 (%)
- Data Table on Bars and pubs - Year-over-year growth 2023-2028 (%)
- 7.4 Cafes - Market size and forecast 2023-2028
- Chart on Cafes - Market size and forecast 2023-2028 ($ billion)
- Data Table on Cafes - Market size and forecast 2023-2028 ($ billion)
- Chart on Cafes - Year-over-year growth 2023-2028 (%)
- Data Table on Cafes - Year-over-year growth 2023-2028 (%)
- 7.5 Specialty coffee shops - Market size and forecast 2023-2028
- Chart on Specialty coffee shops - Market size and forecast 2023-2028 ($ billion)
- Data Table on Specialty coffee shops - Market size and forecast 2023-2028 ($ billion)
- Chart on Specialty coffee shops - Year-over-year growth 2023-2028 (%)
- Data Table on Specialty coffee shops - Year-over-year growth 2023-2028 (%)
- 7.6 Market opportunity by Type
- Market opportunity by Type ($ billion)
- Data Table on Market opportunity by Type ($ billion)
8 Customer Landscape
- 8.1 Customer landscape overview
- Analysis of price sensitivity, lifecycle, customer purchase basket, adoption rates, and purchase criteria
9 Geographic Landscape
- 9.1 Geographic segmentation
- Chart on Market share By Geographical Landscape 2023-2028 (%)
- Data Table on Market share By Geographical Landscape 2023-2028 (%)
- 9.2 Geographic comparison
- Chart on Geographic comparison
- Data Table on Geographic comparison
- 9.3 Europe - Market size and forecast 2023-2028
- Chart on Europe - Market size and forecast 2023-2028 ($ billion)
- Data Table on Europe - Market size and forecast 2023-2028 ($ billion)
- Chart on Europe - Year-over-year growth 2023-2028 (%)
- Data Table on Europe - Year-over-year growth 2023-2028 (%)
- 9.4 APAC - Market size and forecast 2023-2028
- Chart on APAC - Market size and forecast 2023-2028 ($ billion)
- Data Table on APAC - Market size and forecast 2023-2028 ($ billion)
- Chart on APAC - Year-over-year growth 2023-2028 (%)
- Data Table on APAC - Year-over-year growth 2023-2028 (%)
- 9.5 North America - Market size and forecast 2023-2028
- Chart on North America - Market size and forecast 2023-2028 ($ billion)
- Data Table on North America - Market size and forecast 2023-2028 ($ billion)
- Chart on North America - Year-over-year growth 2023-2028 (%)
- Data Table on North America - Year-over-year growth 2023-2028 (%)
- 9.6 Middle East and Africa - Market size and forecast 2023-2028
- Chart on Middle East and Africa - Market size and forecast 2023-2028 ($ billion)
- Data Table on Middle East and Africa - Market size and forecast 2023-2028 ($ billion)
- Chart on Middle East and Africa - Year-over-year growth 2023-2028 (%)
- Data Table on Middle East and Africa - Year-over-year growth 2023-2028 (%)
- 9.7 South America - Market size and forecast 2023-2028
- Chart on South America - Market size and forecast 2023-2028 ($ billion)
- Data Table on South America - Market size and forecast 2023-2028 ($ billion)
- Chart on South America - Year-over-year growth 2023-2028 (%)
- Data Table on South America - Year-over-year growth 2023-2028 (%)
- 9.8 US - Market size and forecast 2023-2028
- Chart on US - Market size and forecast 2023-2028 ($ billion)
- Data Table on US - Market size and forecast 2023-2028 ($ billion)
- Chart on US - Year-over-year growth 2023-2028 (%)
- Data Table on US - Year-over-year growth 2023-2028 (%)
- 9.9 China - Market size and forecast 2023-2028
- Chart on China - Market size and forecast 2023-2028 ($ billion)
- Data Table on China - Market size and forecast 2023-2028 ($ billion)
- Chart on China - Year-over-year growth 2023-2028 (%)
- Data Table on China - Year-over-year growth 2023-2028 (%)
- 9.10 Japan - Market size and forecast 2023-2028
- Chart on Japan - Market size and forecast 2023-2028 ($ billion)
- Data Table on Japan - Market size and forecast 2023-2028 ($ billion)
- Chart on Japan - Year-over-year growth 2023-2028 (%)
- Data Table on Japan - Year-over-year growth 2023-2028 (%)
- 9.11 UK - Market size and forecast 2023-2028
- Chart on UK - Market size and forecast 2023-2028 ($ billion)
- Data Table on UK - Market size and forecast 2023-2028 ($ billion)
- Chart on UK - Year-over-year growth 2023-2028 (%)
- Data Table on UK - Year-over-year growth 2023-2028 (%)
- 9.12 France - Market size and forecast 2023-2028
- Chart on France - Market size and forecast 2023-2028 ($ billion)
- Data Table on France - Market size and forecast 2023-2028 ($ billion)
- Chart on France - Year-over-year growth 2023-2028 (%)
- Data Table on France - Year-over-year growth 2023-2028 (%)
- 9.13 Market opportunity By Geographical Landscape
- Market opportunity By Geographical Landscape ($ billion)
- Data Tables on Market opportunity By Geographical Landscape ($ billion)
10 Drivers, Challenges, and Opportunity/Restraints
- 10.1 Market drivers
- 10.2 Market challenges
- 10.3 Impact of drivers and challenges
- Impact of drivers and challenges in 2023 and 2028
- 10.4 Market opportunities/restraints
11 Competitive Landscape
- 11.1 Overview
- 11.2 Competitive Landscape
- Overview on criticality of inputs and factors of differentiation
- 11.3 Landscape disruption
- Overview on factors of disruption
- 11.4 Industry risks
- Impact of key risks on business
12 Competitive Analysis
- 12.1 Companies profiled
- Companies covered
- 12.2 Market positioning of companies
- Matrix on companies position and classification
- 12.3 Caffe Nero Group Ltd
- Caffe Nero Group Ltd - Overview
- Caffe Nero Group Ltd - Product / Service
- Caffe Nero Group Ltd - Key offerings
- 12.4 Caribou Coffee Operating Co. Inc.
- Caribou Coffee Operating Co. Inc. - Overview
- Caribou Coffee Operating Co. Inc. - Product / Service
- Caribou Coffee Operating Co. Inc. - Key offerings
- 12.5 Coffee Day Enterprises Ltd.
- Coffee Day Enterprises Ltd. - Overview
- Coffee Day Enterprises Ltd. - Business segments
- Coffee Day Enterprises Ltd. - Key offerings
- Coffee Day Enterprises Ltd. - Segment focus
- 12.6 Doutor Coffee Co. Ltd.
- Doutor Coffee Co. Ltd. - Overview
- Doutor Coffee Co. Ltd. - Product / Service
- Doutor Coffee Co. Ltd. - Key offerings
- 12.7 Ediya Co. Ltd.
- Ediya Co. Ltd. - Overview
- Ediya Co. Ltd. - Product / Service
- Ediya Co. Ltd. - Key offerings
- 12.8 Inspire Brands Inc.
- Inspire Brands Inc. - Overview
- Inspire Brands Inc. - Product / Service
- Inspire Brands Inc. - Key offerings
- 12.9 JAB Holding Co.
- JAB Holding Co. - Overview
- JAB Holding Co. - Product / Service
- JAB Holding Co. - Key offerings
- 12.10 Jollibee Foods Corp.
- Jollibee Foods Corp. - Overview
- Jollibee Foods Corp. - Business segments
- Jollibee Foods Corp. - Key offerings
- Jollibee Foods Corp. - Segment focus
- 12.11 LUIGI LAVAZZA SpA
- LUIGI LAVAZZA SpA - Overview
- LUIGI LAVAZZA SpA - Product / Service
- LUIGI LAVAZZA SpA - Key offerings
- 12.12 McDonald Corp.
- McDonald Corp. - Overview
- McDonald Corp. - Business segments
- McDonald Corp. - Key news
- McDonald Corp. - Key offerings
- McDonald Corp. - Segment focus
- 12.13 Restaurant Brands International Inc.
- Restaurant Brands International Inc. - Overview
- Restaurant Brands International Inc. - Business segments
- Restaurant Brands International Inc. - Key news
- Restaurant Brands International Inc. - Key offerings
- Restaurant Brands International Inc. - Segment focus
- 12.14 Starbucks Corp.
- Starbucks Corp. - Overview
- Starbucks Corp. - Business segments
- Starbucks Corp. - Key news
- Starbucks Corp. - Key offerings
- Starbucks Corp. - Segment focus
- 12.15 Stonegate Pub Co. Ltd.
- Stonegate Pub Co. Ltd. - Overview
- Stonegate Pub Co. Ltd. - Business segments
- Stonegate Pub Co. Ltd. - Key offerings
- Stonegate Pub Co. Ltd. - Segment focus
- 12.16 The Coca Cola Co.
- The Coca Cola Co. - Overview
- The Coca Cola Co. - Business segments
- The Coca Cola Co. - Key news
- The Coca Cola Co. - Key offerings
- The Coca Cola Co. - Segment focus
- 12.17 Whitbread PLC
- Whitbread PLC - Overview
- Whitbread PLC - Business segments
- Whitbread PLC - Key offerings
- Whitbread PLC - Segment focus
13 Appendix
- 13.1 Scope of the report
- 13.2 Inclusions and exclusions checklist
- Inclusions checklist
- Exclusions checklist
- 13.3 Currency conversion rates for US$
- Currency conversion rates for US$
- 13.4 Research methodology
- Research methodology
- 13.5 Data procurement
- Information sources
- 13.6 Data validation
- Data validation
- 13.7 Validation techniques employed for market sizing
- Validation techniques employed for market sizing
- 13.8 Data synthesis
- Data synthesis
- 13.9 360 degree market analysis
- 360 degree market analysis
- 13.10 List of abbreviations
- List of abbreviations

