
米国のカフェ&バー:市場シェア分析、産業動向、統計、成長予測(2025~2030年)
United States Cafes & Bars - Market Share Analysis, Industry Trends & Statistics, Growth Forecasts (2025 - 2030)- 発行日
- ページ情報
- 英文 145 Pages
- 納期
- 2~3営業日
- 商品コード
- 1693905
- カスタマイズ可能 お客様のご希望に応じて、既存データの加工や未掲載情報(例:国別セグメント)の追加などの対応が可能です。詳細はお問い合わせください。
- 適宜更新あり 本レポートは最新情報反映のため適宜更新し、内容構成変更を行う場合があります。ご検討の際はお問い合わせください。
- 翻訳ツール提供対象 PDF対応AI翻訳ツールの無料貸し出しサービスのご利用が可能です
概要
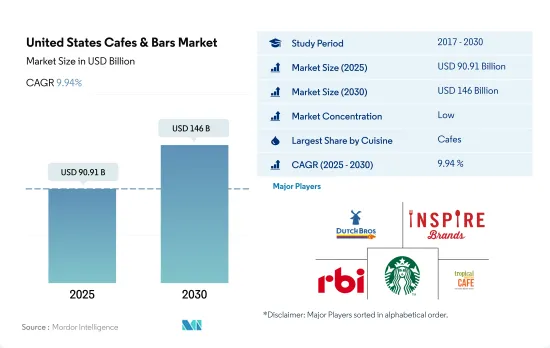
米国のカフェ&バー市場規模は2025年に909億1,000万米ドルと推定され、2030年には1,460億米ドルに達すると予測され、予測期間中(2025~2030年)のCAGRは9.94%で成長すると予測されます。
コーヒーチェーンの急拡大とグルメコーヒー人気の高まりが市場を押し上げる
- フードサービス市場のカフェ&バーセグメントは、全国的にコーヒーショップの普及が進んでいることから、サブセグメントのカフェが牽引しています。米国のコーヒーショップ数は2017~2022年にかけて7.84%増加しました。スターバックス(Starbucks Corp)、ダンキン・ブレッド(Dunkin')、パネラ・ブレッド(Panera Bread)などの同国最大のコーヒー事業者は、2022年時点でそれぞれ1万5,650店舗、9,262店舗、2,173店舗と米国市場での存在感を高めています。
- 多忙なライフスタイルや長時間労働が増える中、米国のコーヒーチェーンは、外出先でのコーヒーを好む顧客に人気が高まっています。米国では、都市住民の間でコーヒーを飲む文化の人気が大きく伸びています。2022年には、毎日コーヒーを飲む人の50%近くが、クイックサービスレストラン、カフェ、ドーナツショップ、ドライブスルーでのコーヒーを好むようになります。
- バー&パブはこのカテゴリーで2番目に大きなセグメントであるが、これは若年層やミレニアル世代がバーで社交する傾向にあるためです。加えて、消費者はエキゾチックな味や飲食品に積極的に出費を惜しまず、さまざまなスタイルの飲食品とともに高級カクテルやアルコール飲料を選ぶようになっています。2022年には、アメリカ人の3人に1人近くが、アクティビティ、食事、飲み物が一度に楽しめるバーやクラブを好むようになりました。そのため、大手バーはサービスやキャパシティを拡大しています。
- ジュースバーやコーヒー・紅茶専門店は、このセグメントではわずかなシェアにとどまっているが、主に国内でのスペシャルティ・コーヒーチェーンの成長によるグルメ・コーヒーの需要増加により、アメリカ人の間で存在感を増しています。2020年には、約210万人の米国人がグルメコーヒーを飲んでいます。
米国のカフェ&バー市場動向
米国におけるコーヒー文化の高まりがカフェ&バーの成長を促進、チェーン店が牽引
- 米国のカフェ&バーの店舗数は、2020~2022年にかけて7,000店舗増加。米国では都市住民の間でコーヒーを飲む文化があり、その人気は大きく伸びています。スターバックス、ダンキン・ドーナツ、パネラ・ブレッド、ピーツ・コーヒーなど、同国で人気のコーヒーチェーンが市場での存在感を高めています。2023年1月現在、米国の52の州と地域で最も店舗数が多いのはスターバックスで15,842店舗、ダンキンドーナツは9,368店舗、パネラブレッドは2,160店舗です。
- カフェ&バー部門は、QSR、FSRに次いで2022年の市場シェア第3位を占めます。スペシャルティコーヒーとクラフトビールの人気が高まっており、予測期間中の店舗数は前年比平均0.15%の成長率を記録すると予測されます。2021年、米国には7万2,148軒のカフェと6万8,338軒のバーがありました。カフェ&バーで提供される人気の飲み物は、カプチーノ、ラテ、アメリカーノ、ホットチョコレート、クラフトビール、ワイン、ウイスキー、オレンジジュース、カクテルです。
- COVID-19の流行は米国のカフェ&バー部門に大きな影響を与え、約5,856店舗が政府の規制により閉鎖され、売上減少につながりました。しかし、多くのカフェ&バーがテイクアウトやデリバリー注文にシフトし、非接触型デリバリーを導入したことで、徐々に売上を伸ばしています。
価格上昇と需要増がカフェ&バーの収益を押し上げる
- コーヒーの消費量と価格は、レビュー期間中に着実に上昇しました。米国人のコーヒーに対する嗜好は過去10年間で高まっています。2015年以降、米国のコーヒー消費量は5~10%増加しています。アメリカ人の約60%が毎日コーヒーを飲んでいます。アメリカ人女性は年間平均2,325米ドル、アメリカ人男性は年間約1,920米ドルをコーヒーに費やしています。また、カフェは従来のコーヒーや紅茶よりも高価なメニューやスペシャルティドリンクを増やしています。プレミアムコーヒーや職人的な淹れ方にこだわるサードウェーブコーヒーショップの人気が高まっていることも、スペシャルティコーヒーの成長に寄与しています。
- そのため、カフェやバーの平均注文額は2017~2022年にかけて16.33%増加しました。上昇インフレ率は2017~2022年にかけて平均3~4%増加し、年間注文数は2020~2022年にかけて41.11%増加しました。米国人に好まれる人気のコーヒーや飲料には、カプチーノ(1杯4.5米ドル)、ラテ(1杯5米ドル)、アメリカーノ(1杯3.8米ドル)、ホットチョコレート(1杯4.75米ドル)、オレンジジュース(グラス6.5米ドル)、クラフトビール(16オンス11米ドル)、ワイン(グラス10米ドル)、カクテル(1.5オンスグラス15米ドル)、ウイスキー(ペグ14米ドル)などがあります。
- 米国では、2022年のアルコール売上は2020年比で22.4%増加し、そのうちバー、パブ、ナイトクラブ経由の売上が50%を超えました。同国の消費者は地元の味を好み、プレミアムクラフト・ビールに高いお金を払うことを厭わないです。このため、バー・パブ部門は予測期間中も好調を維持するとみられます。
米国のカフェ&バー産業概要
米国のカフェ&バー市場は細分化されており、上位5社で37.86%を占めています。この市場の主要企業は、Dutch Bros, Inc.、Inspire Brands, Inc.、Restaurant Brands International Inc.、Starbucks Corporation、Tropical Smoothie Cafe, LLCです。
その他の特典
- エクセル形式の市場予測(ME)シート
- 3ヶ月のアナリストサポート
目次
第1章 エグゼクティブサマリーと主要調査結果
第2章 レポートのオファー
第3章 イントロダクション
- 調査の前提条件と市場定義
- 調査範囲
- 調査手法
第4章 主要産業動向
- アウトレット数
- 平均注文額
- 規制の枠組み
- 米国
- メニュー分析
第5章 市場セグメンテーション
- 料理
- バー&パブ
- カフェ
- ジュース/スムージー/デザートバー
- コーヒー・紅茶専門店
- アウトレット
- チェーン店
- 独立系アウトレット
- 場所
- レジャー
- 宿泊施設
- 小売
- 独立型
- 旅行
第6章 競合情勢
- 主要な戦略動向
- 市場シェア分析
- 企業情勢
- 企業プロファイル
- Dutch Bros, Inc.
- Focus Brands LLC
- Inspire Brands, Inc.
- International Dairy Queen, Inc.
- Jab Holding Company S.A.R.L.
- McDonald's Corporation
- Restaurant Brands International Inc.
- Smoothie King Franchises Inc.
- Starbucks Corporation
- Tropical Smoothie Cafe, LLC
第7章 CEOへの主要戦略的質問
第8章 付録
- 世界概要
- 概要
- ファイブフォース分析フレームワーク
- 世界のバリューチェーン分析
- 市場力学(DROs)
- 情報源と参考文献
- 図表一覧
- 主要な洞察
- データパック
- 用語集
目次
The United States Cafes & Bars Market size is estimated at 90.91 billion USD in 2025, and is expected to reach 146 billion USD by 2030, growing at a CAGR of 9.94% during the forecast period (2025-2030).
Rapid expansion of coffee chains and the increased popularity of gourmet coffee is boosting the market
- The cafes & bars segment of the foodservice market is led by the sub-segment cafes owing to the increasing penetration of coffee shops across the country. The number of coffee shops in the United States increased by 7.84% from 2017 to 2022. The country's largest coffee operators, including Starbucks Corp, Dunkin', and Panera Bread, increased their presence in the US market with 15,650, 9,262, and 2,173 stores, respectively, as of 2022.
- With increasingly busy lifestyles and long working hours, US coffee chains have become more popular with customers who prefer coffee on the go. The United States has witnessed significant growth in the popularity of coffee-drinking culture among urban residents. Almost 50% of daily coffee drinkers in the country preferred coffee at a quick service restaurant, cafe, donut shop, or through a drive-through in 2022.
- Bars & pubs is the second-largest segment under this category, owing to the trend of socializing at bars among the younger population and millennials. In addition, consumers are willing to spend on exotic flavors and beverages and are opting for fancy cocktails and alcoholic drinks, along with a wide range of food styles. In 2022, nearly one in three Americans preferred a bar or club that has an activity, food, and drink in one place. Thus, major bars are expanding their services and capacities.
- Juice bars and specialist coffee & tea shops held a minimal share in the segment but are gaining prominence among Americans owing to the increased demand for gourmet coffee, primarily due to the growth of specialty coffee chains in the country. Around 2.1 million Americans drank gourmet coffee in 2020.
United States Cafes & Bars Market Trends
Growing coffee culture in the United States fuels cafes & bars' growth, driven by chained outlets
- The number of cafes & bars in the United States increased by 7,000 from 2020 to 2022, owing to the increased coffee consumption in the country. The coffee-drinking culture among urban residents in the United States has been witnessing significant growth in popularity. Popular coffee chains in the country, such as Starbucks, Dunkin' Donuts, Panera Bread, and Peet's Coffee, are expanding their presence in the market. As of January 2023, Starbucks had the most number of locations (15,842) across 52 states and territories in the United States, while Dunkin' Donuts had 9,368 locations, and Panera Bread had 2,160 locations.
- The cafes & bars segment accounted for the third-largest share of the market in 2022, after QSRs and FSRs. The number of outlets is projected to record an average Y-o-Y growth rate of 0.15% during the forecast period, with the increasing popularity of specialty coffee and craft beer. In 2021, the United States had 72,148 cafes and 68,338 bars. The popular drinks served at cafes & bars are cappuccino, latte, Americano, hot chocolate, craft beer, wine, whiskey, orange juice, and cocktails.
- The COVID-19 pandemic significantly impacted the cafes & bars segment in the United States, as around 5,856 establishments were closed due to government regulations, thus leading to declined sales. However, many cafes & bars have shifted to take-out and delivery orders and have implemented contactless delivery, gradually boosting their sales.
Rising prices and increased demand boost revenues at cafes and bars
- The consumption and price of coffee steadily rose over the review period. Americans' preference for coffee has grown over the last decade. Since 2015, coffee consumption in the United States has increased by 5-10%. Around 60% of Americans drink coffee daily. American women spent an average of USD 2,325 per year on coffee, and American men spent around USD 1,920 per year. Also, cafes are expanding their menus or specialty drinks that are more expensive than traditional coffee or tea. The increasing popularity of third-wave coffee shops, which focus on premium coffee and artisanal brewing techniques, has contributed to the growth of specialty coffee.
- Thus, the average order value for cafes and bars increased by 16.33% from 2017 to 2022. The rising inflation rate increased by an average of 3-4% from 2017 to 2022, and the number of orders per year increased by 41.11% from 2020 to 2022. Popular coffee and drinks preferred by Americans include Cappuccino (USD 4.5 per cup), Latte (USD 5 per cup), Americano (USD 3.8 per cup), Hot Chocolate (4.75 per cup), Orange Juice (USD 6.5 per glass), Craft Beer (USD 11 per 16 oz), Wine (USD 10 per glass), Cocktails (USD 15 per glass of 1.5 oz), and Whiskey (USD 14 per peg).
- In the United States, alcohol sales increased by 22.4% in 2022 compared to 2020, of which more than 50% of sales were generated through bars, pubs, and nightclubs. Consumers in the country prefer local tastes and are willing to pay more for premium-crafted beers. Thus, the bars & pubs segment is likely to remain strong during the forecast period.
United States Cafes & Bars Industry Overview
The United States Cafes & Bars Market is fragmented, with the top five companies occupying 37.86%. The major players in this market are Dutch Bros, Inc., Inspire Brands, Inc., Restaurant Brands International Inc., Starbucks Corporation and Tropical Smoothie Cafe, LLC (sorted alphabetically).
Additional Benefits:
- The market estimate (ME) sheet in Excel format
- 3 months of analyst support
TABLE OF CONTENTS
1 EXECUTIVE SUMMARY & KEY FINDINGS
2 REPORT OFFERS
3 INTRODUCTION
- 3.1 Study Assumptions & Market Definition
- 3.2 Scope of the Study
- 3.3 Research Methodology
4 KEY INDUSTRY TRENDS
- 4.1 Number Of Outlets
- 4.2 Average Order Value
- 4.3 Regulatory Framework
- 4.3.1 United States
- 4.4 Menu Analysis
5 MARKET SEGMENTATION (includes market size in Value in USD, Forecasts up to 2030 and analysis of growth prospects)
- 5.1 Cuisine
- 5.1.1 Bars & Pubs
- 5.1.2 Cafes
- 5.1.3 Juice/Smoothie/Desserts Bars
- 5.1.4 Specialist Coffee & Tea Shops
- 5.2 Outlet
- 5.2.1 Chained Outlets
- 5.2.2 Independent Outlets
- 5.3 Location
- 5.3.1 Leisure
- 5.3.2 Lodging
- 5.3.3 Retail
- 5.3.4 Standalone
- 5.3.5 Travel
6 COMPETITIVE LANDSCAPE
- 6.1 Key Strategic Moves
- 6.2 Market Share Analysis
- 6.3 Company Landscape
- 6.4 Company Profiles (includes Global Level Overview, Market Level Overview, Core Business Segments, Financials, Headcount, Key Information, Market Rank, Market Share, Products and Services, and Analysis of Recent Developments).
- 6.4.1 Dutch Bros, Inc.
- 6.4.2 Focus Brands LLC
- 6.4.3 Inspire Brands, Inc.
- 6.4.4 International Dairy Queen, Inc.
- 6.4.5 Jab Holding Company S.A.R.L.
- 6.4.6 McDonald's Corporation
- 6.4.7 Restaurant Brands International Inc.
- 6.4.8 Smoothie King Franchises Inc.
- 6.4.9 Starbucks Corporation
- 6.4.10 Tropical Smoothie Cafe, LLC
7 KEY STRATEGIC QUESTIONS FOR FOODSERVICE CEOS
8 APPENDIX
- 8.1 Global Overview
- 8.1.1 Overview
- 8.1.2 Porter's Five Forces Framework
- 8.1.3 Global Value Chain Analysis
- 8.1.4 Market Dynamics (DROs)
- 8.2 Sources & References
- 8.3 List of Tables & Figures
- 8.4 Primary Insights
- 8.5 Data Pack
- 8.6 Glossary of Terms
- 発行日
- 発行
- Mordor Intelligence
- ページ情報
- 英文 145 Pages
- 納期
- 2~3営業日


