
北米のカフェ・バー:市場シェア分析、産業動向、統計、成長予測(2025~2030年)
North America Cafes & Bars - Market Share Analysis, Industry Trends & Statistics, Growth Forecasts (2025 - 2030)- 発行日
- ページ情報
- 英文 169 Pages
- 納期
- 2~3営業日
- 商品コード
- 1693860
- カスタマイズ可能 お客様のご希望に応じて、既存データの加工や未掲載情報(例:国別セグメント)の追加などの対応が可能です。詳細はお問い合わせください。
- 適宜更新あり 本レポートは最新情報反映のため適宜更新し、内容構成変更を行う場合があります。ご検討の際はお問い合わせください。
- 翻訳ツール提供対象 PDF対応AI翻訳ツールの無料貸し出しサービスのご利用が可能です
概要
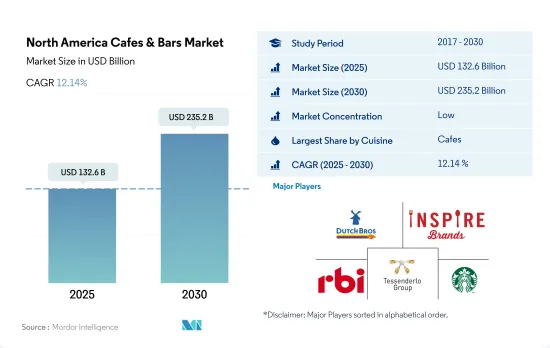
北米のカフェ・バー市場規模は2025年に1,326億米ドルと推定され、2030年には2,352億米ドルに達すると予測され、予測期間中(2025~2030年)のCAGRは12.14%で成長すると予測されます。
コーヒー消費の増加と専門店の台頭が市場成長を後押し
- カフェのサブセグメントは北米フードサービス市場で最も人気があります。同地域ではコーヒーの消費が増加しているため、2019~2022年にかけて売上額で13.53%の成長を示しました。この地域で最も人気のある飲み物は、カプチーノ、アメリカーノ、カフェラテです。例えば、現在アメリカの成人の64%が毎日コーヒーを消費しており、1億5,000万人以上のアメリカ人が2021年には1日約4億杯、年間1,400億杯以上のコーヒーを飲んでいます。
- しかし、国別では、米国が2022年に金額ベースで71.62%と最大の市場シェアを占めています。米国には5万以上のコーヒーショップがあり、その中でも独立系店舗が金額ベースで62.58%と、チェーン系店舗(37.42%)に比べて大きなシェアを占めています。しかし、コーディアルとリキュールの消費量は2021年に9リットルケース当たり約2,760万に達し、同国のバーとパブの売上を増加させました。
- 2020年、このサブセグメントは2019年から金額ベースで約29%の急激な落ち込みを観測しました。COVID-19規制のため、カフェやバーが閉店し、人々は在宅勤務のため外食を避け、コーヒーの消費量が減少しました。全体として、カフェ・バーの販売額は2019~2020年にかけて29.04%と2番目に大きな落ち込みを観測しました。
- コーヒー&ティー専門店のサブセグメントは、予測期間中、金額ベースで14.75%のCAGRを記録し、最も急成長すると予測されます。スペシャルティコーヒーの消費増加により、2021年には特に18~30歳の消費者の間で従来のコーヒーの消費が10~12%減少しました。バブルティーは消費者の間で人気となっています。例えば米国では、2021年には女性の95%がバブルティーを試しているのに対し、男性は81%です。
バーとパブは、ビールと関連する革新的飲料であるクラフトビールに対する消費者の親近感により、最も売上が高いです。
- 北米のカフェ・バー市場は米国が支配的で、調査期間中の推定CAGRは販売額ベースで5.34%でした。米国市場は主にバー&パブでの売上増加(2021~2022年:金額ベース22.71%)が牽引しました。パブでのビール消費もクラフトビールの人気により増加しました。2021年、米国のビール数量は1%増加しました。クラフトビールメーカーの数量は8%増加し、米国のビール市場における小規模・独立系ビールメーカーの数量シェアは13.1%となりました。
- 2022年には、カフェが50.89%と最大のシェアを占め、次いでバー&パブが29.65%でした。同地域のカフェ・サブセグメントの主要原動力は、特に小売店でのコーヒーの消費量の多さです。コーヒーはアメリカ人の66%が毎日飲んでおり、水道水を含む他のどの飲料よりも多く、2021年1月以降約14%増加しています。
- 2022年の金額ベースの市場シェアは、独立系アウトレットが60.49%を占め、残りをチェーン系アウトレットが占めています。カナダは独立系アウトレットの地域別シェアが最も高かったです。このセグメントの2022年の金額シェアは67.72%で、チェーン店のシェアは地域シェアに比べて低かりました。この成長は主に、この地域でチェーン店を展開する企業が、オンタリオ州やケベック州のような人口密度の高い州でのみ拡大が可能であると判断したためです。ノバスコシア州やニューファンドランド・ラブラドール州のような東海岸の他の州では、人口が分散しすぎているため、チェーン店を展開する企業がネットワークを拡大するのは難しいと考えられます。
北米のカフェ・バー市場動向
カナダのカフェ・バーは、手軽で便利なものから、ゆったりとくつろげるものまで、個性的でユニークな様々なダイニング体験を提供しています。
- カフェ・バーの店舗数は2019~2022年にかけて約1,200店舗増加。フランチャイジー店舗数は、各社の拠点拡大に伴い国内で増加しています。検討期間中、フランチャイジー店舗数は毎年4,000店以上増加しました。カフェとバーの数は2022年には13,278店以上に達しました。この数は予測期間中、平均前年比成長率5.4%を記録すると予測されます。
- 2022年の店舗数では、カフェ・バーが第3位のシェアを占めています。独立型のカフェ・バーは、都市近隣から郊外のストリップモールや農村部まで、さまざまな環境で見かけることができます。ラテ、カプチーノ、アメリカーノ、エスプレッソなど、さまざまな種類のコーヒーを提供しています。2023年第1四半期、最大店舗数を誇るコーヒーチェーンの主要企業は、ティム・ホートンズ(3,568店)、スターバックス(1,417店)、マックカフェ(1,400店)であり、人気のバーはシビル・リバティーズとボタニストで、さまざまな種類のワイン、クラフトビール、ウォッカ、モクテル/カクテルを提供しています。また、これらのバーでは、個性的でユニークな、便利で素早い食事体験ができます。
- カナダでは平均して1日に3杯近くのコーヒーを飲むため、1日当たりの注文数が増加し、2022年には1日当たり約114杯に達しました。同年、カナダではカプチーノとラテの消費量が30%増加したため、コーヒーの売上が伸び、消費者の需要に応えるために店舗を拡大する動きが活発化しました。
価格上昇と需要増加がカフェやバーの収益を押し上げる
- コーヒーの消費量と価格は、レビュー期間中に着実に上昇しました。米国人のコーヒーに対する嗜好は過去10年間で高まっています。2015年以降、米国のコーヒー消費量は5~10%増加しています。アメリカ人の約60%が毎日コーヒーを飲んでいます。アメリカ人女性は年間平均2,325米ドル、アメリカ人男性は年間約1,920米ドルをコーヒーに費やしています。また、カフェは従来のコーヒーや紅茶よりも高価なメニューやスペシャルティドリンクを増やしています。プレミアムコーヒーや職人的な淹れ方にこだわるサードウェーブコーヒーショップの人気が高まっていることも、スペシャルティコーヒーの成長に寄与しています。
- そのため、カフェやバーの平均注文額は2017~2022年にかけて16.33%増加しました。上昇インフレ率は2017~2022年にかけて平均3~4%増加し、年間注文数は2020~2022年にかけて41.11%増加しました。米国人に好まれる人気のコーヒーや飲料には、カプチーノ(1杯4.5米ドル)、ラテ(1杯5米ドル)、アメリカーノ(1杯3.8米ドル)、ホットチョコレート(1杯4.75米ドル)、オレンジジュース(グラス6.5米ドル)、クラフトビール(16オンス11米ドル)、ワイン(グラス10米ドル)、カクテル(1.5オンスグラス15米ドル)、ウイスキー(ペグ14米ドル)などがあります。
- 米国では、2022年のアルコール売上は2020年比で22.4%増加し、そのうちバー、パブ、ナイトクラブ経由の売上が50%を超えました。同国の消費者は地元の味を好み、プレミアムクラフト・ビールに高いお金を払うことを厭わないです。このため、バー・パブ部門は予測期間中も好調を維持するとみられます。
北米のカフェ・バー産業概要
北米のカフェ・バー市場は細分化されており、上位5社で28.19%を占めています。この市場の主要企業は、Dutch Bros Inc.、Inspire Brands Inc.、Restaurant Brands International Inc.、Smoothie King Franchises Inc.、Starbucks Corporationなどです。
その他の特典
- エクセル形式の市場予測(ME)シート
- 3ヶ月のアナリストサポート
目次
第1章 エグゼクティブサマリーと主要調査結果
第2章 レポートのオファー
第3章 イントロダクション
- 調査の前提条件と市場定義
- 調査範囲
- 調査手法
第4章 主要産業動向
- アウトレット数
- カナダ
- メキシコ
- 米国
- 平均注文金額
- カナダ
- メキシコ
- 米国
- 規制の枠組み
- 米国
第5章 市場セグメンテーション
- 料理
- バー&パブ
- カフェ
- ジュース/スムージー/デザートバー
- コーヒー・紅茶専門店
- アウトレット
- チェーン店
- 独立系アウトレット
- ロケーション
- レジャー
- 宿泊施設
- 小売
- 独立型
- 旅行
- 国別
- カナダ
- メキシコ
- 米国
- その他の北米地域
第6章 競争情勢
- 主要な戦略動向
- 市場シェア分析
- 企業情勢
- 企業プロファイル
- Dutch Bros Inc.
- Focus Brands LLC
- Inspire Brands Inc.
- International Dairy Queen Inc.
- Jab Holding Company SARL
- McDonald's Corporation
- MTY Food Group Inc.
- Restaurant Brands International Inc.
- Smoothie King Franchises Inc.
- Starbucks Corporation
- Tropical Smoothie Cafe LLC
第7章 CEOへの主要戦略的質問
第8章 付録
- 世界概要
- 概要
- ファイブフォース分析フレームワーク
- 世界のバリューチェーン分析
- 市場力学(DROs)
- 情報源と参考文献
- 図表一覧
- 主要な洞察
- データパック
- 用語集
目次
The North America Cafes & Bars Market size is estimated at 132.6 billion USD in 2025, and is expected to reach 235.2 billion USD by 2030, growing at a CAGR of 12.14% during the forecast period (2025-2030).
Increasing consumption of coffee and the rise of speciality stores favor the market growth
- The cafes sub-segment is the most popular in the North American foodservice market. It witnessed a growth of 13.53% in sales value from 2019 to 2022 due to the increasing consumption of coffee in the region. The most popular drinks in the region are cappuccino, Americano, and latte. For instance, 64% of American adults currently consume coffee every day, and more than 150 million Americans had about 400 million cups of coffee per day or more than 140 billion cups per year in 2021.
- However, by country, the United States held the largest market share of 71.62% by value in 2022. There are over 50,000 coffee shops in the United States, among which independent outlets accounted for the major share of 62.58% in value terms compared to the chained outlets (37.42%). However, the consumption of cordials and liqueurs amounted to about 27.6 million per nine-liter cases in the United States in 2021, which increased the sales for bars and pubs in the country.
- In 2020, the sub-segment observed a sudden dip of around 29% in value terms from 2019. Due to COVID-19 regulations, cafes and bars were closed, and people were avoiding dine-out options as they were working from home, which reduced coffee consumption. Overall, the sales value of cafes and bars observed the second-largest dip of 29.04% from 2019 to 2020.
- The specialist coffee & tea shops sub-segment is projected to be the fastest-growing, with a CAGR of 14.75% by value during the forecast period. Owing to the rising consumption of specialty coffee, the consumption of traditional coffee declined by 10-12% in 2021, especially among consumers aged 18-30 years. Bubble tea is becoming popular among consumers. For instance, in the United States, in 2021, 95% of women tried bubble tea versus 81% of males.
Bars and pubs are the highest grosser owing to consumer affinity towards beer and related innovative beverages - craft beer
- The North American cafes & bars market was dominated by the United States, with an estimated CAGR of 5.34% by sales value during the study period. The US market was primarily driven by the increasing sales at bars & pubs (2021-2022: 22.71% by value), attributed to the rising footfall in these outlets after the pandemic. Beer consumption at pubs also increased due to the popularity of craft beer. In 2021, beer sales in the United States increased by 1%. Volume sales of craft brewers increased by 8%, bringing the volume share of the small and independent brewers in the US beer market to 13.1%.
- Cafes held the largest share of the market, i.e., 50.89%, in 2022, followed by bars & pubs, with 29.65%. The primary driver of the cafes sub-segment in the region is the high consumption of coffee, especially at retail outlets. Coffee is consumed daily by 66% of Americans, more than any other beverage, including tap water, increasing by about 14% since January 2021.
- Independent outlets held a 60.49% share of the market by value in 2022, with chained outlets holding the rest. Canada held the region's highest share of independent outlets. The segment recorded a 67.72% value share in 2022, with chained outlets accounting for a low share compared to the regional share. This growth was mainly due to companies that operate chained outlets in the region finding it viable to expand only in densely populated provinces like Ontario and Quebec. In the other provinces on the East Coast, like Nova Scotia and Newfoundland & Labrador, chained restaurant companies may find it difficult to expand their networks due to the population being spread too thin.
North America Cafes & Bars Market Trends
Canadian coffee shops and bars offer a variety of personalized and unique dining experiences, from quick and convenient to leisurely and relaxing
- The number of cafes and bars increased by around 1,200 from 2019 to 2022. The number of franchisee establishments is increasing in the country as the companies are expanding their footprint. The number of franchisee outlets increased by more than 4,000 each year during the review period. The number of cafes and bars reached more than 13,278 restaurants in 2022. This number is projected to record an average Y-o-Y growth rate of 5.4% during the forecast period.
- Cafes and bars accounted for the third-largest share in terms of the number of outlets in 2022. Standalone cafes and bars can be found in a variety of settings, from urban neighborhoods to suburban strip malls and rural areas. They offer a range of coffee, including latte, cappuccino, Americano, and espresso. In the first quarter of 2023, the key players of coffee chains with the maximum number of outlets were Tim Hortons (3,568 outlets), Starbucks (1,417 outlets), McCafe (1,400 restaurants), and the popular bars were Civil Liberties and Botanist, offering different types of wine, craft beer, vodka, and mocktails/cocktails. These bars also provide a convenient and fast dining experience that is personalized and unique.
- An average person in Canada consumes almost three cups of coffee per day, thus increasing the number of orders per day, which reached around 114 orders per day in 2022. In the same year, the consumption of cappuccinos and lattes increased by 30% in Canada, thus boosting coffee sales and encouraging outlets to expand to cater to consumer demand.
Rising prices and increased demand boost revenues at cafes and bars
- The consumption and price of coffee steadily rose over the review period. Americans' preference for coffee has grown over the last decade. Since 2015, coffee consumption in the United States has increased by 5-10%. Around 60% of Americans drink coffee daily. American women spent an average of USD 2,325 per year on coffee, and American men spent around USD 1,920 per year. Also, cafes are expanding their menus or specialty drinks that are more expensive than traditional coffee or tea. The increasing popularity of third-wave coffee shops, which focus on premium coffee and artisanal brewing techniques, has contributed to the growth of specialty coffee.
- Thus, the average order value for cafes and bars increased by 16.33% from 2017 to 2022. The rising inflation rate increased by an average of 3-4% from 2017 to 2022, and the number of orders per year increased by 41.11% from 2020 to 2022. Popular coffee and drinks preferred by Americans include Cappuccino (USD 4.5 per cup), Latte (USD 5 per cup), Americano (USD 3.8 per cup), Hot Chocolate (4.75 per cup), Orange Juice (USD 6.5 per glass), Craft Beer (USD 11 per 16 oz), Wine (USD 10 per glass), Cocktails (USD 15 per glass of 1.5 oz), and Whiskey (USD 14 per peg).
- In the United States, alcohol sales increased by 22.4% in 2022 compared to 2020, of which more than 50% of sales were generated through bars, pubs, and nightclubs. Consumers in the country prefer local tastes and are willing to pay more for premium-crafted beers. Thus, the bars & pubs segment is likely to remain strong during the forecast period.
North America Cafes & Bars Industry Overview
The North America Cafes & Bars Market is fragmented, with the top five companies occupying 28.19%. The major players in this market are Dutch Bros Inc., Inspire Brands Inc., Restaurant Brands International Inc., Smoothie King Franchises Inc. and Starbucks Corporation (sorted alphabetically).
Additional Benefits:
- The market estimate (ME) sheet in Excel format
- 3 months of analyst support
TABLE OF CONTENTS
1 EXECUTIVE SUMMARY & KEY FINDINGS
2 REPORT OFFERS
3 INTRODUCTION
- 3.1 Study Assumptions & Market Definition
- 3.2 Scope of the Study
- 3.3 Research Methodology
4 KEY INDUSTRY TRENDS
- 4.1 Number Of Outlets
- 4.1.1 Canada
- 4.1.2 Mexico
- 4.1.3 United States
- 4.2 Average Order Value
- 4.2.1 Canada
- 4.2.2 Mexico
- 4.2.3 United States
- 4.3 Regulatory Framework
- 4.3.1 United States
5 MARKET SEGMENTATION (includes market size in Value in USD, Forecasts up to 2030 and analysis of growth prospects)
- 5.1 Cuisine
- 5.1.1 Bars & Pubs
- 5.1.2 Cafes
- 5.1.3 Juice/Smoothie/Desserts Bars
- 5.1.4 Specialist Coffee & Tea Shops
- 5.2 Outlet
- 5.2.1 Chained Outlets
- 5.2.2 Independent Outlets
- 5.3 Location
- 5.3.1 Leisure
- 5.3.2 Lodging
- 5.3.3 Retail
- 5.3.4 Standalone
- 5.3.5 Travel
- 5.4 Country
- 5.4.1 Canada
- 5.4.2 Mexico
- 5.4.3 United States
- 5.4.4 Rest of North America
6 COMPETITIVE LANDSCAPE
- 6.1 Key Strategic Moves
- 6.2 Market Share Analysis
- 6.3 Company Landscape
- 6.4 Company Profiles (includes Global Level Overview, Market Level Overview, Core Business Segments, Financials, Headcount, Key Information, Market Rank, Market Share, Products and Services, and Analysis of Recent Developments).
- 6.4.1 Dutch Bros Inc.
- 6.4.2 Focus Brands LLC
- 6.4.3 Inspire Brands Inc.
- 6.4.4 International Dairy Queen Inc.
- 6.4.5 Jab Holding Company SARL
- 6.4.6 McDonald's Corporation
- 6.4.7 MTY Food Group Inc.
- 6.4.8 Restaurant Brands International Inc.
- 6.4.9 Smoothie King Franchises Inc.
- 6.4.10 Starbucks Corporation
- 6.4.11 Tropical Smoothie Cafe LLC
7 KEY STRATEGIC QUESTIONS FOR FOODSERVICE CEOS
8 APPENDIX
- 8.1 Global Overview
- 8.1.1 Overview
- 8.1.2 Porter's Five Forces Framework
- 8.1.3 Global Value Chain Analysis
- 8.1.4 Market Dynamics (DROs)
- 8.2 Sources & References
- 8.3 List of Tables & Figures
- 8.4 Primary Insights
- 8.5 Data Pack
- 8.6 Glossary of Terms
- 発行日
- 発行
- Mordor Intelligence
- ページ情報
- 英文 169 Pages
- 納期
- 2~3営業日


